| Param | Original file | Final file |
|---|---|---|
| Filename | modeM0/AS1A14_083T04_9000006550_56204cztM0_level2.fits | modeM0/AS1A14_083T04_9000006550_56204cztM0_level2_quad_clean.evt |
| Size (bytes) | 735,315,840 | 80,352,000 |
| Size | 701.3 MB | 76.6 MB |
| Events in quadrant A | 9,460,290 | 402,088 |
| Events in quadrant B | 7,186,037 | 497,358 |
| Events in quadrant C | 3,245,739 | 594,455 |
| Events in quadrant D | 6,825,502 | 487,725 |
| Mode SS | |||
|---|---|---|---|
| Quadrant | BADHDUFLAG | Total packets | Discarded packets |
| A | 0 | 130 | 0 |
| B | 0 | 130 | 0 |
| C | 0 | 130 | 0 |
| D | 0 | 130 | 0 |
| Mode M9 | |||
|---|---|---|---|
| Quadrant | BADHDUFLAG | Total packets | Discarded packets |
| A | 0 | 8 | 0 |
| B | 0 | 8 | 0 |
| C | 0 | 8 | 0 |
| D | 0 | 8 | 0 |
| Mode M0 | |||
|---|---|---|---|
| Quadrant | BADHDUFLAG | Total packets | Discarded packets |
| A | 0 | 32487 | 1 |
| B | 0 | 25897 | 1 |
| C | 0 | 14576 | 1 |
| D | 0 | 24701 | 1 |
| Quadrant | Total seconds | Saturated seconds | Saturation percentage |
|---|---|---|---|
| A | 6470 | 2418 | 37.372488% |
| B | 6470 | 1741 | 26.908810% |
| C | 6471 | 69 | 1.066296% |
| D | 6471 | 883 | 13.645495% |
Noise dominated data is calculated using 1-second bins in cleaned event files. If a bin has >2000 counts, and if more than 50% of those come from <1% of pixels, then it is considered to be noise-dominated and hence unusable.
| Quadrant | # 1 sec bins | Bins with >0 counts | Bins with >2000 counts | High rate bins dominated by noise | Noise dominated (total time) | Noise dominated (detector-on time) | Marked lightcurve |
|---|---|---|---|---|---|---|---|
| A | 7279 | 6470 | 2236 | 2236 | 30.72% | 34.56% | 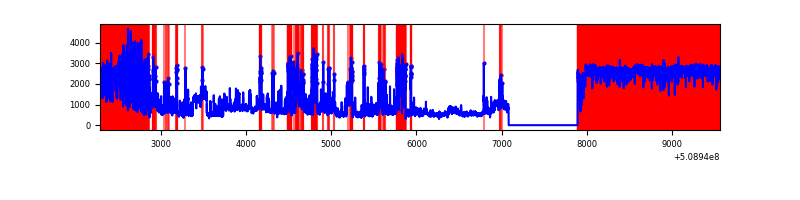 |
| B | 7280 | 6470 | 1267 | 1267 | 17.40% | 19.58% | 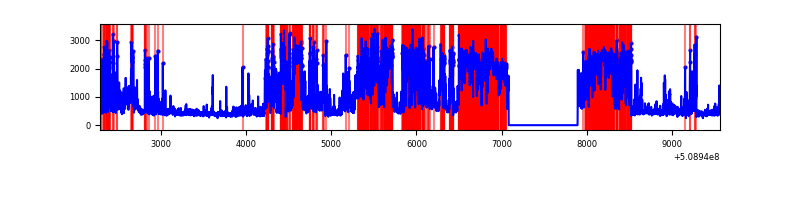 |
| C | 7281 | 6472 | 54 | 54 | 0.74% | 0.83% | 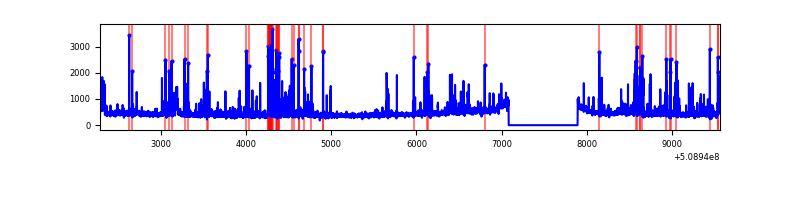 |
| D | 7281 | 6471 | 843 | 843 | 11.58% | 13.03% | 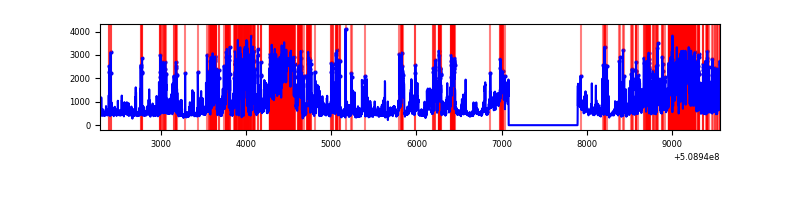 |
Top three noisy pixels from each quadrant. If the there are fewer than three noisy pixels in the level2.evt file, extra rows are filled as -1
| Pixel properties | Quadrant properties | ||||||
|---|---|---|---|---|---|---|---|
| Quadrant | DetID | PixID | Counts | Sigma | Mean | Median | Sigma |
| A | 12 | 115 | 4277596 | 30989.92 | 552 | 539 | 138.0 |
| A | 8 | 176 | 1294655 | 9376.67 | 552 | 539 | 138.0 |
| A | 15 | 32 | 866713 | 6275.97 | 552 | 539 | 138.0 |
| B | 4 | 171 | 4316229 | 33932.28 | 596 | 575 | 127.2 |
| B | 5 | 185 | 229491 | 1799.88 | 596 | 575 | 127.2 |
| B | 0 | 231 | 57689 | 449.06 | 596 | 575 | 127.2 |
| C | 12 | 252 | 409141 | 2237.18 | 662 | 655 | 182.6 |
| C | 12 | 254 | 91648 | 498.35 | 662 | 655 | 182.6 |
| C | 6 | 223 | 48889 | 264.17 | 662 | 655 | 182.6 |
| D | 11 | 129 | 3071470 | 16978.46 | 629 | 600 | 180.9 |
| D | 6 | 239 | 380822 | 2102.2 | 629 | 600 | 180.9 |
| D | 13 | 153 | 205857 | 1134.84 | 629 | 600 | 180.9 |
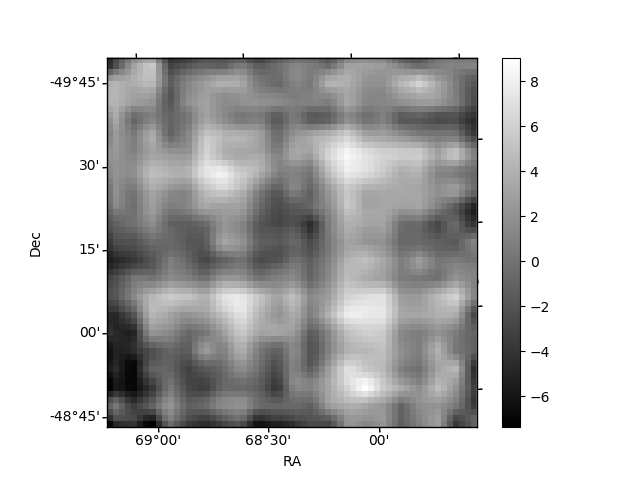
Histogram calculated using DETX and DETY for each event in the final _common_clean file
| Quadrant A | 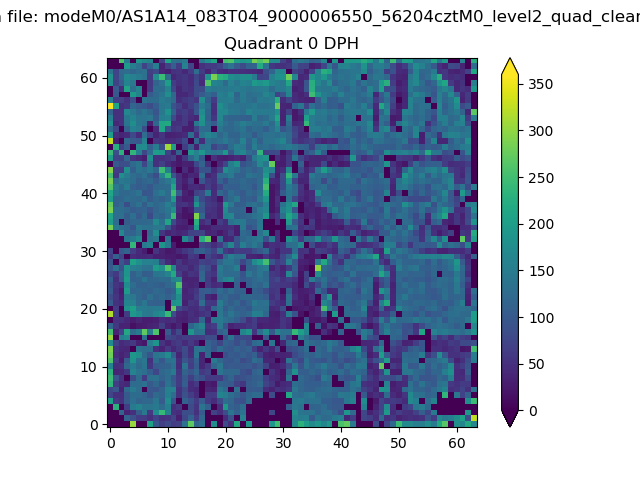 |
 |
Quadrant B |
|---|---|---|---|
| Quadrant D |  |
 |
Quadrant C |
| Plot type | Count rate plots | Images |
|---|---|---|
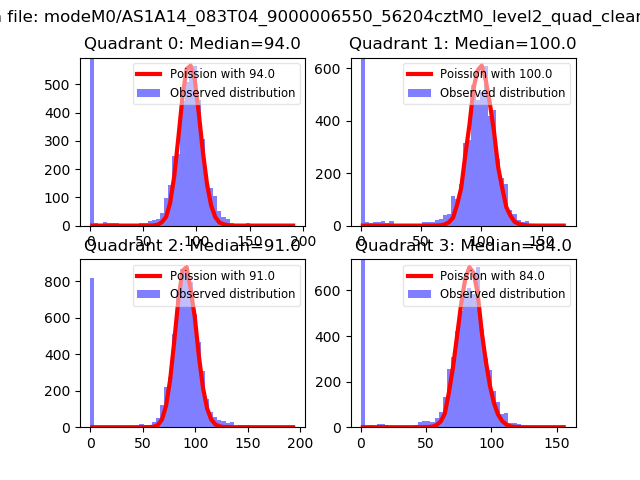
| Comparison with Poisson distribution Blue bars denote a histogram of data divided into 1 sec bins. Red curve is a Poisson curve with rate = median count rate of data. |
 |
 |
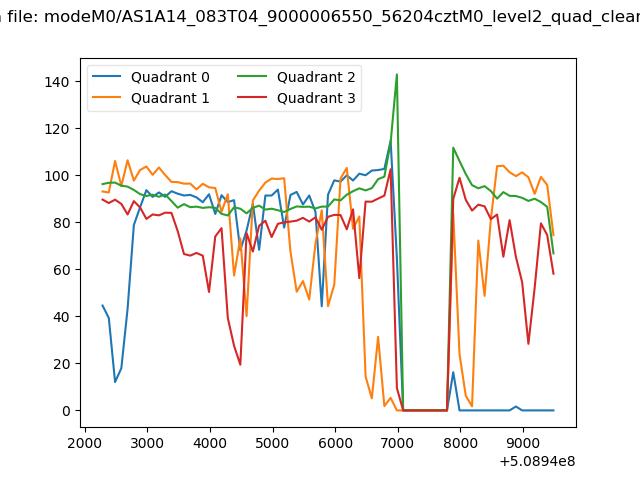
| Quadrant-wise count rates Data is divided into 100 sec bins |
 |
|
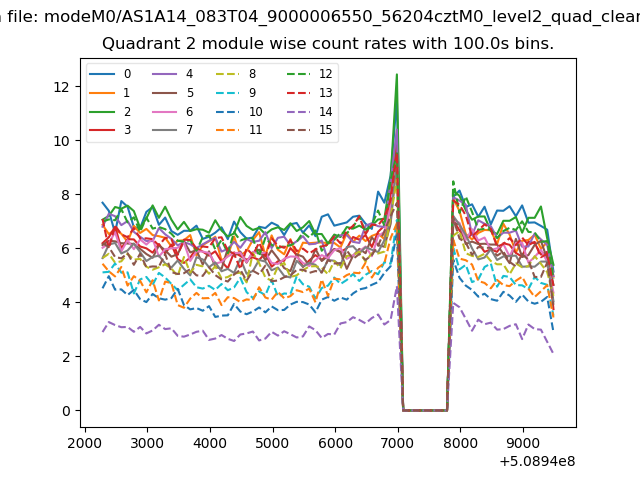
| Module-wise count rates for Quadrant A Data is divided into 100 sec bins |
 |
 |
| Module-wise count rates for Quadrant B Data is divided into 100 sec bins |
 |
 |
| Module-wise count rates for Quadrant C Data is divided into 100 sec bins |
 |
 |
| Module-wise count rates for Quadrant D Data is divided into 100 sec bins |
 |
 |
| Parameter | Plot |
|---|---|
| CZT HV Monitor | 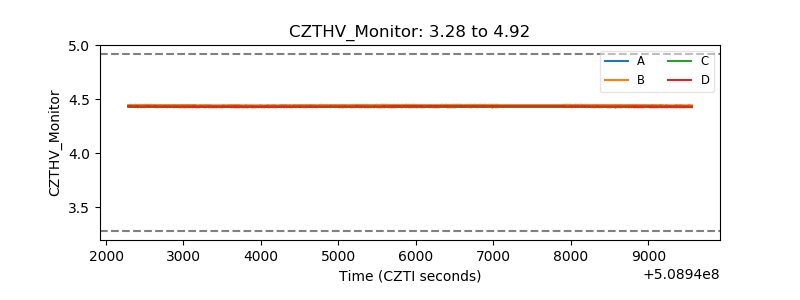 |
| D_VDD | 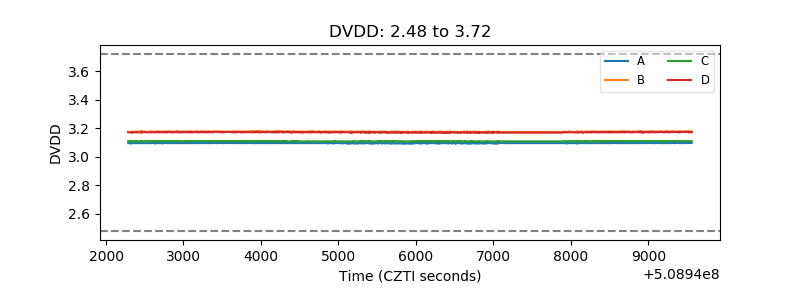 |
| Temperature 1 | 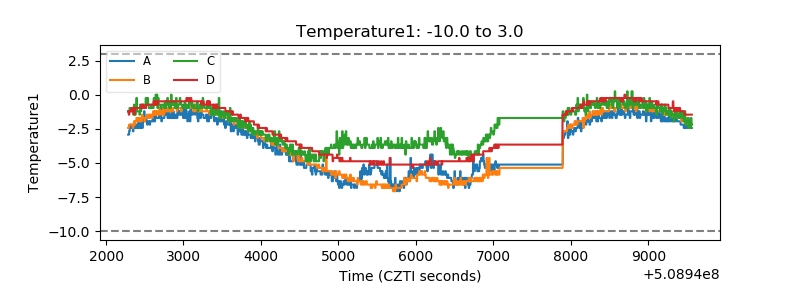 |
| Veto HV Monitor | 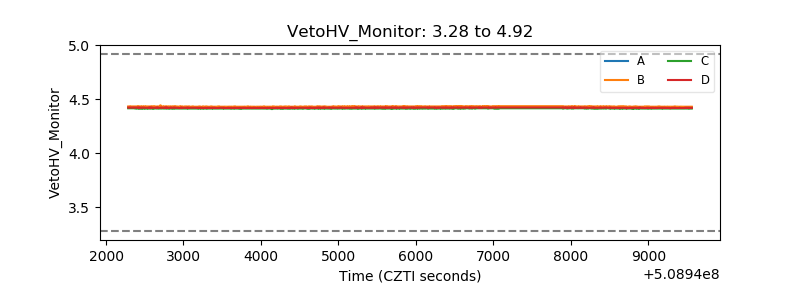 |
| Veto LLD | 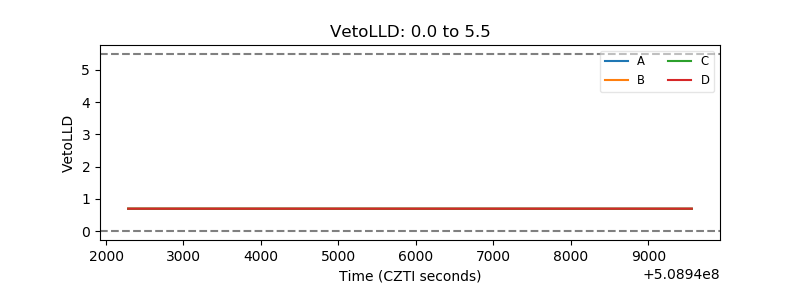 |
| Alpha Counter |  |
| _CPM_Rate |  |
| CZT Counter | 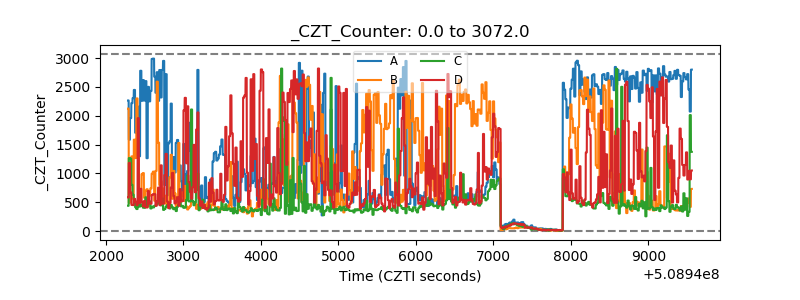 |
| +2.5 Volts monitor |  |
| +5 Volts monitor |  |
| _ROLL_ROT | 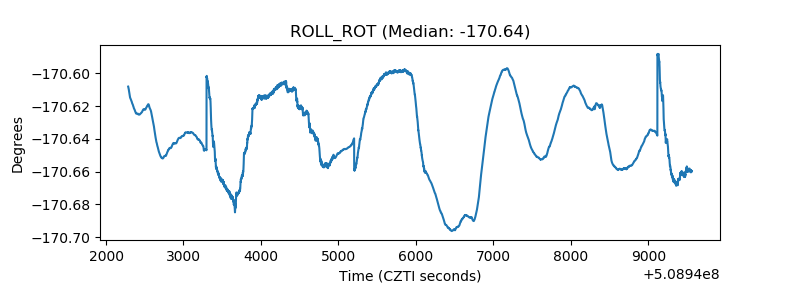 |
| _Roll_DEC | 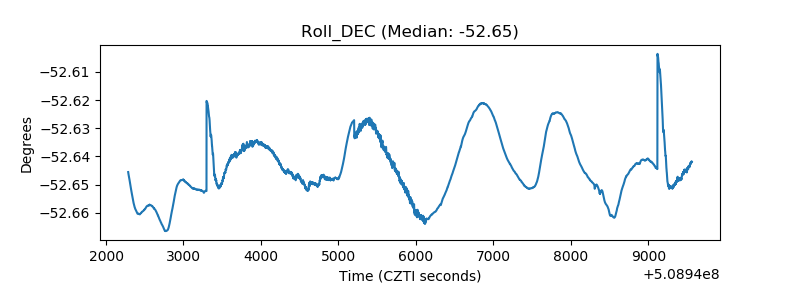 |
| _Roll_RA | 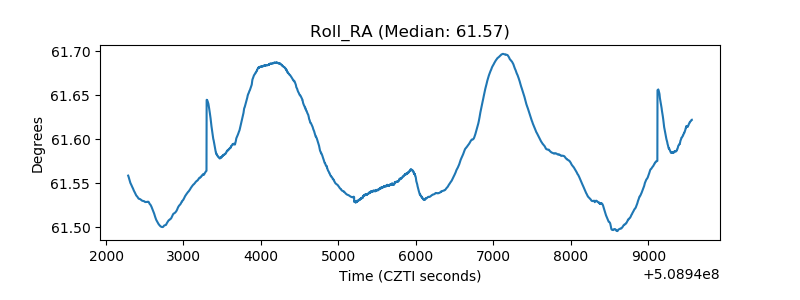 |
| Veto Counter | 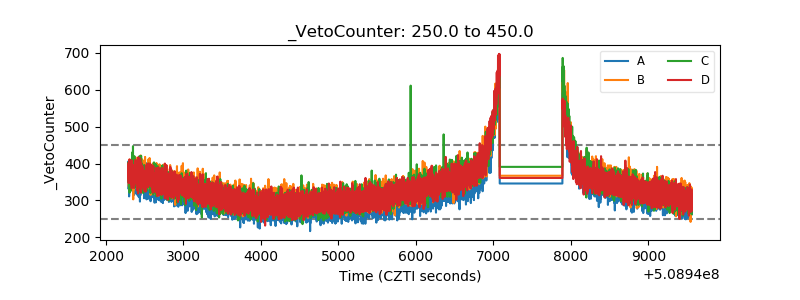 |