| Param | Original file | Final file |
|---|---|---|
| Filename | modeM0/AS1A14_083T04_9000006550_56205cztM0_level2.fits | modeM0/AS1A14_083T04_9000006550_56205cztM0_level2_quad_clean.evt |
| Size (bytes) | 872,974,080 | 82,287,360 |
| Size | 832.5 MB | 78.5 MB |
| Events in quadrant A | 15,909,635 | 176,706 |
| Events in quadrant B | 4,748,051 | 677,509 |
| Events in quadrant C | 3,497,085 | 630,430 |
| Events in quadrant D | 7,616,822 | 518,665 |
| Mode SS | |||
|---|---|---|---|
| Quadrant | BADHDUFLAG | Total packets | Discarded packets |
| A | 0 | 142 | 0 |
| B | 0 | 142 | 0 |
| C | 0 | 142 | 0 |
| D | 0 | 142 | 0 |
| Mode M9 | |||
|---|---|---|---|
| Quadrant | BADHDUFLAG | Total packets | Discarded packets |
| A | 0 | 4 | 0 |
| B | 0 | 4 | 0 |
| C | 0 | 4 | 0 |
| D | 0 | 4 | 0 |
| Mode M0 | |||
|---|---|---|---|
| Quadrant | BADHDUFLAG | Total packets | Discarded packets |
| A | 0 | 51982 | 1 |
| B | 0 | 19142 | 1 |
| C | 0 | 15793 | 1 |
| D | 0 | 27530 | 1 |
| Quadrant | Total seconds | Saturated seconds | Saturation percentage |
|---|---|---|---|
| A | 7011 | 5324 | 75.937812% |
| B | 7012 | 470 | 6.702795% |
| C | 7012 | 111 | 1.583001% |
| D | 7011 | 1136 | 16.203109% |
Noise dominated data is calculated using 1-second bins in cleaned event files. If a bin has >2000 counts, and if more than 50% of those come from <1% of pixels, then it is considered to be noise-dominated and hence unusable.
| Quadrant | # 1 sec bins | Bins with >0 counts | Bins with >2000 counts | High rate bins dominated by noise | Noise dominated (total time) | Noise dominated (detector-on time) | Marked lightcurve |
|---|---|---|---|---|---|---|---|
| A | 7291 | 7011 | 5142 | 5142 | 70.53% | 73.34% | 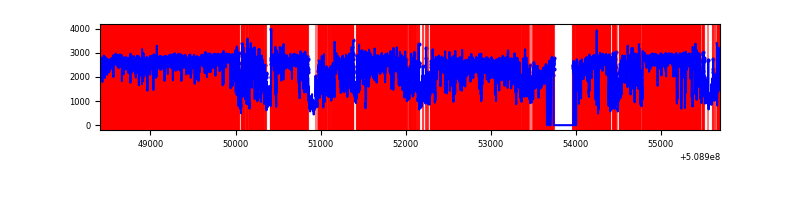 |
| B | 7292 | 7016 | 205 | 205 | 2.81% | 2.92% | 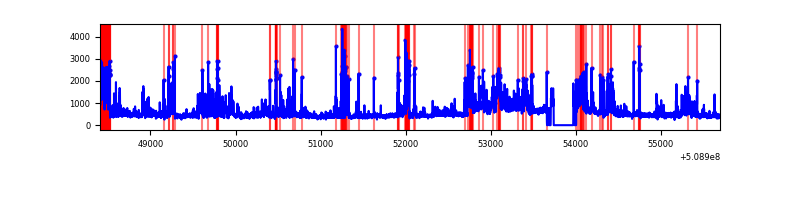 |
| C | 7292 | 7016 | 67 | 67 | 0.92% | 0.95% | 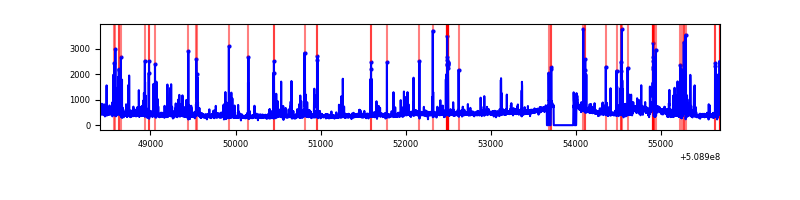 |
| D | 7291 | 7014 | 1082 | 1082 | 14.84% | 15.43% | 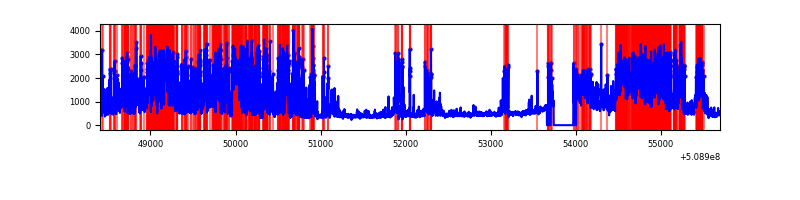 |
Top three noisy pixels from each quadrant. If the there are fewer than three noisy pixels in the level2.evt file, extra rows are filled as -1
| Pixel properties | Quadrant properties | ||||||
|---|---|---|---|---|---|---|---|
| Quadrant | DetID | PixID | Counts | Sigma | Mean | Median | Sigma |
| A | 12 | 115 | 12006281 | 101765.31 | 466 | 454 | 118.0 |
| A | 8 | 176 | 933007 | 7904.62 | 466 | 454 | 118.0 |
| A | 15 | 32 | 549684 | 4655.45 | 466 | 454 | 118.0 |
| B | 4 | 171 | 796775 | 5138.91 | 727 | 700 | 154.9 |
| B | 5 | 185 | 673553 | 4343.47 | 727 | 700 | 154.9 |
| B | 0 | 231 | 81818 | 523.64 | 727 | 700 | 154.9 |
| C | 12 | 252 | 433895 | 2198.92 | 718 | 710 | 197.0 |
| C | 9 | 237 | 91681 | 461.78 | 718 | 710 | 197.0 |
| C | 6 | 223 | 52657 | 263.69 | 718 | 710 | 197.0 |
| D | 11 | 129 | 2796280 | 14468.46 | 680 | 652 | 193.2 |
| D | 6 | 239 | 711711 | 3680.01 | 680 | 652 | 193.2 |
| D | 13 | 153 | 424759 | 2194.92 | 680 | 652 | 193.2 |
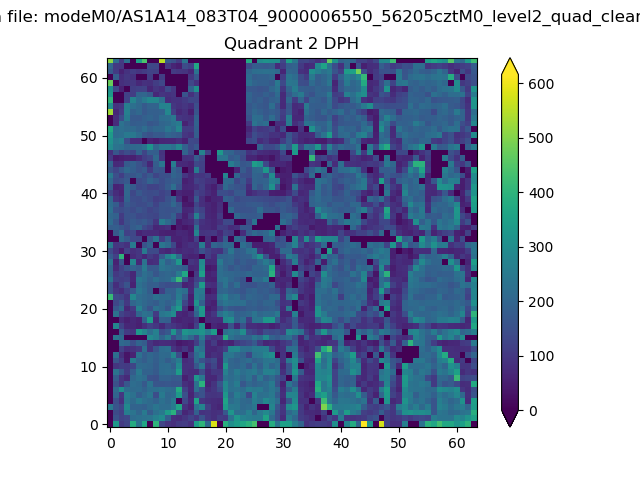
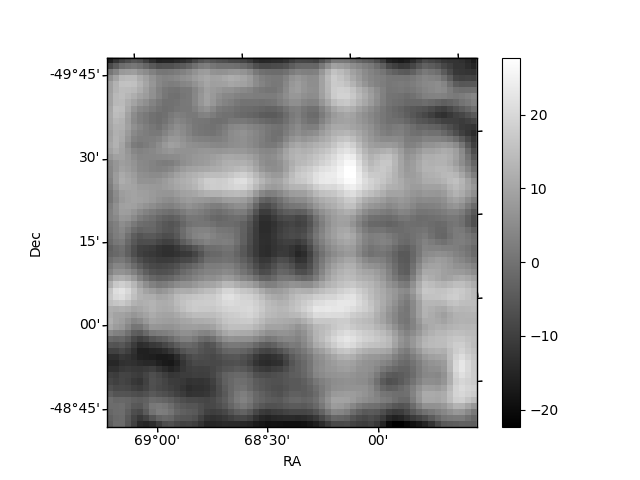
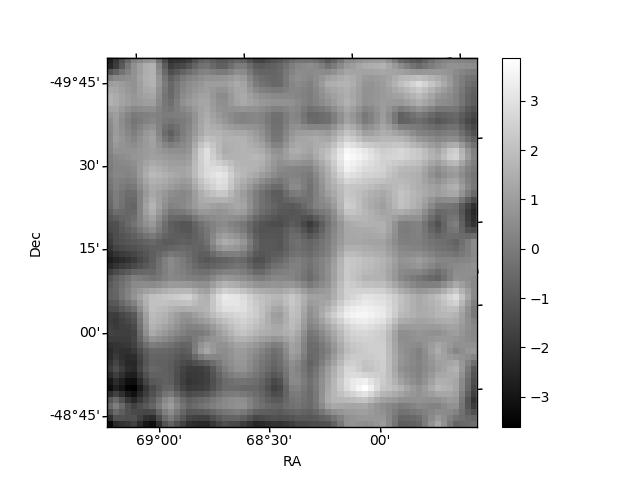
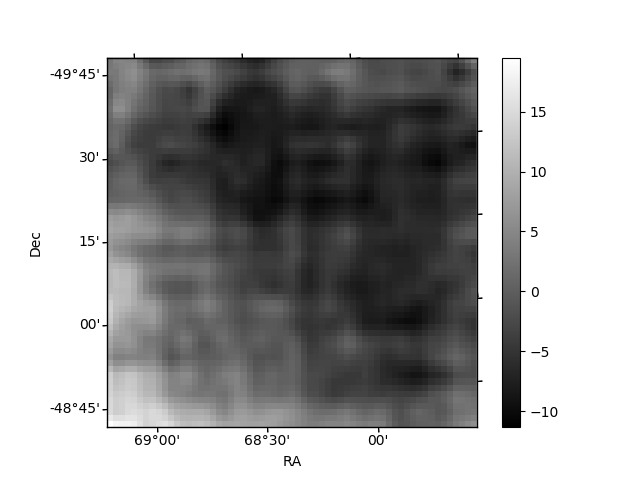
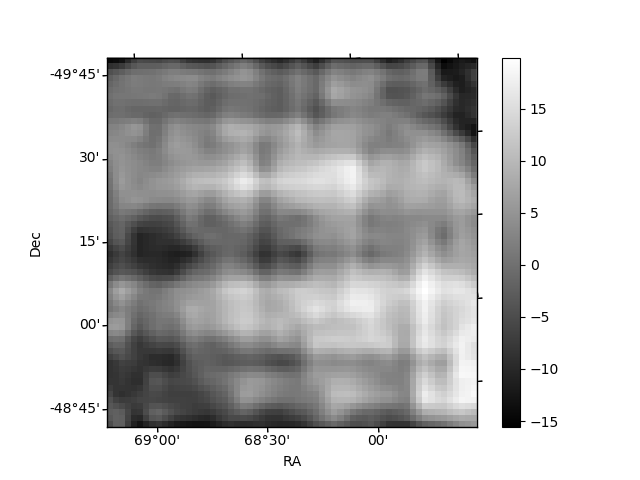
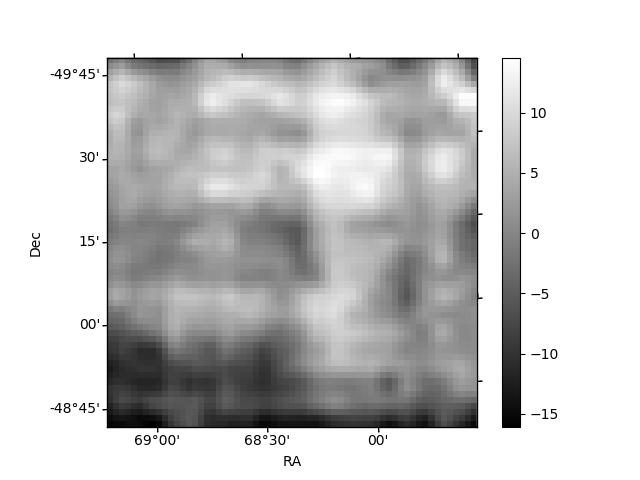
Histogram calculated using DETX and DETY for each event in the final _common_clean file
| Quadrant A | 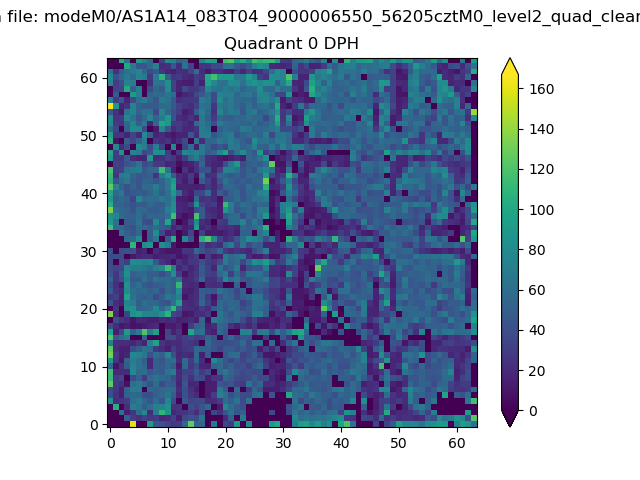 |
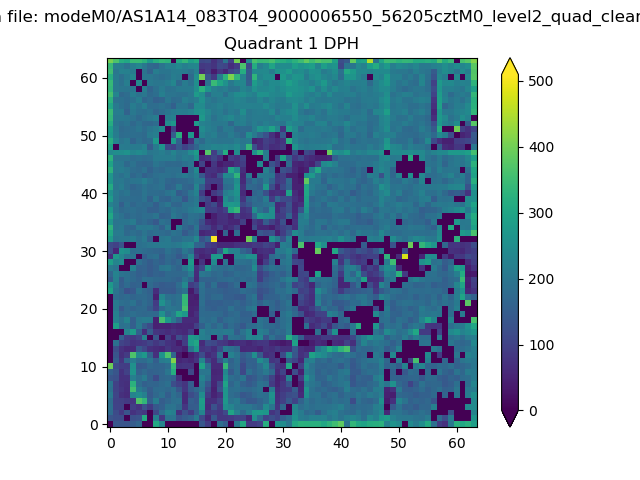 |
Quadrant B |
|---|---|---|---|
| Quadrant D | 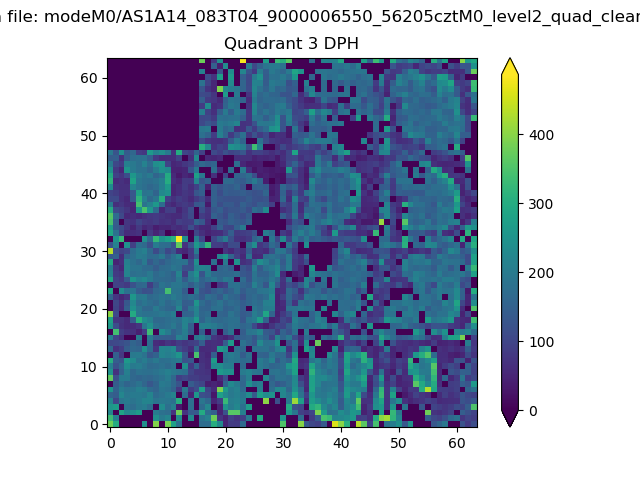 |
 |
Quadrant C |
| Plot type | Count rate plots | Images |
|---|---|---|
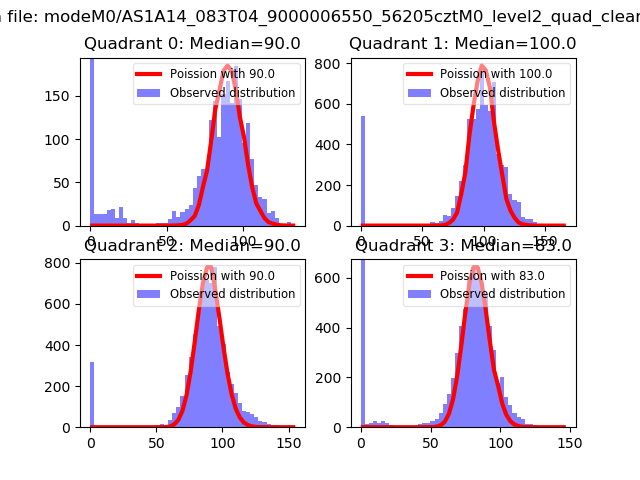
| Comparison with Poisson distribution Blue bars denote a histogram of data divided into 1 sec bins. Red curve is a Poisson curve with rate = median count rate of data. |
 |
 |
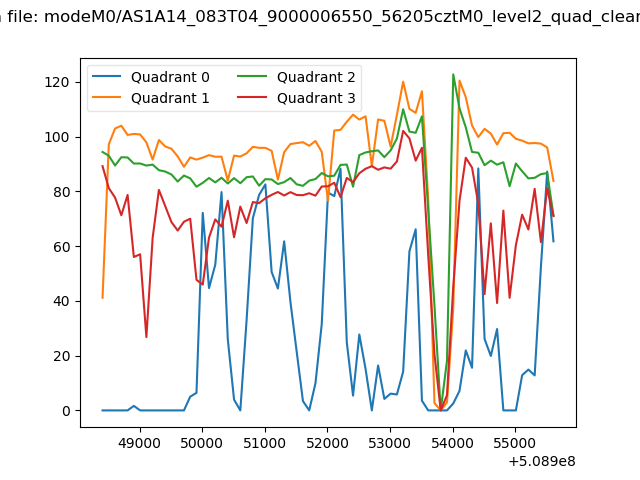
| Quadrant-wise count rates Data is divided into 100 sec bins |
 |
|
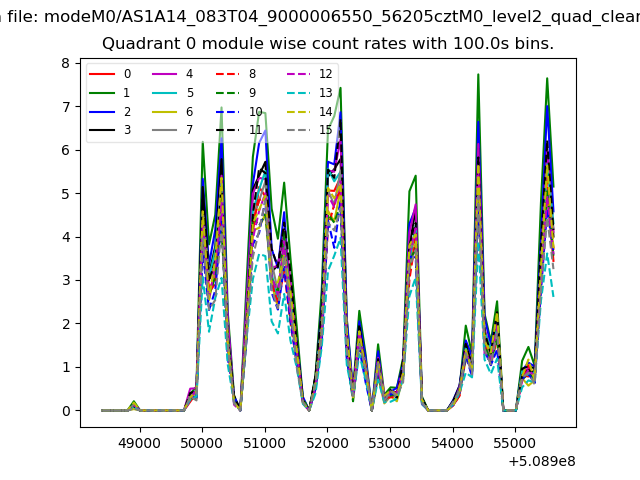
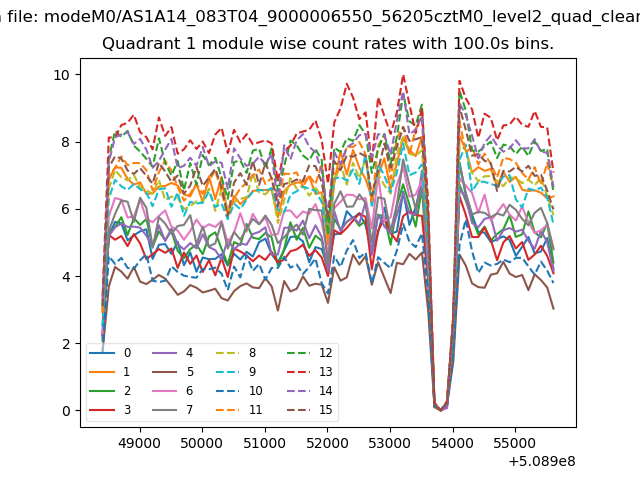
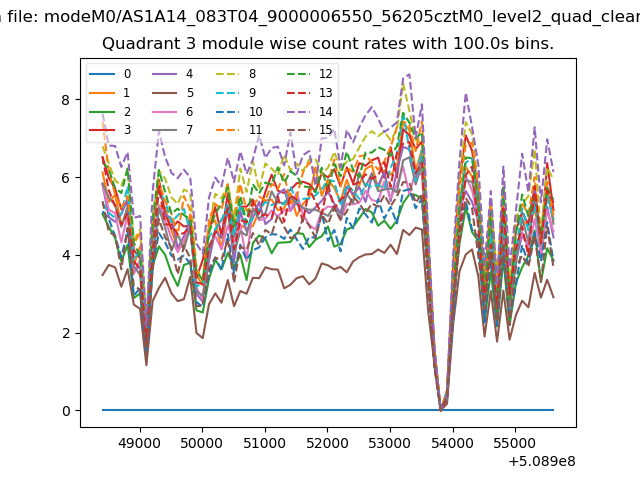
| Module-wise count rates for Quadrant A Data is divided into 100 sec bins |
 |
 |
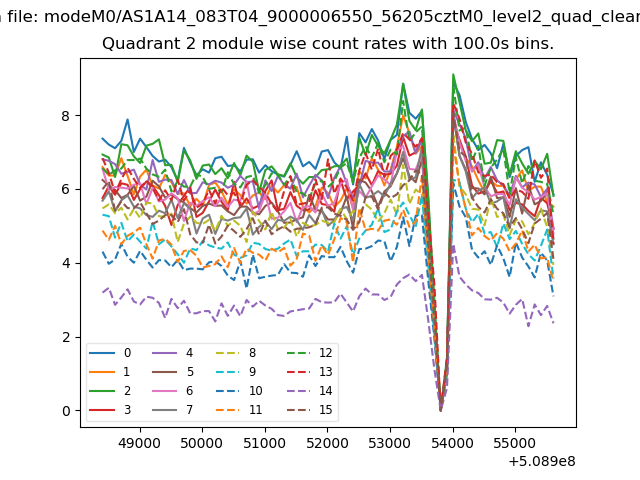
| Module-wise count rates for Quadrant B Data is divided into 100 sec bins |
 |
 |
| Module-wise count rates for Quadrant C Data is divided into 100 sec bins |
 |
 |
| Module-wise count rates for Quadrant D Data is divided into 100 sec bins |
 |
 |
| Parameter | Plot |
|---|---|
| CZT HV Monitor |  |
| D_VDD | 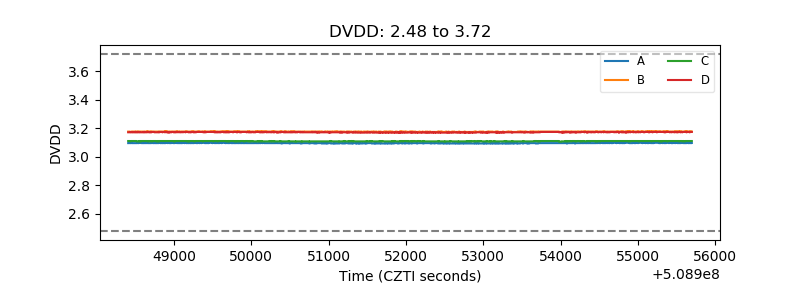 |
| Temperature 1 | 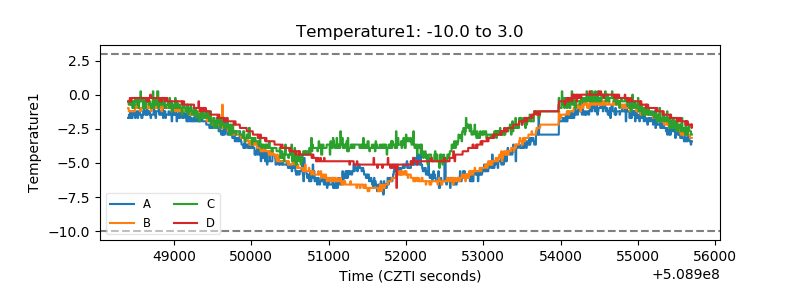 |
| Veto HV Monitor | 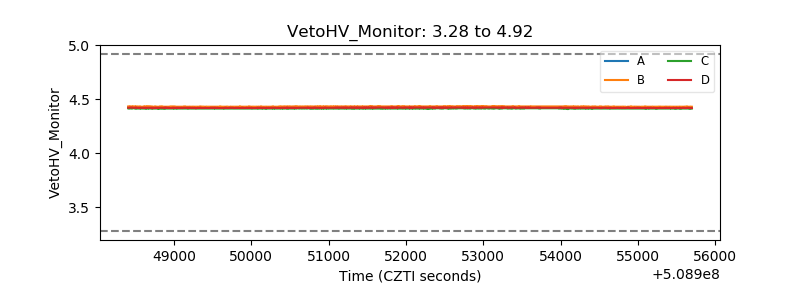 |
| Veto LLD | 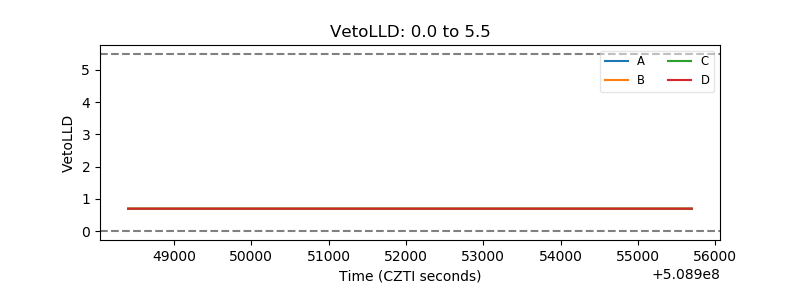 |
| Alpha Counter | 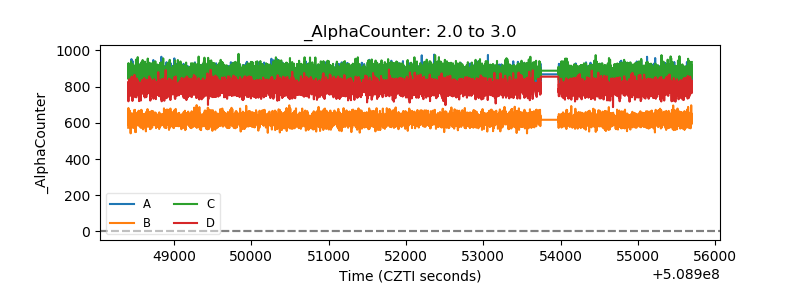 |
| _CPM_Rate | 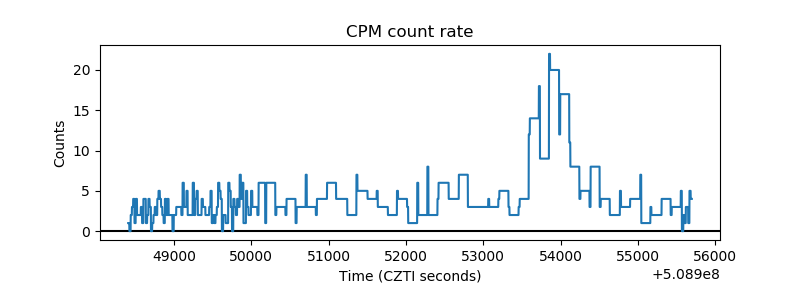 |
| CZT Counter | 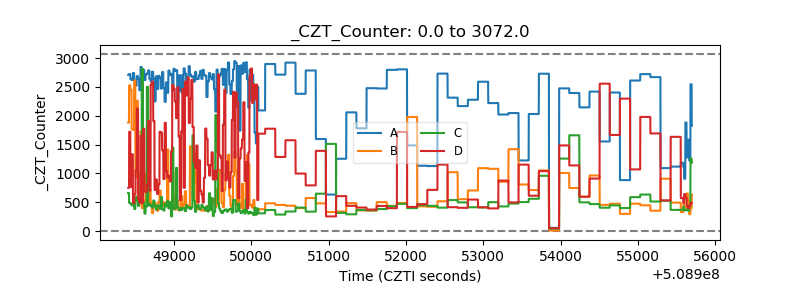 |
| +2.5 Volts monitor |  |
| +5 Volts monitor |  |
| _ROLL_ROT | 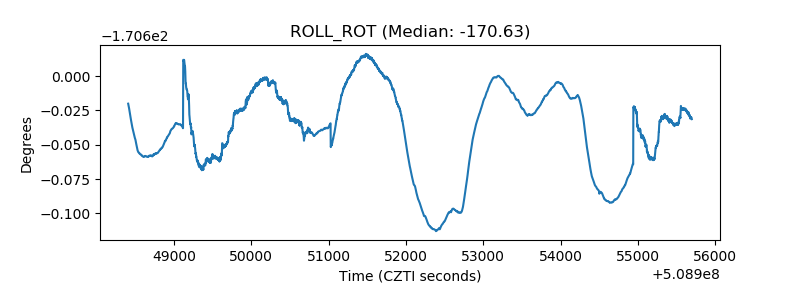 |
| _Roll_DEC | 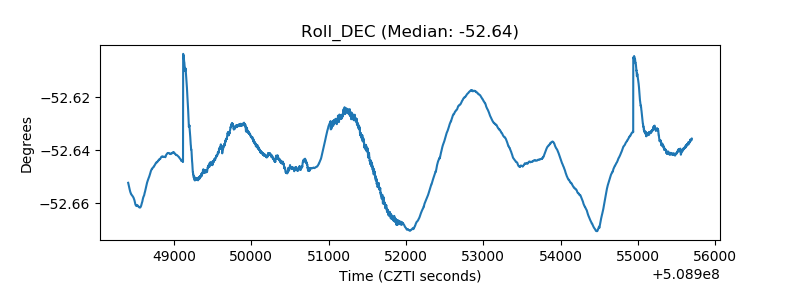 |
| _Roll_RA | 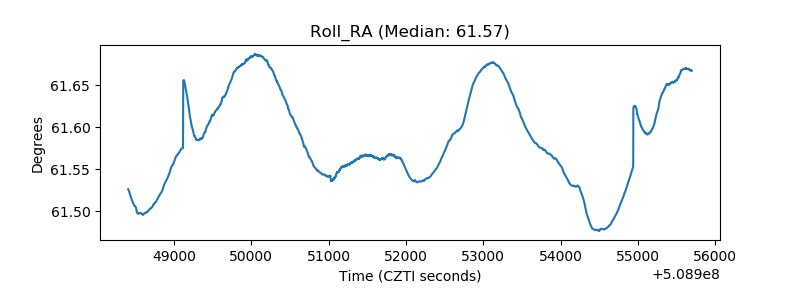 |
| Veto Counter | 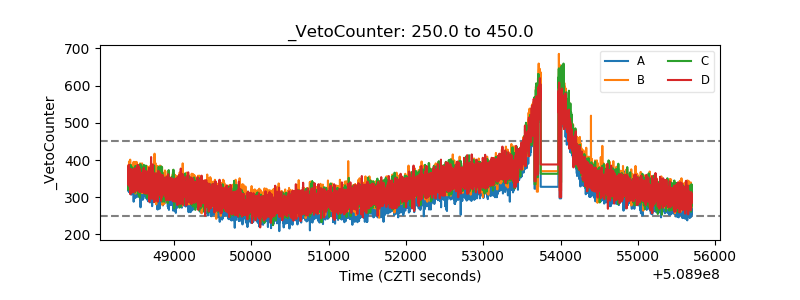 |