| Param | Original file | Final file |
|---|---|---|
| Filename | modeM0/AS1A14_083T04_9000006550_56206cztM0_level2.fits | modeM0/AS1A14_083T04_9000006550_56206cztM0_level2_quad_clean.evt |
| Size (bytes) | 771,667,200 | 90,097,920 |
| Size | 735.9 MB | 85.9 MB |
| Events in quadrant A | 11,526,063 | 464,984 |
| Events in quadrant B | 4,137,444 | 703,248 |
| Events in quadrant C | 5,679,669 | 534,473 |
| Events in quadrant D | 6,675,619 | 533,922 |
| Mode SS | |||
|---|---|---|---|
| Quadrant | BADHDUFLAG | Total packets | Discarded packets |
| A | 0 | 140 | 0 |
| B | 0 | 140 | 0 |
| C | 0 | 140 | 0 |
| D | 0 | 140 | 0 |
| Mode M0 | |||
|---|---|---|---|
| Quadrant | BADHDUFLAG | Total packets | Discarded packets |
| A | 0 | 39164 | 0 |
| B | 0 | 17339 | 0 |
| C | 0 | 22319 | 0 |
| D | 0 | 24763 | 4 |
| Quadrant | Total seconds | Saturated seconds | Saturation percentage |
|---|---|---|---|
| A | 7053 | 2517 | 35.686942% |
| B | 7054 | 213 | 3.019563% |
| C | 7054 | 1132 | 16.047633% |
| D | 7053 | 879 | 12.462782% |
Noise dominated data is calculated using 1-second bins in cleaned event files. If a bin has >2000 counts, and if more than 50% of those come from <1% of pixels, then it is considered to be noise-dominated and hence unusable.
| Quadrant | # 1 sec bins | Bins with >0 counts | Bins with >2000 counts | High rate bins dominated by noise | Noise dominated (total time) | Noise dominated (detector-on time) | Marked lightcurve |
|---|---|---|---|---|---|---|---|
| A | 7053 | 7053 | 2408 | 2408 | 34.14% | 34.14% | 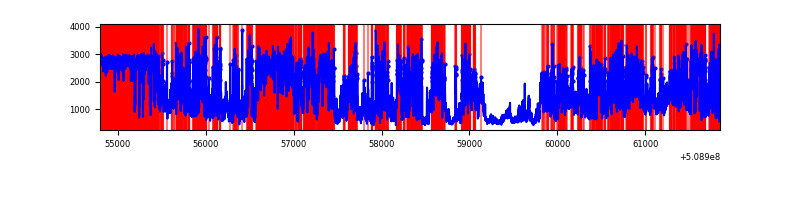 |
| B | 7054 | 7054 | 120 | 120 | 1.70% | 1.70% | 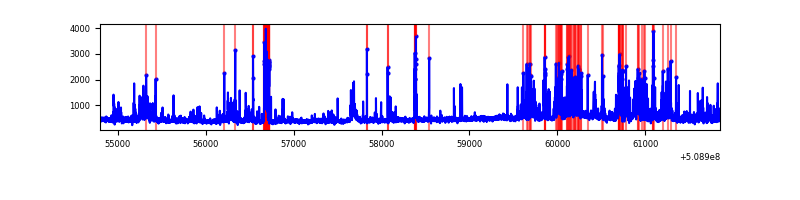 |
| C | 7054 | 7054 | 842 | 842 | 11.94% | 11.94% | 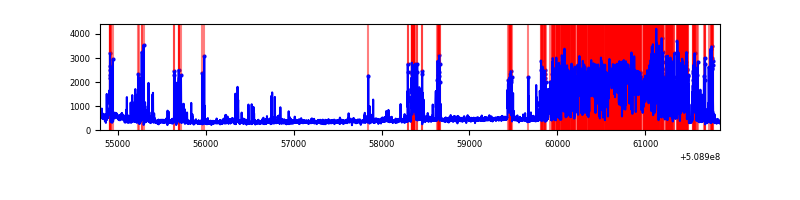 |
| D | 7053 | 7053 | 869 | 869 | 12.32% | 12.32% | 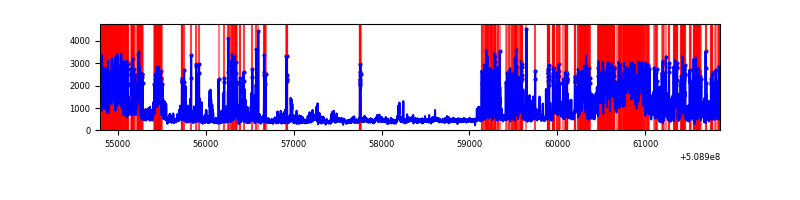 |
Top three noisy pixels from each quadrant. If the there are fewer than three noisy pixels in the level2.evt file, extra rows are filled as -1
| Pixel properties | Quadrant properties | ||||||
|---|---|---|---|---|---|---|---|
| Quadrant | DetID | PixID | Counts | Sigma | Mean | Median | Sigma |
| A | 12 | 115 | 5222868 | 33501.7 | 629 | 613 | 155.9 |
| A | 15 | 32 | 1364925 | 8752.31 | 629 | 613 | 155.9 |
| A | 8 | 176 | 997683 | 6396.38 | 629 | 613 | 155.9 |
| B | 4 | 171 | 382326 | 2454.14 | 731 | 706 | 155.5 |
| B | 5 | 185 | 346825 | 2225.83 | 731 | 706 | 155.5 |
| B | 7 | 252 | 147337 | 942.96 | 731 | 706 | 155.5 |
| C | 12 | 254 | 2623172 | 14605.56 | 649 | 644 | 179.6 |
| C | 12 | 252 | 194860 | 1081.64 | 649 | 644 | 179.6 |
| C | 9 | 237 | 110331 | 610.88 | 649 | 644 | 179.6 |
| D | 3 | 12 | 758658 | 3907.42 | 676 | 643 | 194.0 |
| D | 11 | 129 | 705343 | 3632.59 | 676 | 643 | 194.0 |
| D | 2 | 249 | 587187 | 3023.52 | 676 | 643 | 194.0 |
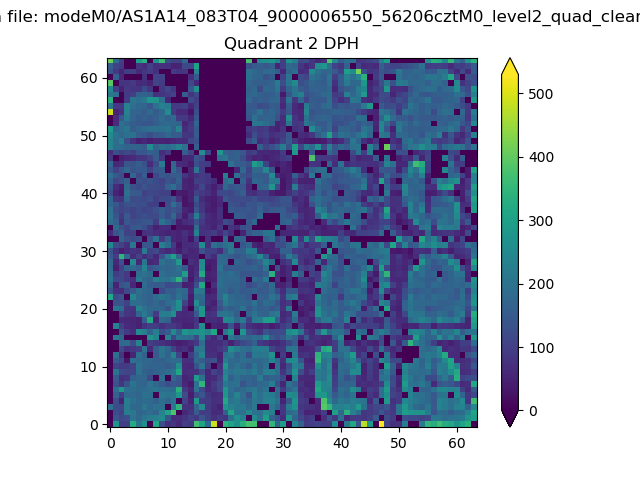
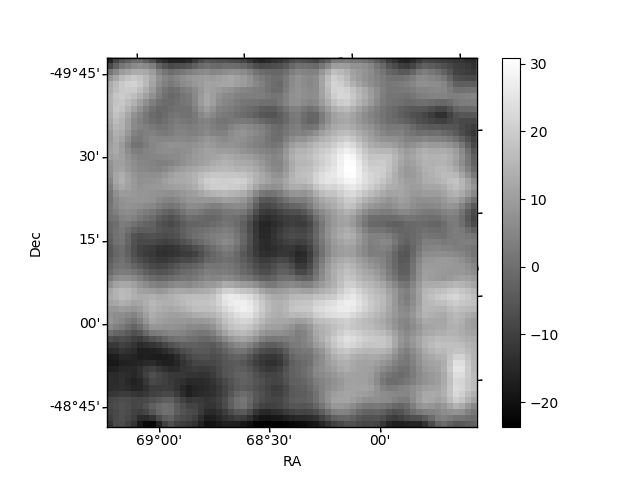
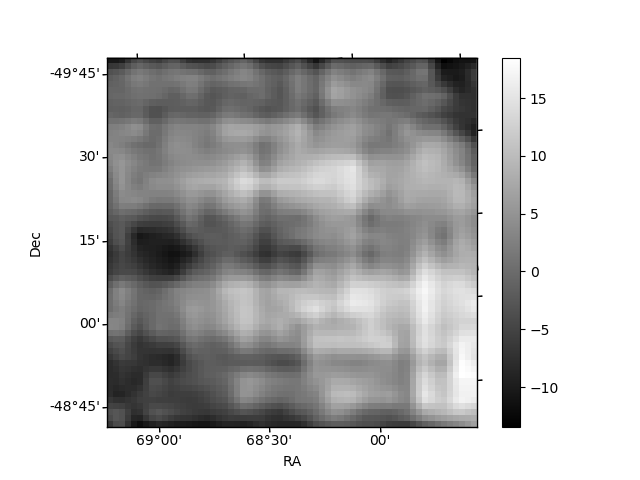
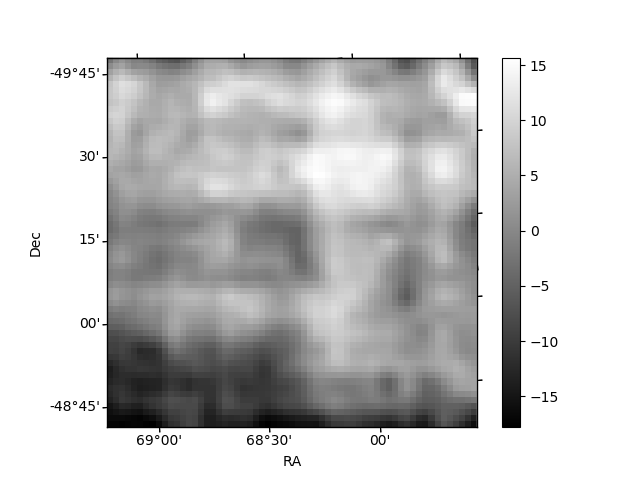
Histogram calculated using DETX and DETY for each event in the final _common_clean file
| Quadrant A | 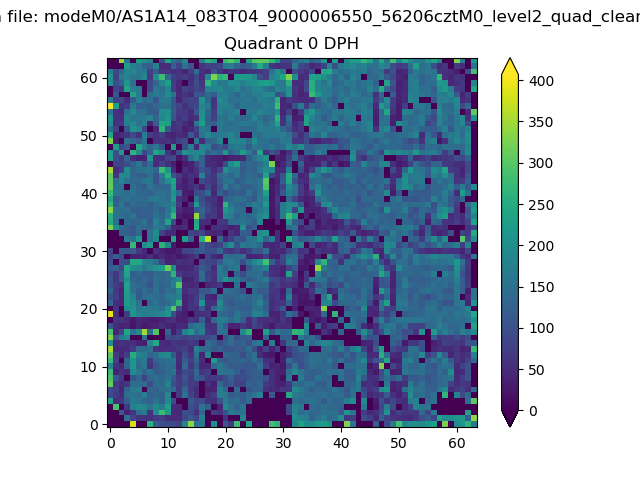 |
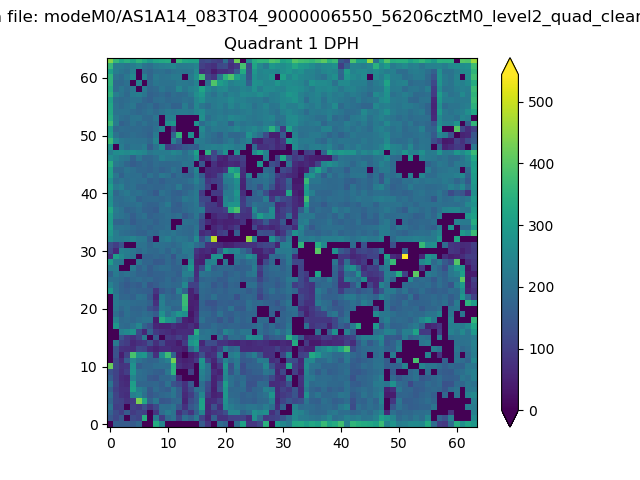 |
Quadrant B |
|---|---|---|---|
| Quadrant D | 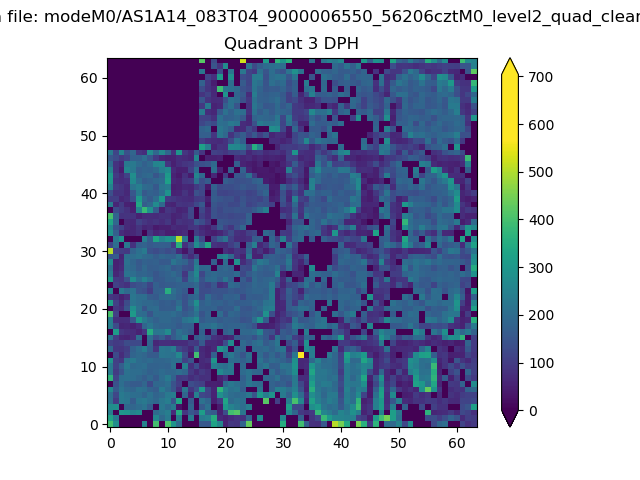 |
 |
Quadrant C |
| Plot type | Count rate plots | Images |
|---|---|---|
| Comparison with Poisson distribution Blue bars denote a histogram of data divided into 1 sec bins. Red curve is a Poisson curve with rate = median count rate of data. |
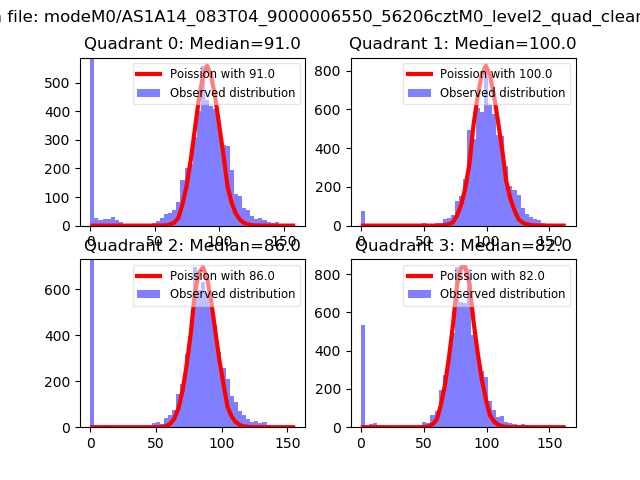 |
 |
| Quadrant-wise count rates Data is divided into 100 sec bins |
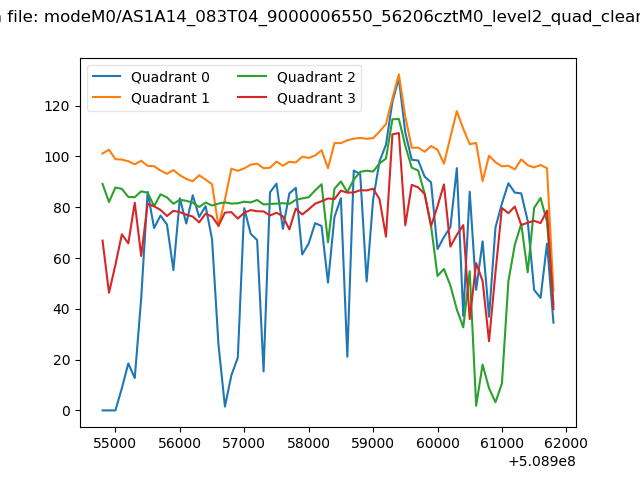 |
|
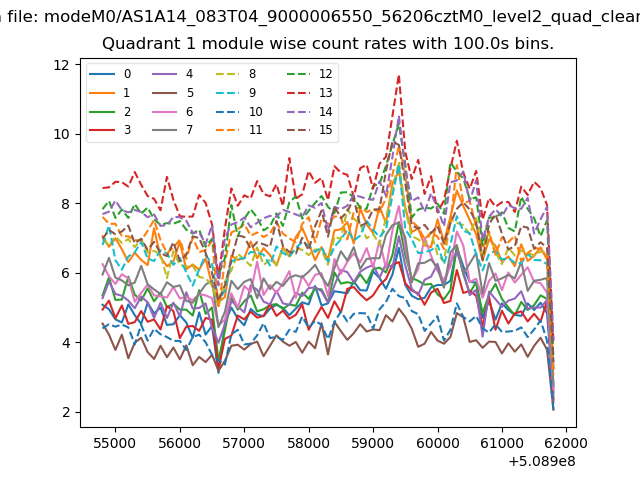
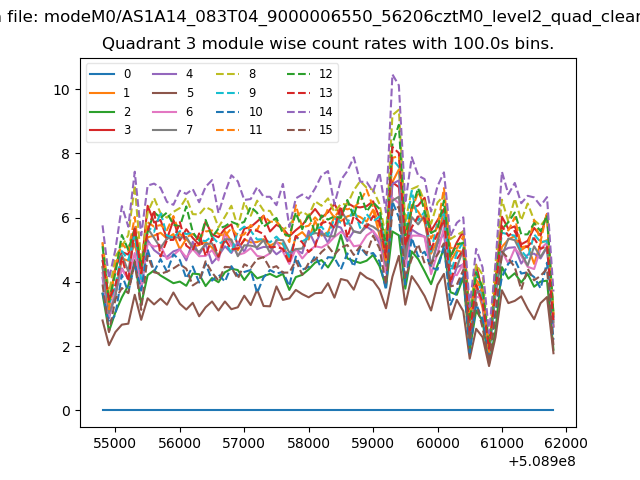
| Module-wise count rates for Quadrant A Data is divided into 100 sec bins |
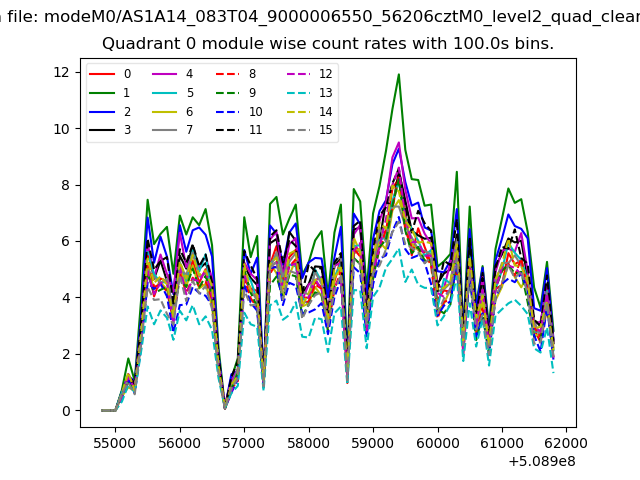 |
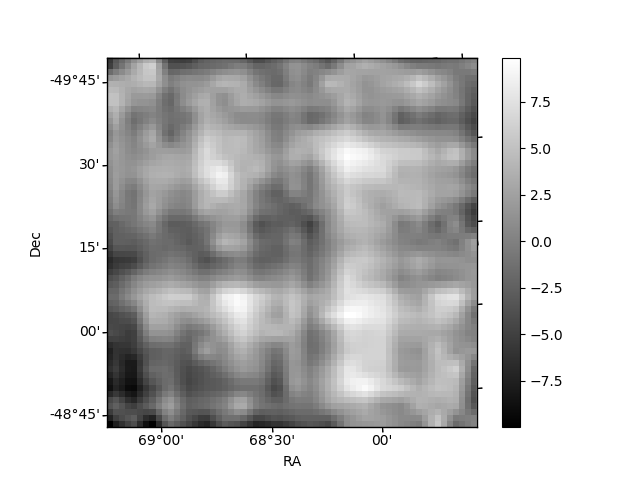 |
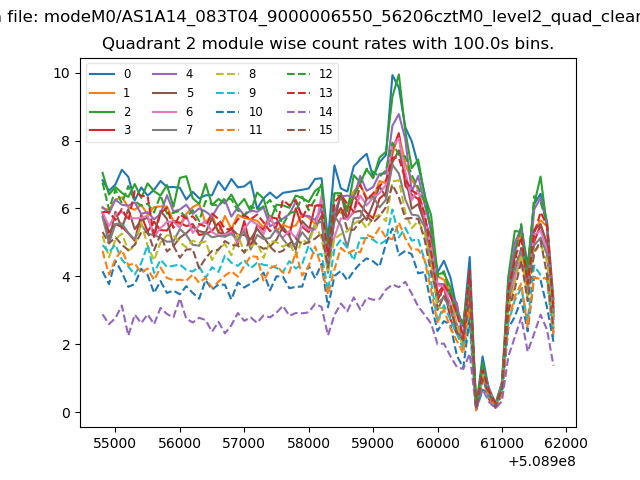
| Module-wise count rates for Quadrant B Data is divided into 100 sec bins |
 |
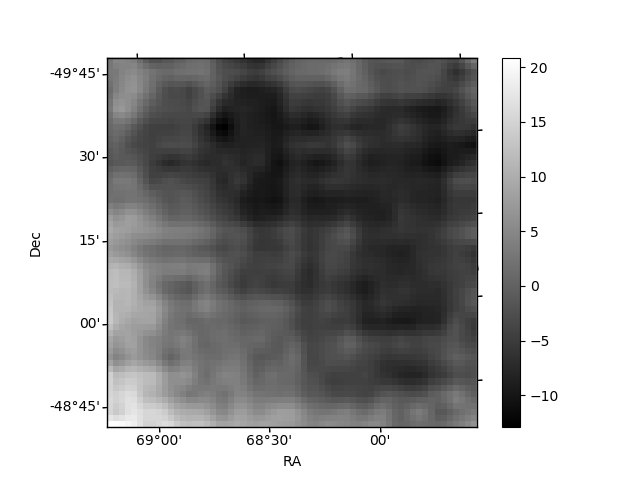 |
| Module-wise count rates for Quadrant C Data is divided into 100 sec bins |
 |
 |
| Module-wise count rates for Quadrant D Data is divided into 100 sec bins |
 |
 |
| Parameter | Plot |
|---|---|
| CZT HV Monitor | 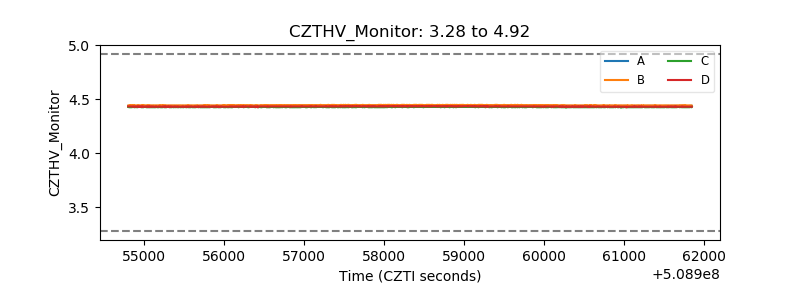 |
| D_VDD | 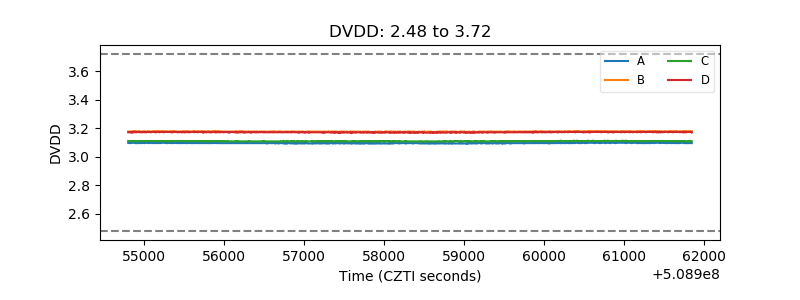 |
| Temperature 1 | 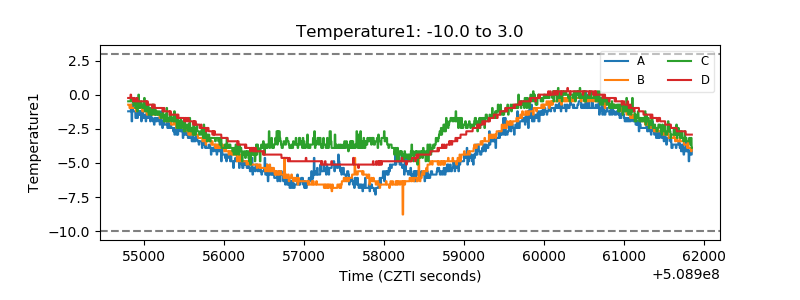 |
| Veto HV Monitor | 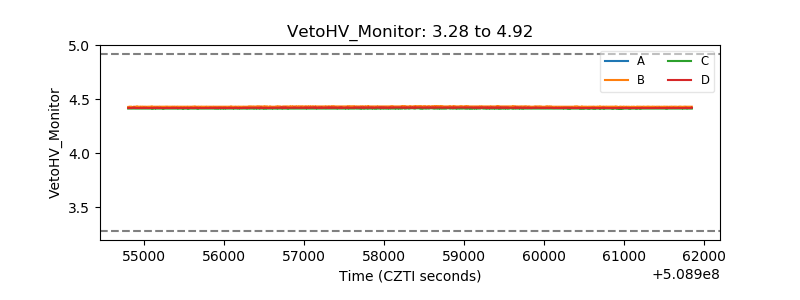 |
| Veto LLD | 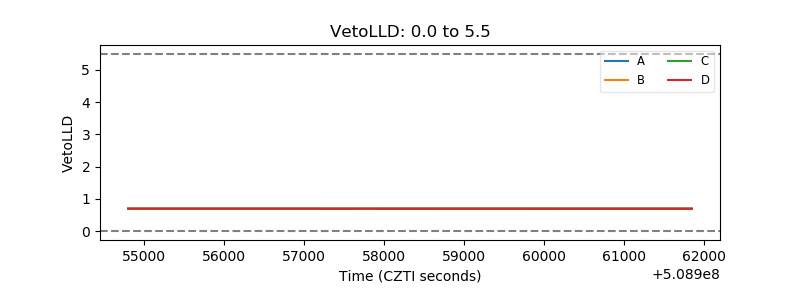 |
| Alpha Counter | 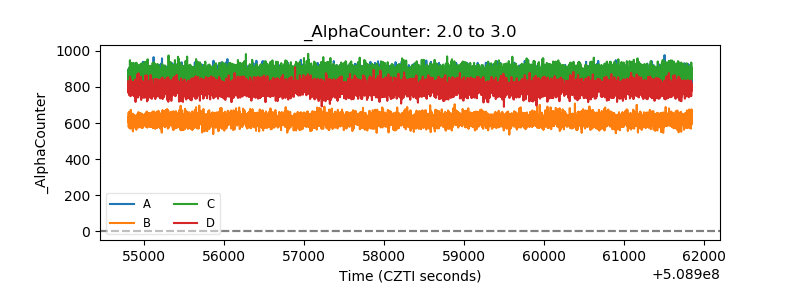 |
| _CPM_Rate | 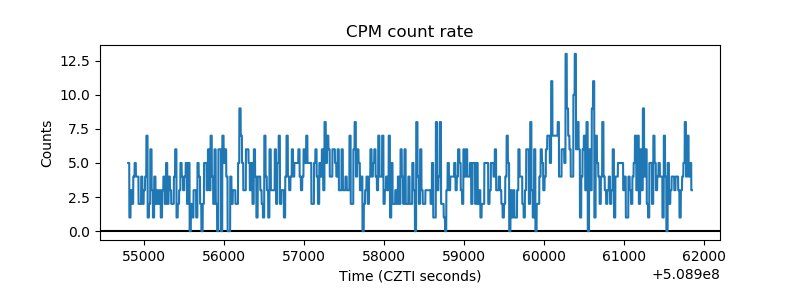 |
| CZT Counter | 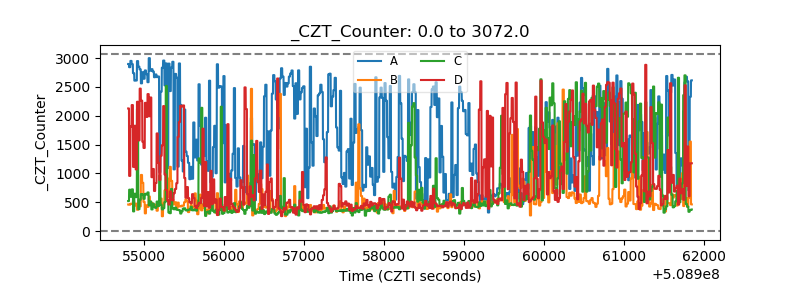 |
| +2.5 Volts monitor | 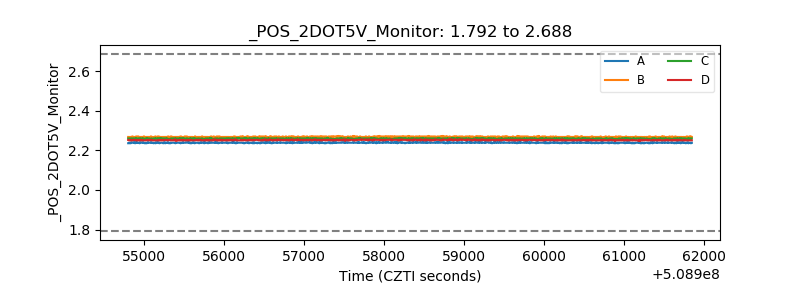 |
| +5 Volts monitor | 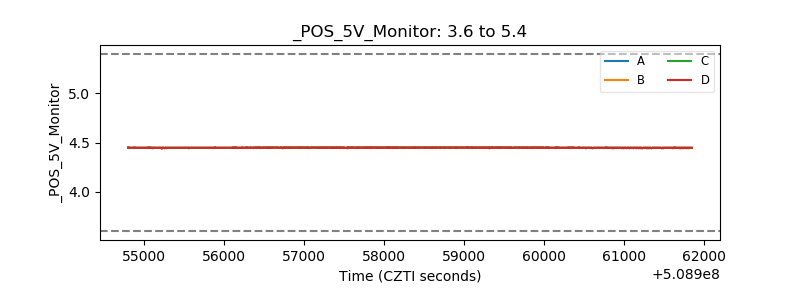 |
| _ROLL_ROT | 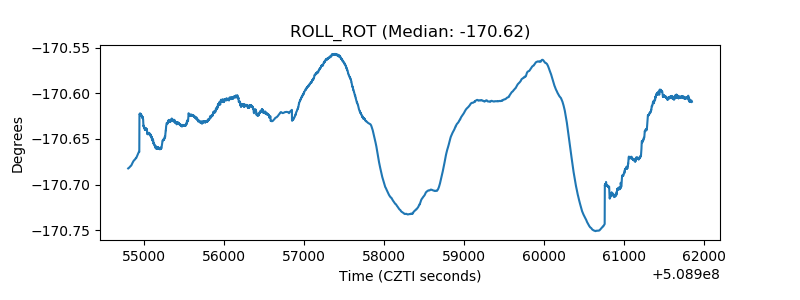 |
| _Roll_DEC | 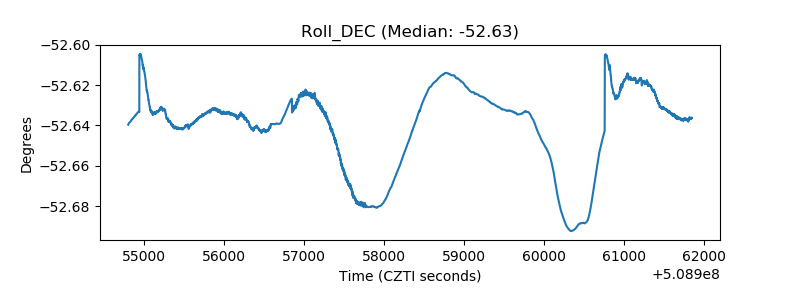 |
| _Roll_RA | 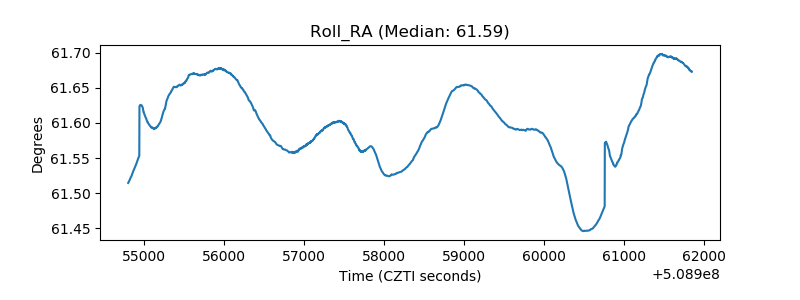 |
| Veto Counter | 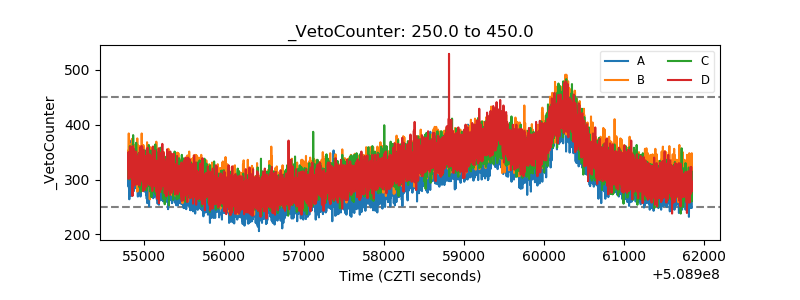 |