| Param | Original file | Final file |
|---|---|---|
| Filename | modeM0/AS1A14_083T04_9000006550_56207cztM0_level2.fits | modeM0/AS1A14_083T04_9000006550_56207cztM0_level2_quad_clean.evt |
| Size (bytes) | 791,161,920 | 91,710,720 |
| Size | 754.5 MB | 87.5 MB |
| Events in quadrant A | 10,715,766 | 529,231 |
| Events in quadrant B | 5,276,235 | 666,309 |
| Events in quadrant C | 5,273,069 | 562,789 |
| Events in quadrant D | 7,432,341 | 488,206 |
| Mode SS | |||
|---|---|---|---|
| Quadrant | BADHDUFLAG | Total packets | Discarded packets |
| A | 0 | 152 | 0 |
| B | 0 | 152 | 0 |
| C | 0 | 152 | 0 |
| D | 0 | 152 | 0 |
| Mode M0 | |||
|---|---|---|---|
| Quadrant | BADHDUFLAG | Total packets | Discarded packets |
| A | 0 | 37137 | 1 |
| B | 0 | 21040 | 0 |
| C | 0 | 21351 | 0 |
| D | 0 | 27553 | 0 |
| Quadrant | Total seconds | Saturated seconds | Saturation percentage |
|---|---|---|---|
| A | 7612 | 1917 | 25.183920% |
| B | 7613 | 372 | 4.886379% |
| C | 7613 | 731 | 9.601997% |
| D | 7613 | 1115 | 14.646000% |
Noise dominated data is calculated using 1-second bins in cleaned event files. If a bin has >2000 counts, and if more than 50% of those come from <1% of pixels, then it is considered to be noise-dominated and hence unusable.
| Quadrant | # 1 sec bins | Bins with >0 counts | Bins with >2000 counts | High rate bins dominated by noise | Noise dominated (total time) | Noise dominated (detector-on time) | Marked lightcurve |
|---|---|---|---|---|---|---|---|
| A | 7893 | 7887 | 1778 | 1778 | 22.53% | 22.54% | 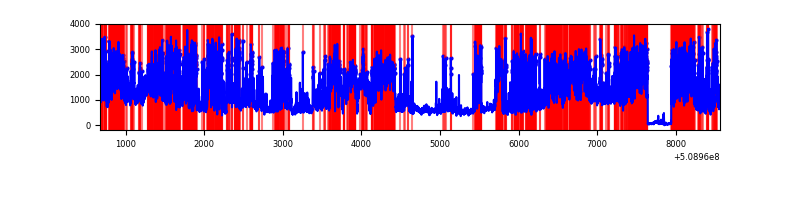 |
| B | 7894 | 7894 | 223 | 223 | 2.82% | 2.82% | 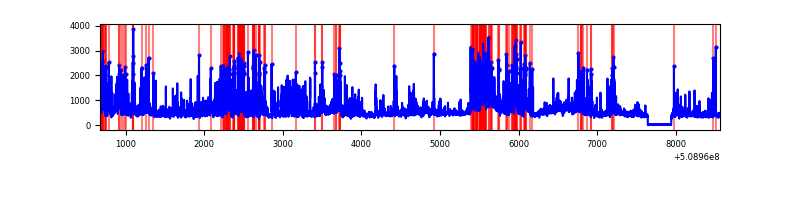 |
| C | 7893 | 7893 | 548 | 548 | 6.94% | 6.94% | 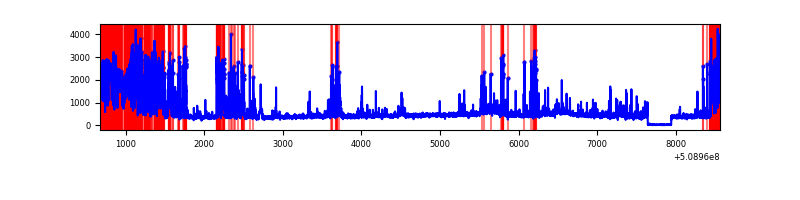 |
| D | 7894 | 7818 | 1107 | 1107 | 14.02% | 14.16% | 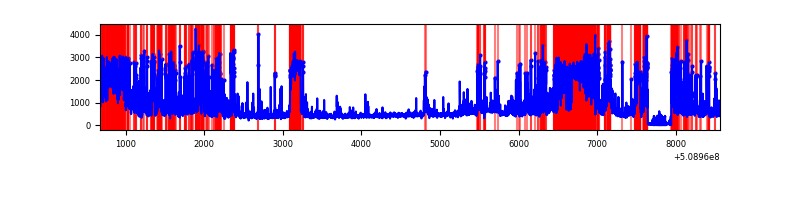 |
Top three noisy pixels from each quadrant. If the there are fewer than three noisy pixels in the level2.evt file, extra rows are filled as -1
| Pixel properties | Quadrant properties | ||||||
|---|---|---|---|---|---|---|---|
| Quadrant | DetID | PixID | Counts | Sigma | Mean | Median | Sigma |
| A | 7 | 64 | 2301283 | 12700.23 | 726 | 709 | 181.1 |
| A | 8 | 176 | 1709749 | 9434.69 | 726 | 709 | 181.1 |
| A | 15 | 32 | 1376382 | 7594.35 | 726 | 709 | 181.1 |
| B | 4 | 171 | 869528 | 5115.52 | 785 | 756 | 169.8 |
| B | 5 | 185 | 568154 | 3340.96 | 785 | 756 | 169.8 |
| B | 0 | 171 | 235988 | 1385.1 | 785 | 756 | 169.8 |
| C | 12 | 254 | 1759788 | 8740.83 | 730 | 724 | 201.2 |
| C | 12 | 252 | 275029 | 1363.03 | 730 | 724 | 201.2 |
| C | 9 | 237 | 109228 | 539.16 | 730 | 724 | 201.2 |
| D | 11 | 129 | 1074799 | 5210.15 | 718 | 688 | 206.2 |
| D | 2 | 249 | 835414 | 4048.97 | 718 | 688 | 206.2 |
| D | 8 | 129 | 681897 | 3304.31 | 718 | 688 | 206.2 |
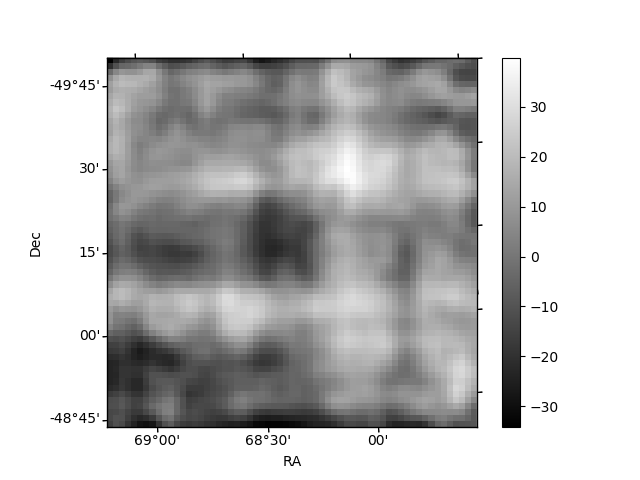
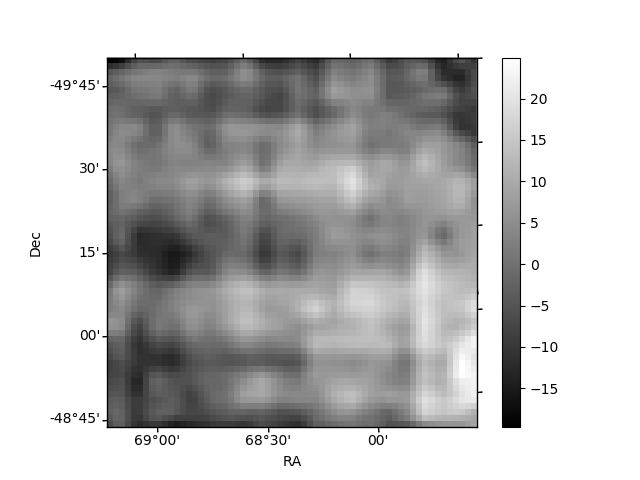
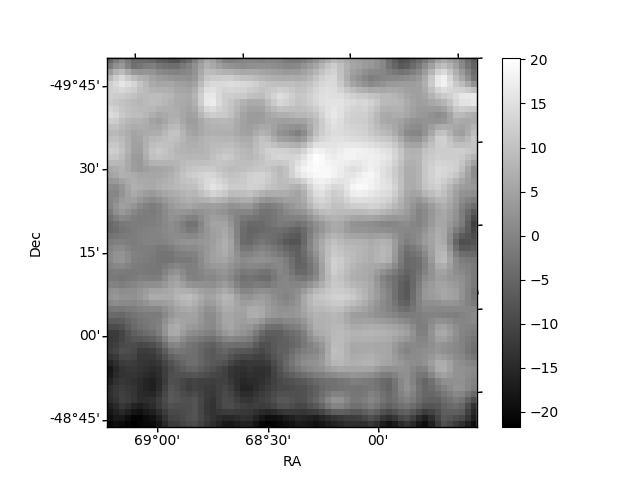
Histogram calculated using DETX and DETY for each event in the final _common_clean file
| Quadrant A | 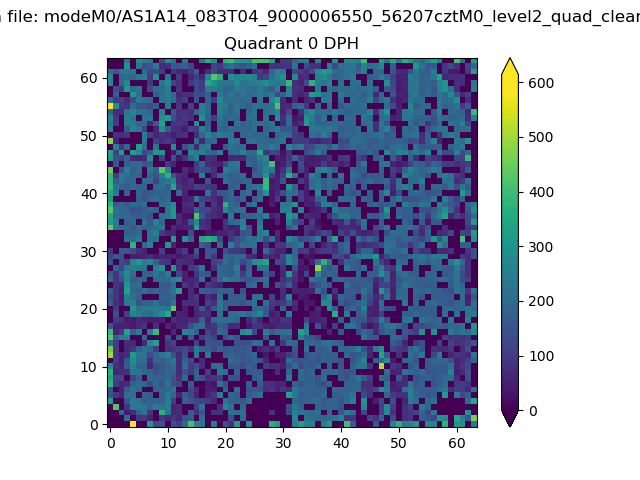 |
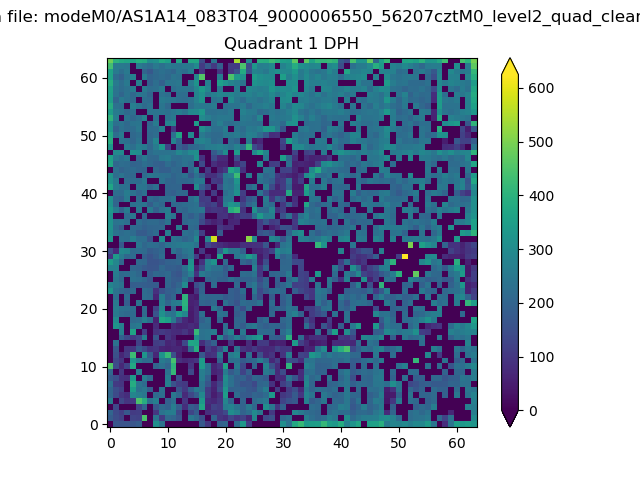 |
Quadrant B |
|---|---|---|---|
| Quadrant D | 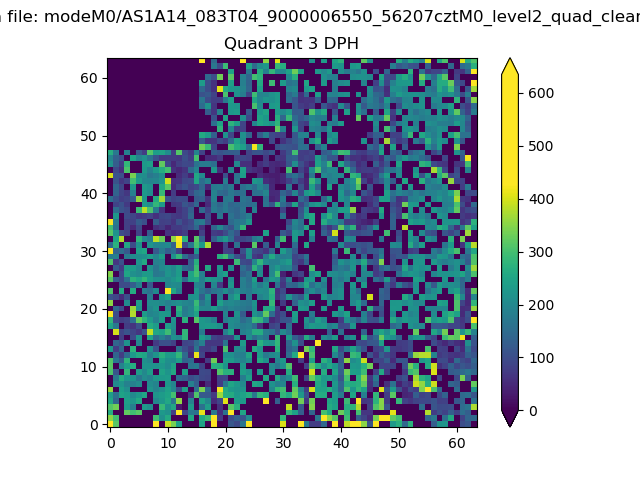 |
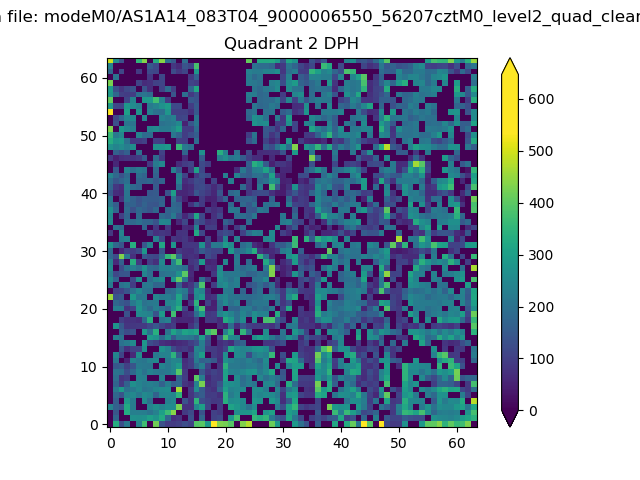 |
Quadrant C |
| Plot type | Count rate plots | Images |
|---|---|---|
| Comparison with Poisson distribution Blue bars denote a histogram of data divided into 1 sec bins. Red curve is a Poisson curve with rate = median count rate of data. |
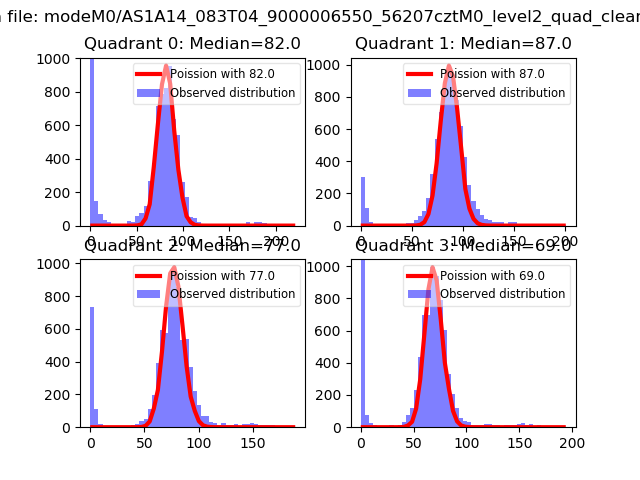 |
 |
| Quadrant-wise count rates Data is divided into 100 sec bins |
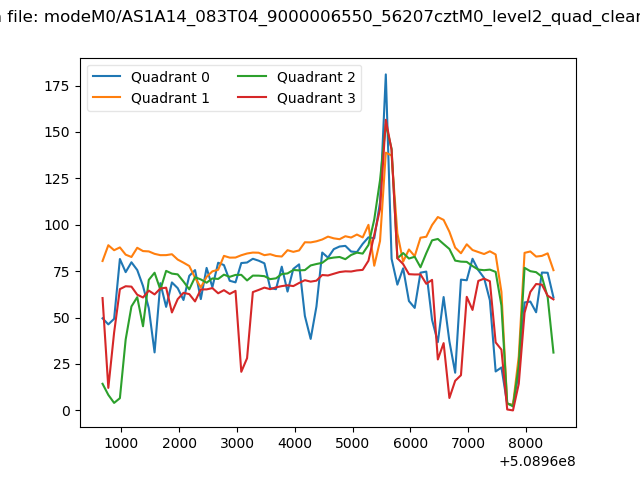 |
|
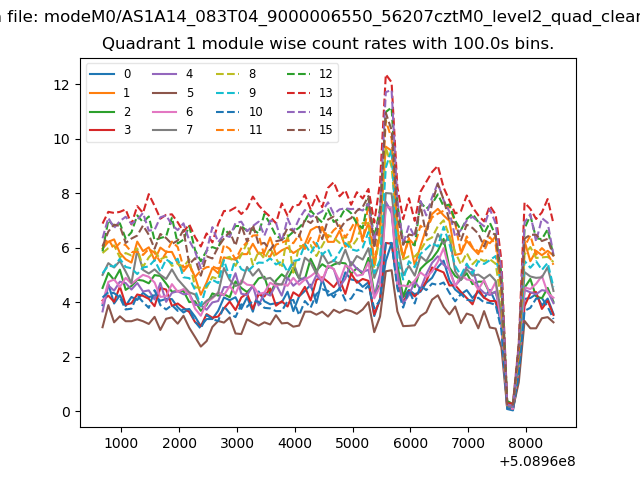
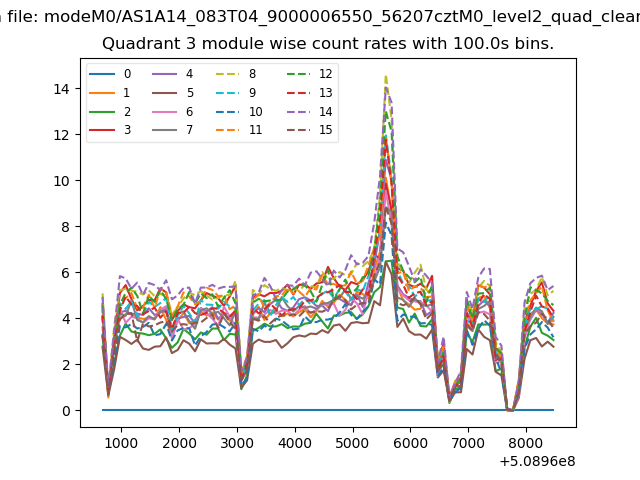
| Module-wise count rates for Quadrant A Data is divided into 100 sec bins |
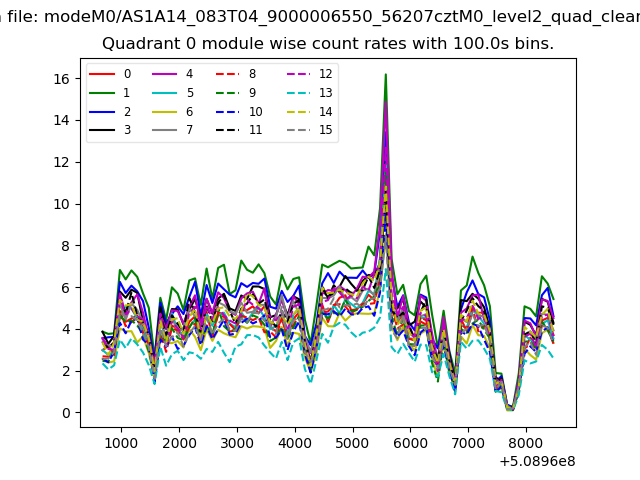 |
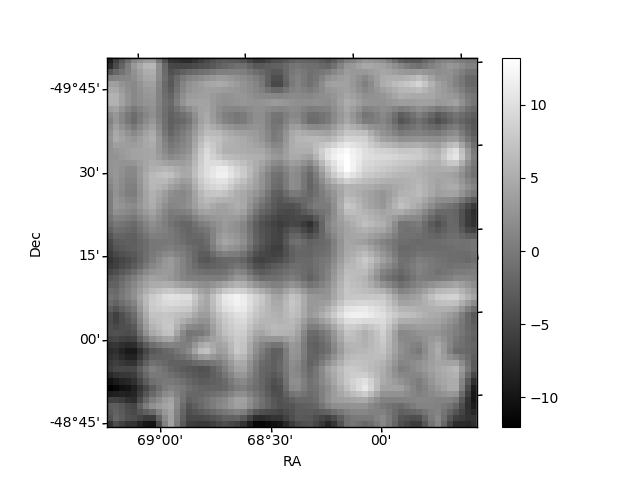 |
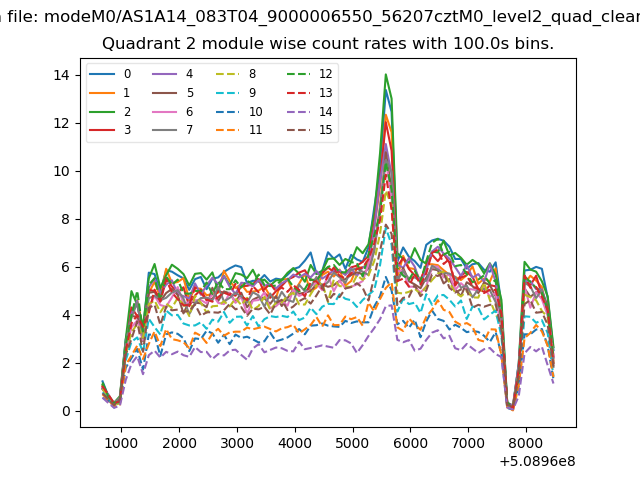
| Module-wise count rates for Quadrant B Data is divided into 100 sec bins |
 |
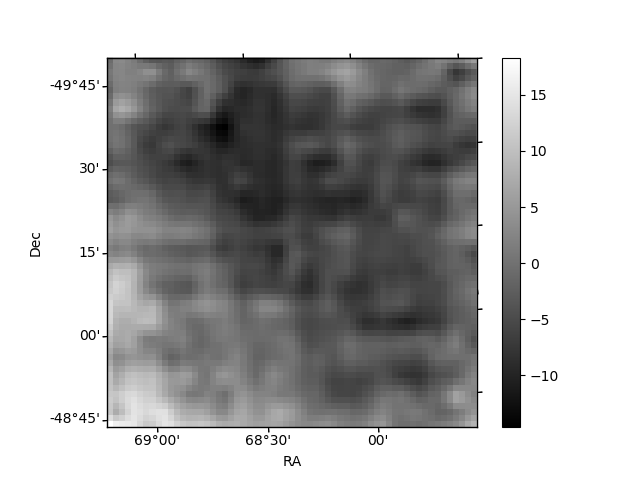 |
| Module-wise count rates for Quadrant C Data is divided into 100 sec bins |
 |
 |
| Module-wise count rates for Quadrant D Data is divided into 100 sec bins |
 |
 |
| Parameter | Plot |
|---|---|
| CZT HV Monitor |  |
| D_VDD | 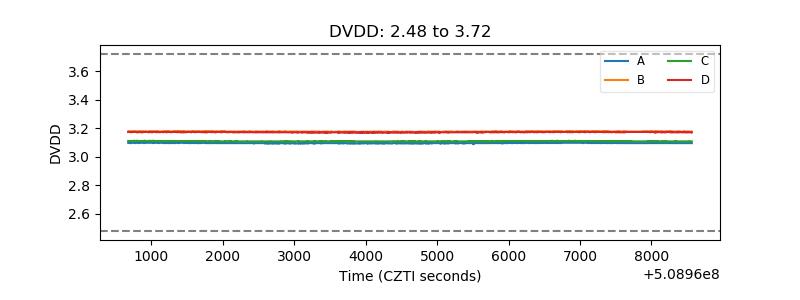 |
| Temperature 1 | 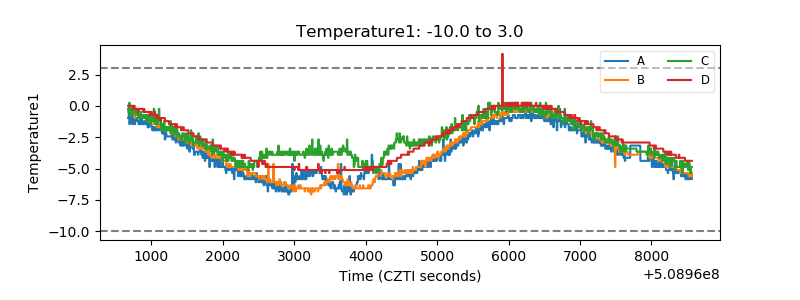 |
| Veto HV Monitor | 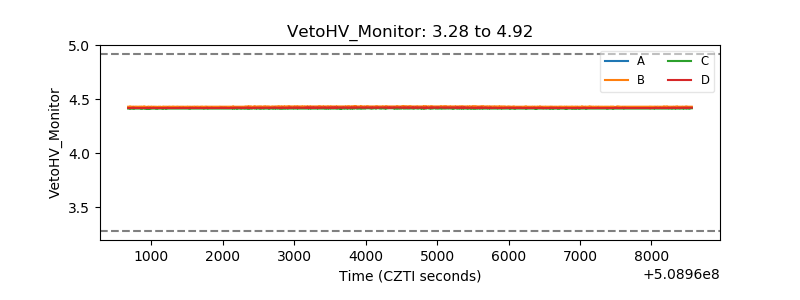 |
| Veto LLD | 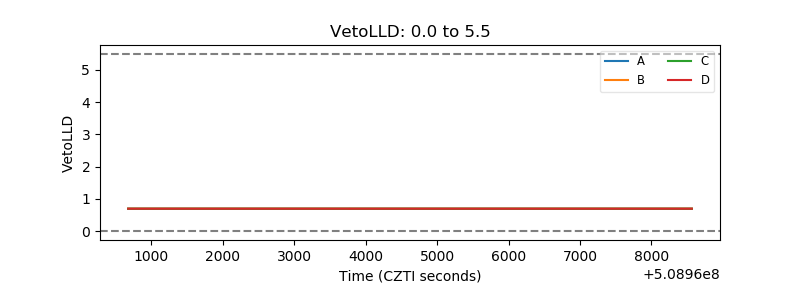 |
| Alpha Counter | 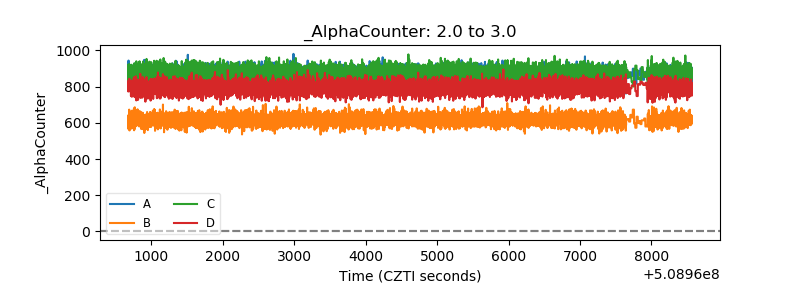 |
| _CPM_Rate | 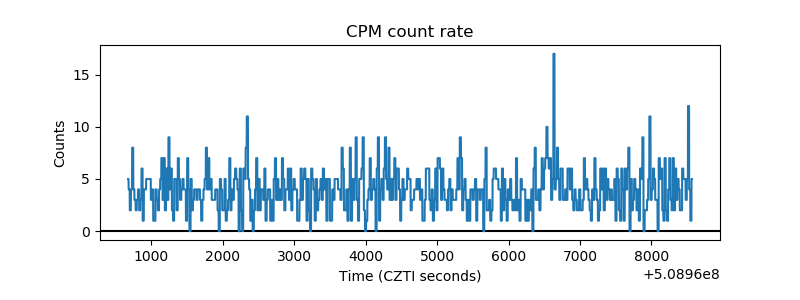 |
| CZT Counter | 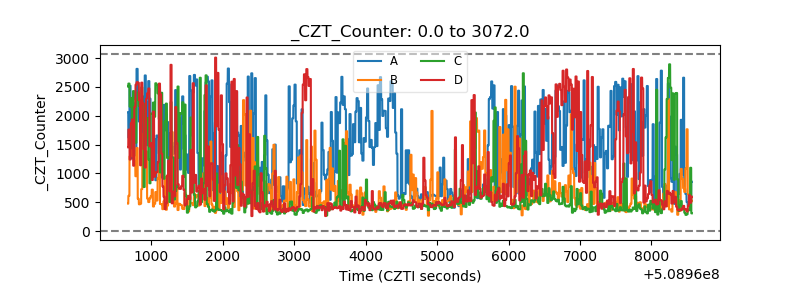 |
| +2.5 Volts monitor |  |
| +5 Volts monitor |  |
| _ROLL_ROT | 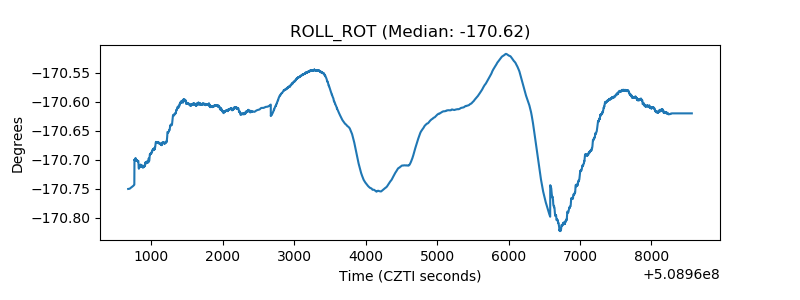 |
| _Roll_DEC | 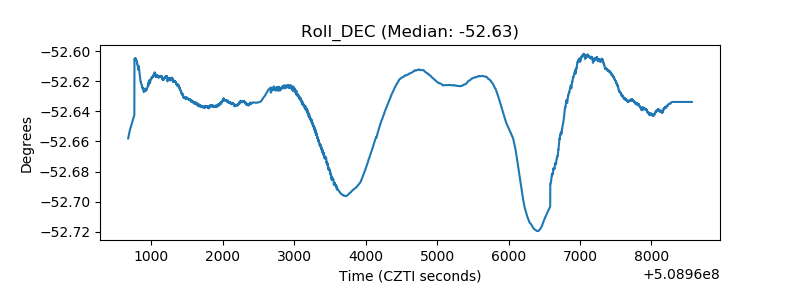 |
| _Roll_RA | 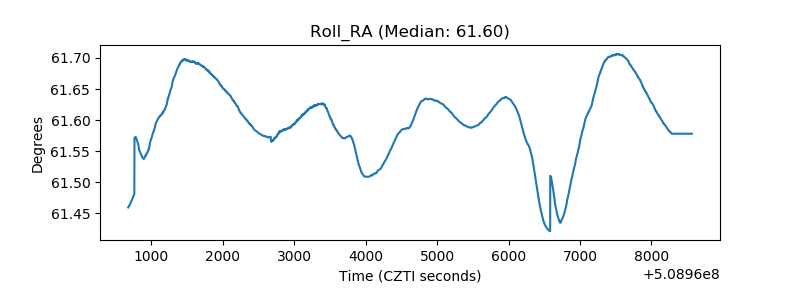 |
| Veto Counter | 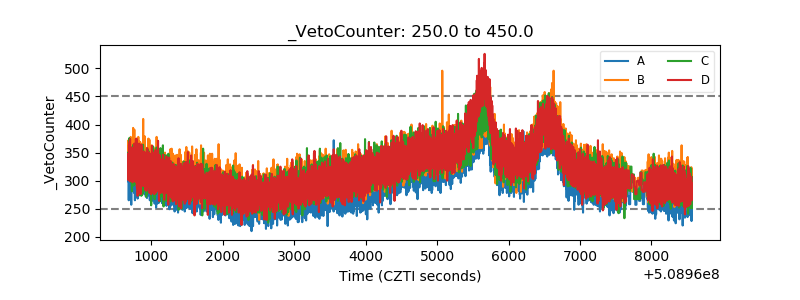 |