| Param | Original file | Final file |
|---|---|---|
| Filename | modeM0/AS1A14_083T04_9000006550_56211cztM0_level2.fits | modeM0/AS1A14_083T04_9000006550_56211cztM0_level2_quad_clean.evt |
| Size (bytes) | 696,372,480 | 71,196,480 |
| Size | 664.1 MB | 67.9 MB |
| Events in quadrant A | 13,587,631 | 211,343 |
| Events in quadrant B | 3,387,060 | 547,513 |
| Events in quadrant C | 4,369,243 | 479,241 |
| Events in quadrant D | 3,923,299 | 459,455 |
| Mode SS | |||
|---|---|---|---|
| Quadrant | BADHDUFLAG | Total packets | Discarded packets |
| A | 0 | 132 | 0 |
| B | 0 | 132 | 0 |
| C | 0 | 132 | 0 |
| D | 0 | 132 | 0 |
| Mode M9 | |||
|---|---|---|---|
| Quadrant | BADHDUFLAG | Total packets | Discarded packets |
| A | 0 | 8 | 0 |
| B | 0 | 8 | 0 |
| C | 0 | 8 | 0 |
| D | 0 | 8 | 0 |
| Mode M0 | |||
|---|---|---|---|
| Quadrant | BADHDUFLAG | Total packets | Discarded packets |
| A | 0 | 44843 | 1 |
| B | 0 | 14571 | 1 |
| C | 0 | 17911 | 1 |
| D | 0 | 16574 | 1 |
| Quadrant | Total seconds | Saturated seconds | Saturation percentage |
|---|---|---|---|
| A | 6569 | 4147 | 63.129852% |
| B | 6569 | 138 | 2.100776% |
| C | 6569 | 549 | 8.357436% |
| D | 6569 | 250 | 3.805754% |
Noise dominated data is calculated using 1-second bins in cleaned event files. If a bin has >2000 counts, and if more than 50% of those come from <1% of pixels, then it is considered to be noise-dominated and hence unusable.
| Quadrant | # 1 sec bins | Bins with >0 counts | Bins with >2000 counts | High rate bins dominated by noise | Noise dominated (total time) | Noise dominated (detector-on time) | Marked lightcurve |
|---|---|---|---|---|---|---|---|
| A | 7628 | 6692 | 4005 | 4005 | 52.50% | 59.85% | 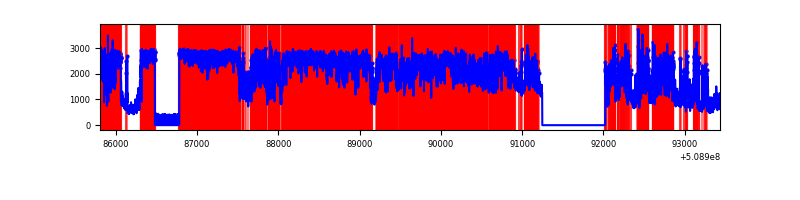 |
| B | 7628 | 6853 | 29 | 29 | 0.38% | 0.42% | 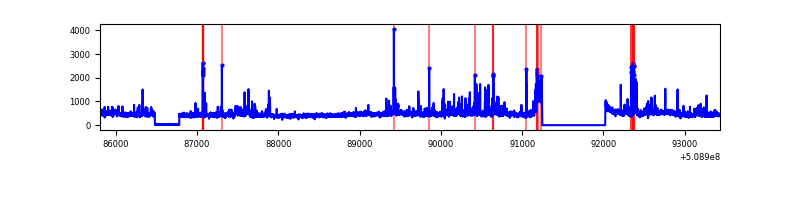 |
| C | 7628 | 6853 | 458 | 458 | 6.00% | 6.68% | 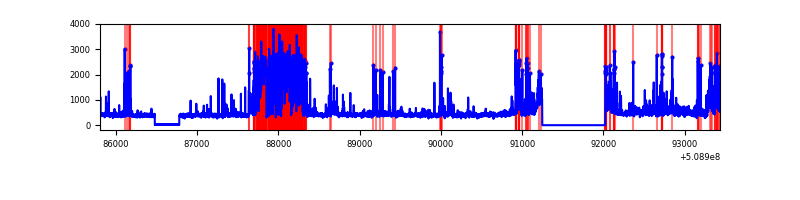 |
| D | 7628 | 6853 | 192 | 192 | 2.52% | 2.80% | 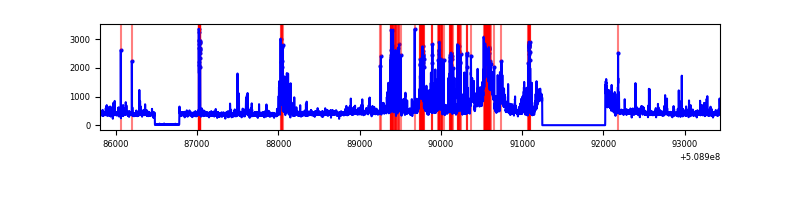 |
Top three noisy pixels from each quadrant. If the there are fewer than three noisy pixels in the level2.evt file, extra rows are filled as -1
| Pixel properties | Quadrant properties | ||||||
|---|---|---|---|---|---|---|---|
| Quadrant | DetID | PixID | Counts | Sigma | Mean | Median | Sigma |
| A | 12 | 115 | 7221363 | 54644.42 | 526 | 514 | 132.1 |
| A | 8 | 176 | 1713019 | 12959.53 | 526 | 514 | 132.1 |
| A | 7 | 64 | 958226 | 7247.57 | 526 | 514 | 132.1 |
| B | 0 | 171 | 187870 | 1292.0 | 682 | 657 | 144.9 |
| B | 0 | 63 | 135457 | 930.29 | 682 | 657 | 144.9 |
| B | 4 | 156 | 105126 | 720.97 | 682 | 657 | 144.9 |
| C | 12 | 254 | 1599172 | 8951.59 | 651 | 646 | 178.6 |
| C | 12 | 252 | 95422 | 530.74 | 651 | 646 | 178.6 |
| C | 9 | 237 | 59334 | 328.65 | 651 | 646 | 178.6 |
| D | 4 | 230 | 346979 | 1839.34 | 663 | 633 | 188.3 |
| D | 6 | 239 | 241973 | 1281.68 | 663 | 633 | 188.3 |
| D | 8 | 129 | 223075 | 1181.32 | 663 | 633 | 188.3 |
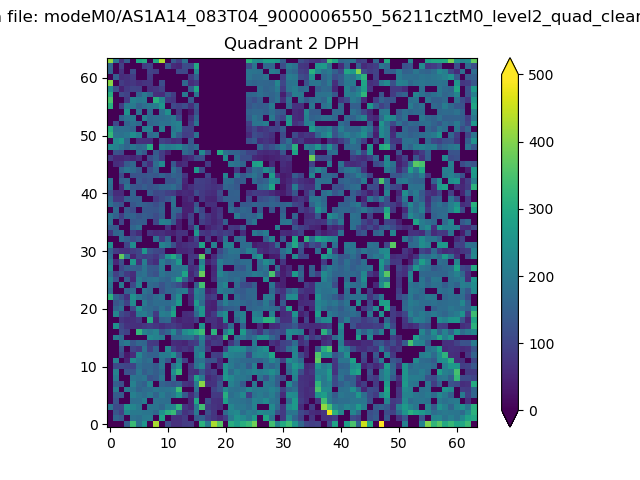
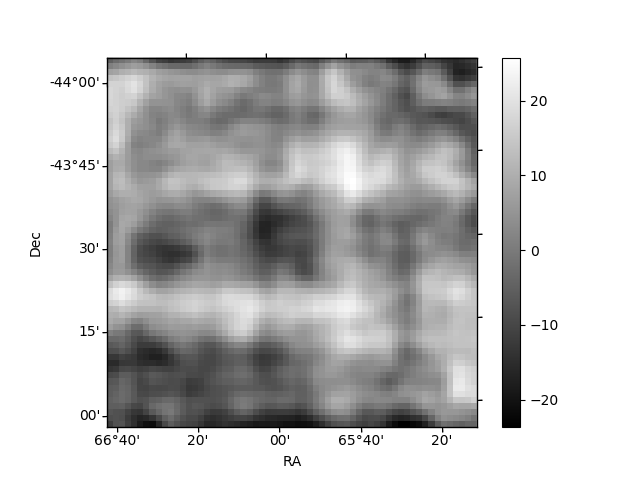
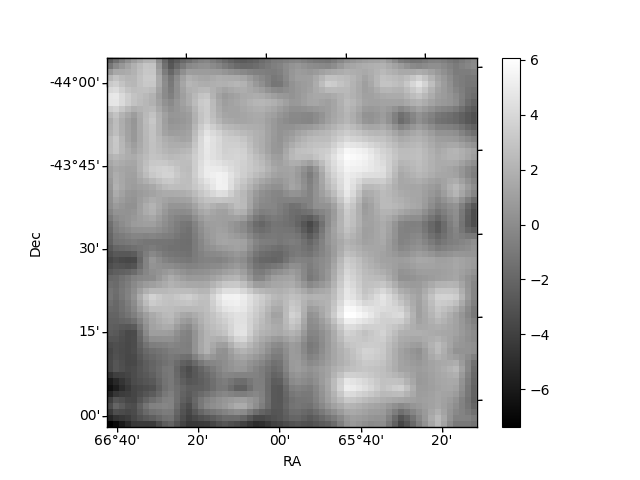
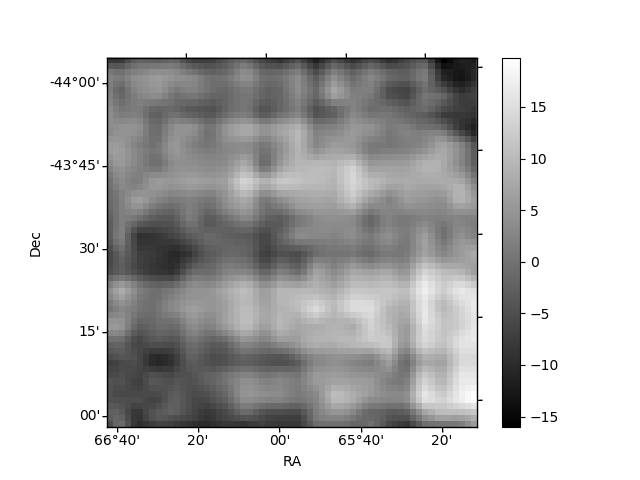
Histogram calculated using DETX and DETY for each event in the final _common_clean file
| Quadrant A | 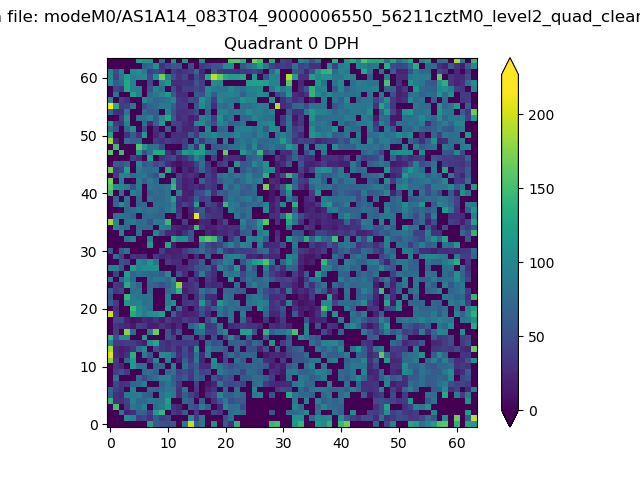 |
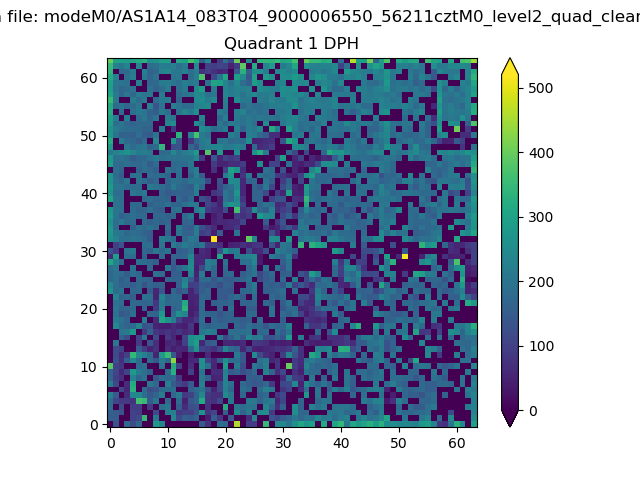 |
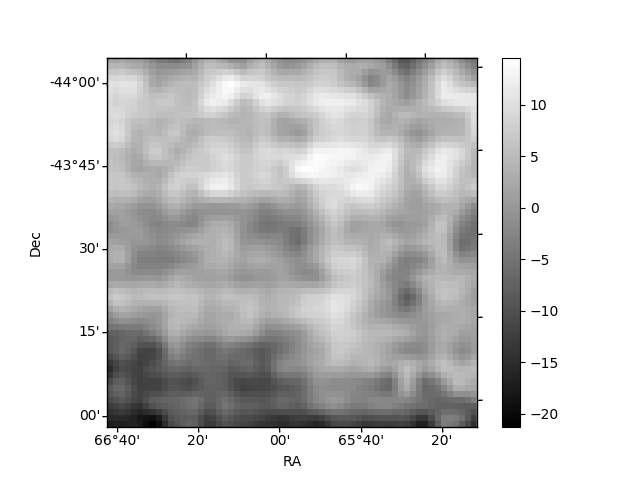
Quadrant B |
|---|---|---|---|
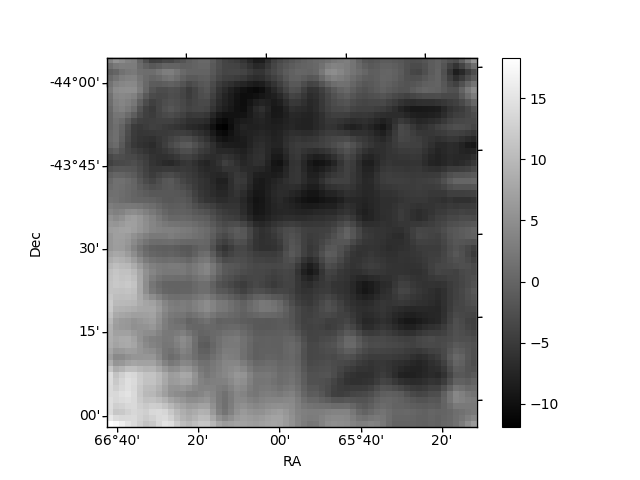
| Quadrant D | 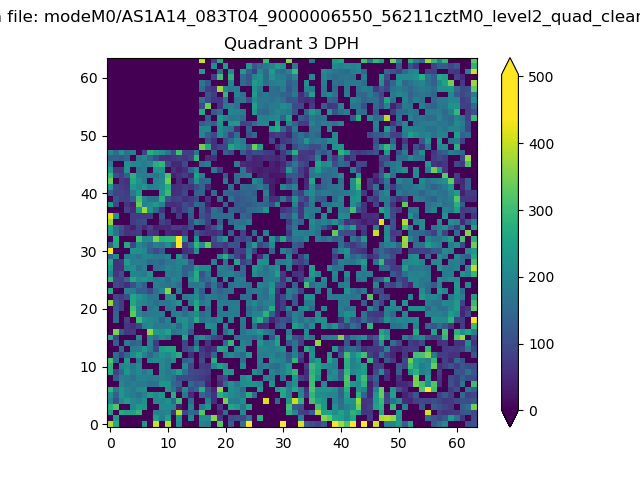 |
 |
Quadrant C |
| Plot type | Count rate plots | Images |
|---|---|---|
| Comparison with Poisson distribution Blue bars denote a histogram of data divided into 1 sec bins. Red curve is a Poisson curve with rate = median count rate of data. |
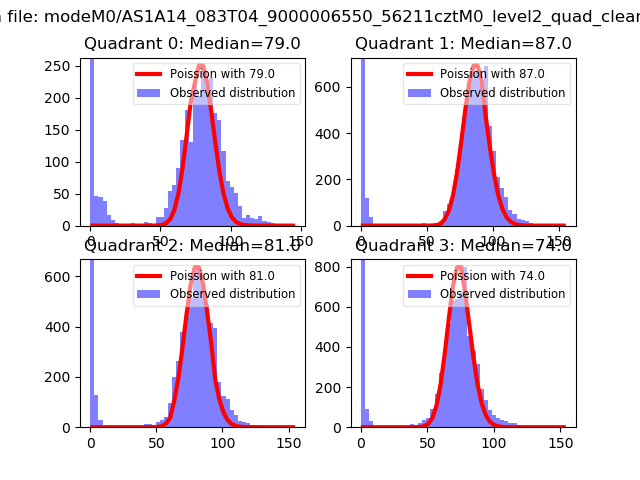 |
 |
| Quadrant-wise count rates Data is divided into 100 sec bins |
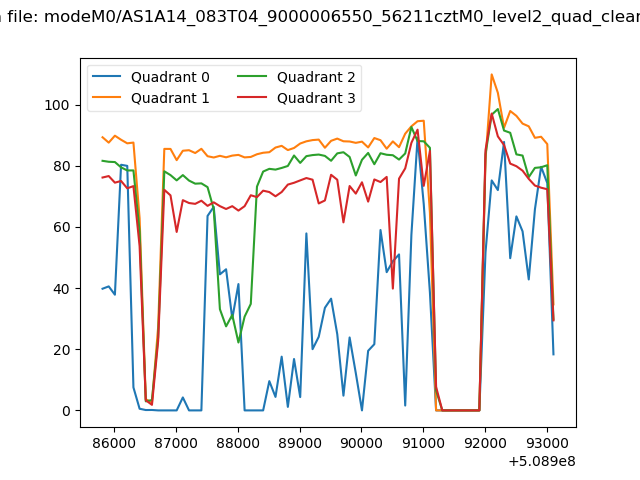 |
|
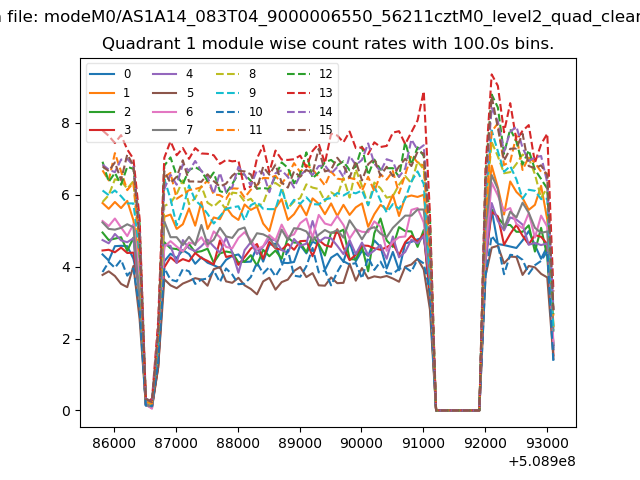
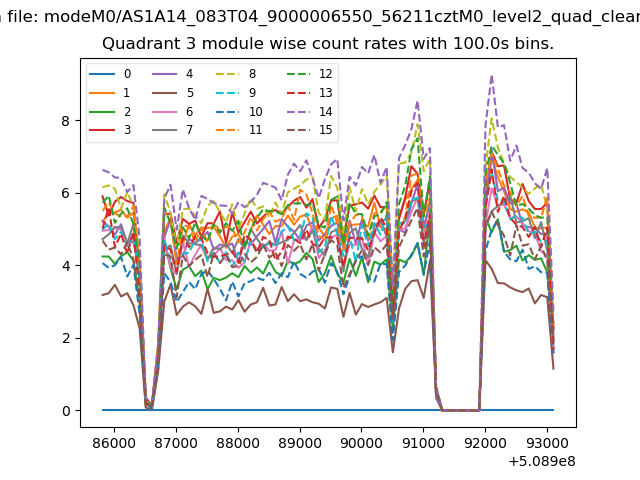
| Module-wise count rates for Quadrant A Data is divided into 100 sec bins |
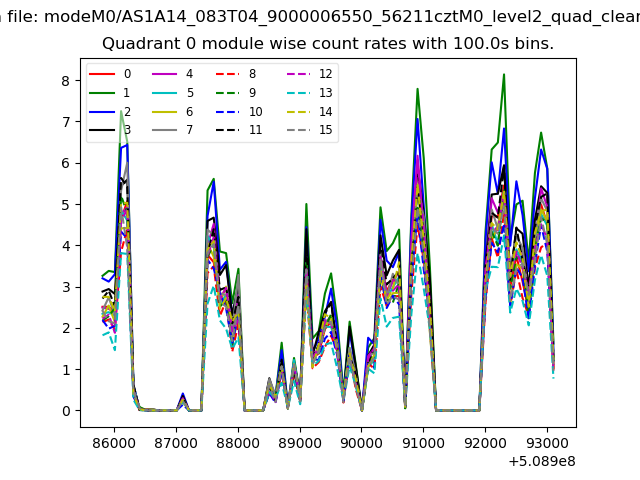 |
 |
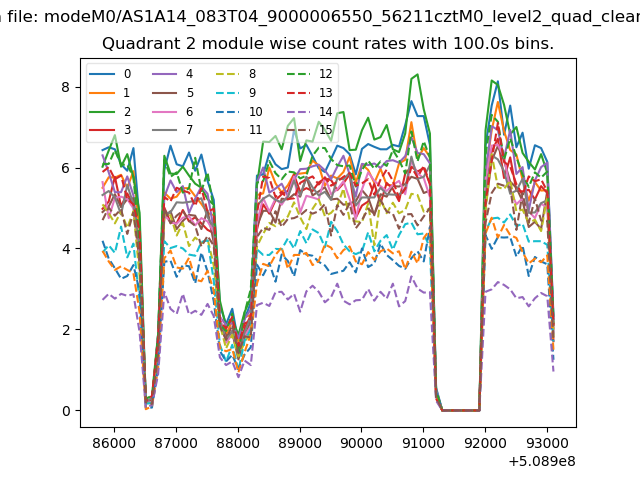
| Module-wise count rates for Quadrant B Data is divided into 100 sec bins |
 |
 |
| Module-wise count rates for Quadrant C Data is divided into 100 sec bins |
 |
 |
| Module-wise count rates for Quadrant D Data is divided into 100 sec bins |
 |
 |
| Parameter | Plot |
|---|---|
| CZT HV Monitor | 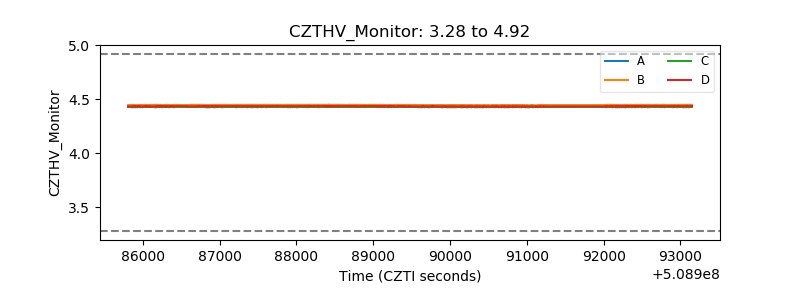 |
| D_VDD | 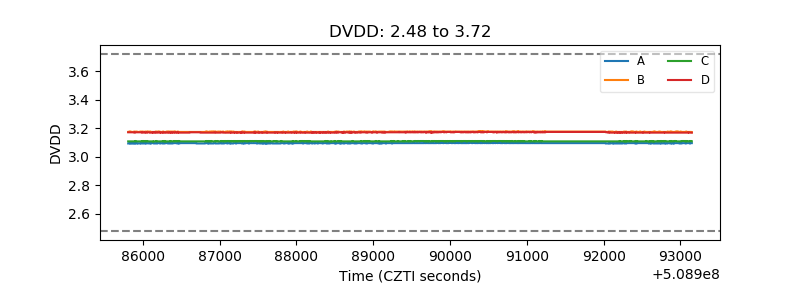 |
| Temperature 1 | 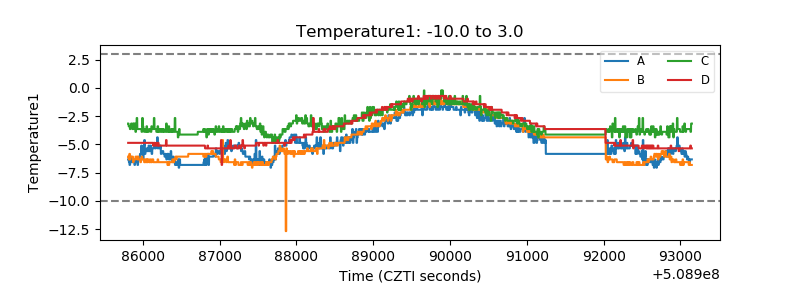 |
| Veto HV Monitor | 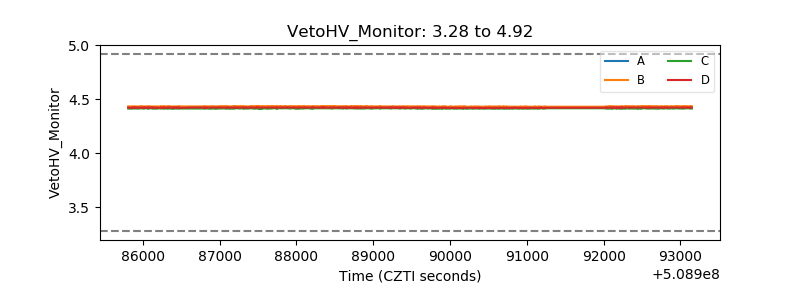 |
| Veto LLD | 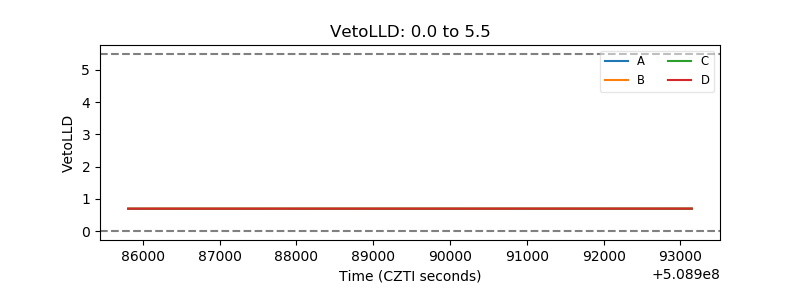 |
| Alpha Counter | 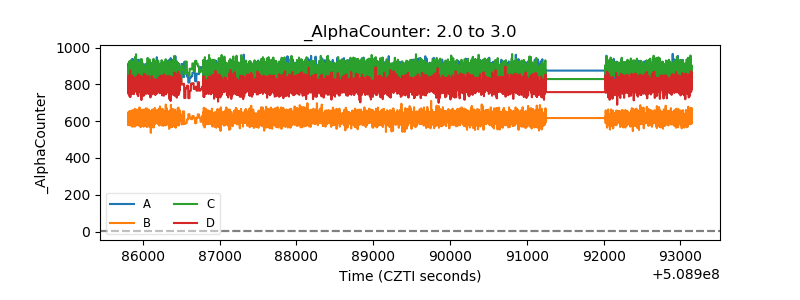 |
| _CPM_Rate | 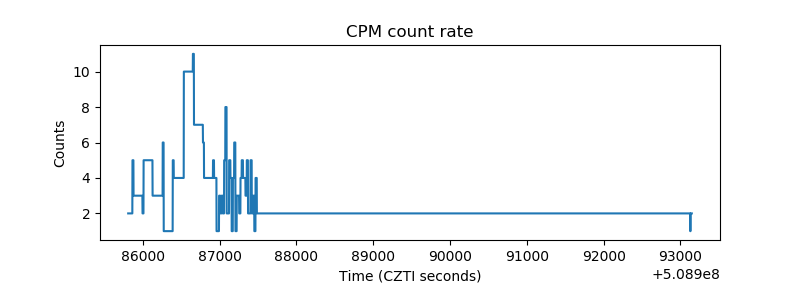 |
| CZT Counter | 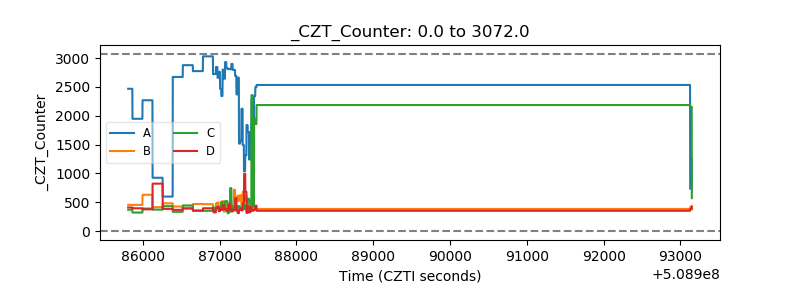 |
| +2.5 Volts monitor | 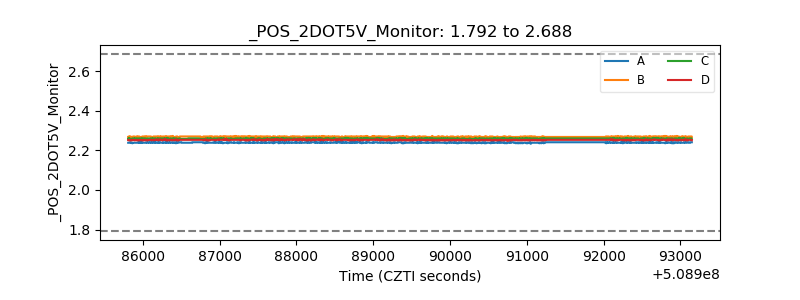 |
| +5 Volts monitor | 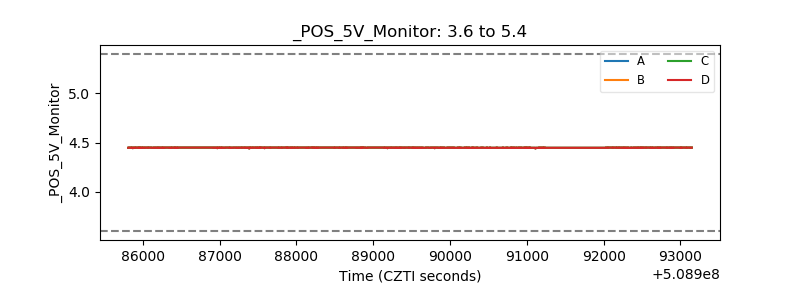 |
| _ROLL_ROT | 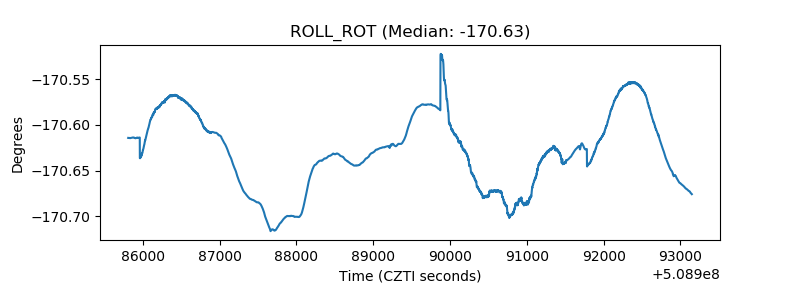 |
| _Roll_DEC | 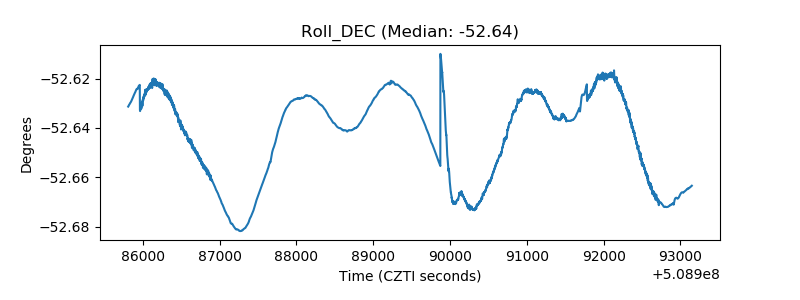 |
| _Roll_RA | 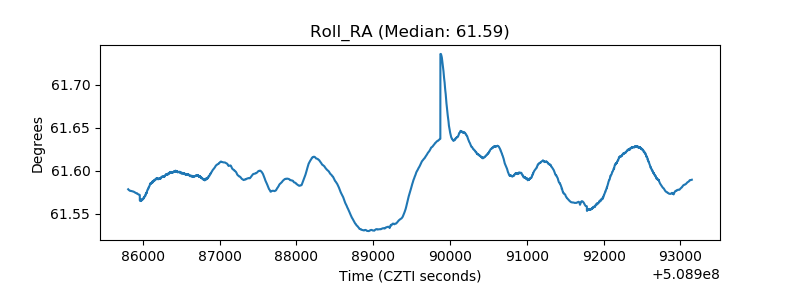 |
| Veto Counter | 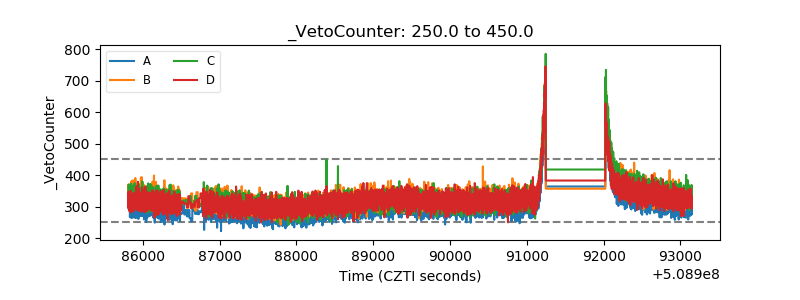 |