| Param | Original file | Final file |
|---|---|---|
| Filename | modeM0/AS1A14_083T04_9000006550_56212cztM0_level2.fits | modeM0/AS1A14_083T04_9000006550_56212cztM0_level2_quad_clean.evt |
| Size (bytes) | 754,473,600 | 79,899,840 |
| Size | 719.5 MB | 76.2 MB |
| Events in quadrant A | 12,547,068 | 291,100 |
| Events in quadrant B | 3,477,688 | 670,933 |
| Events in quadrant C | 7,924,069 | 436,525 |
| Events in quadrant D | 3,471,867 | 564,771 |
| Mode SS | |||
|---|---|---|---|
| Quadrant | BADHDUFLAG | Total packets | Discarded packets |
| A | 0 | 132 | 0 |
| B | 0 | 132 | 0 |
| C | 0 | 132 | 0 |
| D | 0 | 132 | 0 |
| Mode M9 | |||
|---|---|---|---|
| Quadrant | BADHDUFLAG | Total packets | Discarded packets |
| A | 0 | 10 | 0 |
| B | 0 | 10 | 0 |
| C | 0 | 10 | 0 |
| D | 0 | 10 | 0 |
| Mode M0 | |||
|---|---|---|---|
| Quadrant | BADHDUFLAG | Total packets | Discarded packets |
| A | 0 | 41748 | 1 |
| B | 0 | 14879 | 1 |
| C | 0 | 28012 | 1 |
| D | 0 | 15158 | 1 |
| Quadrant | Total seconds | Saturated seconds | Saturation percentage |
|---|---|---|---|
| A | 6537 | 3630 | 55.530060% |
| B | 6537 | 139 | 2.126358% |
| C | 6538 | 2047 | 31.309269% |
| D | 6538 | 135 | 2.064852% |
Noise dominated data is calculated using 1-second bins in cleaned event files. If a bin has >2000 counts, and if more than 50% of those come from <1% of pixels, then it is considered to be noise-dominated and hence unusable.
| Quadrant | # 1 sec bins | Bins with >0 counts | Bins with >2000 counts | High rate bins dominated by noise | Noise dominated (total time) | Noise dominated (detector-on time) | Marked lightcurve |
|---|---|---|---|---|---|---|---|
| A | 7481 | 6536 | 3577 | 3577 | 47.81% | 54.73% |  |
| B | 7482 | 6537 | 46 | 46 | 0.61% | 0.70% |  |
| C | 7483 | 6538 | 1839 | 1839 | 24.58% | 28.13% |  |
| D | 7483 | 6538 | 115 | 115 | 1.54% | 1.76% | 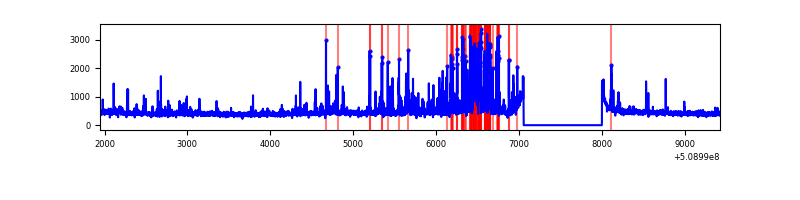 |
Top three noisy pixels from each quadrant. If the there are fewer than three noisy pixels in the level2.evt file, extra rows are filled as -1
| Pixel properties | Quadrant properties | ||||||
|---|---|---|---|---|---|---|---|
| Quadrant | DetID | PixID | Counts | Sigma | Mean | Median | Sigma |
| A | 12 | 115 | 7679554 | 63678.9 | 482 | 471 | 120.6 |
| A | 7 | 64 | 1306280 | 10828.44 | 482 | 471 | 120.6 |
| A | 8 | 176 | 771991 | 6397.84 | 482 | 471 | 120.6 |
| B | 0 | 171 | 147928 | 1006.95 | 690 | 666 | 146.2 |
| B | 1 | 255 | 139142 | 946.87 | 690 | 666 | 146.2 |
| B | 5 | 185 | 124133 | 844.24 | 690 | 666 | 146.2 |
| C | 12 | 254 | 5394036 | 34846.38 | 564 | 557 | 154.8 |
| C | 12 | 252 | 173306 | 1116.1 | 564 | 557 | 154.8 |
| C | 9 | 237 | 61311 | 392.52 | 564 | 557 | 154.8 |
| D | 6 | 239 | 469862 | 2480.98 | 674 | 643 | 189.1 |
| D | 13 | 153 | 80864 | 424.17 | 674 | 643 | 189.1 |
| D | 2 | 120 | 72622 | 380.59 | 674 | 643 | 189.1 |
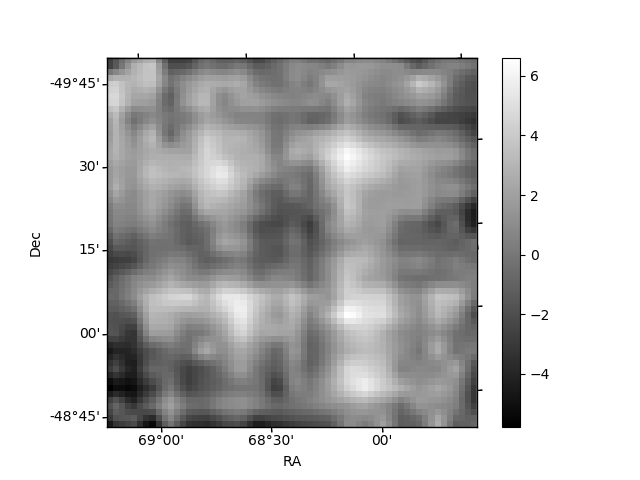
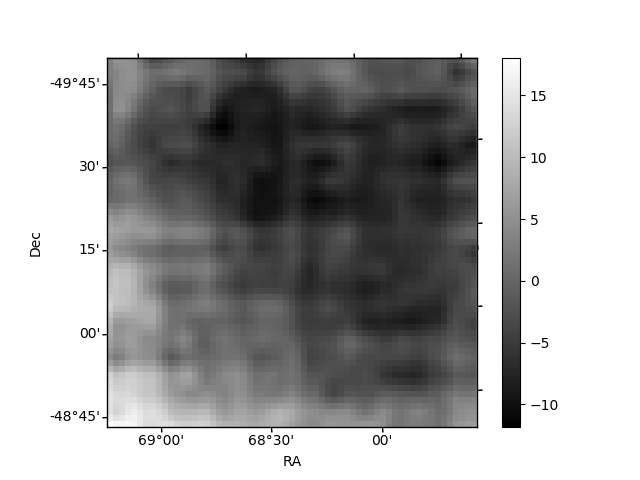
Histogram calculated using DETX and DETY for each event in the final _common_clean file
| Quadrant A | 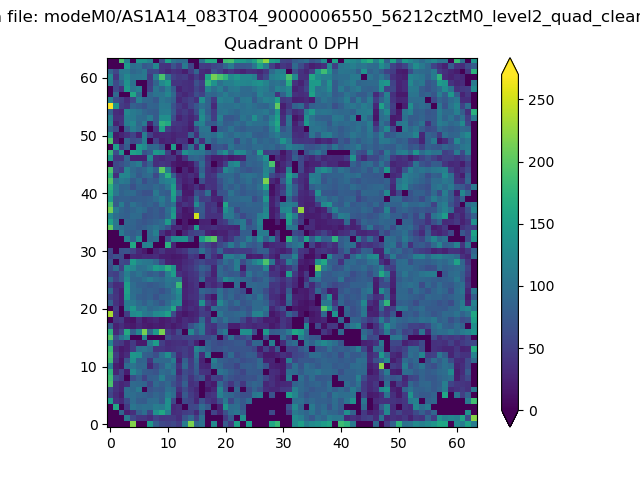 |
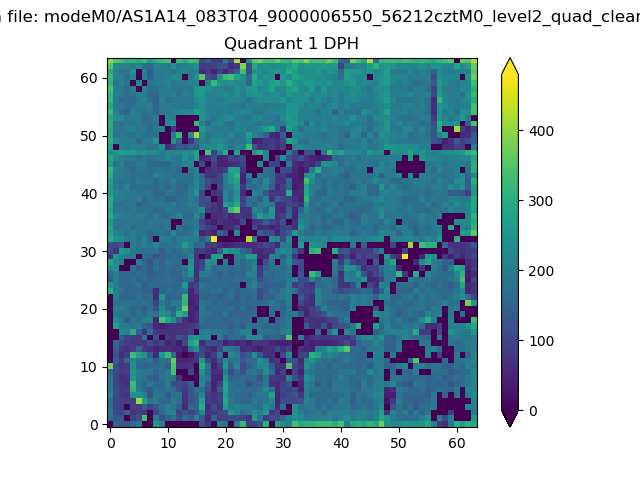 |
Quadrant B |
|---|---|---|---|
| Quadrant D | 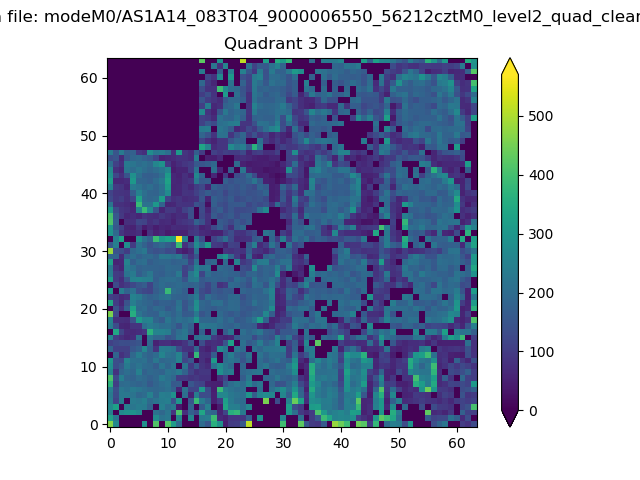 |
 |
Quadrant C |
| Plot type | Count rate plots | Images |
|---|---|---|
| Comparison with Poisson distribution Blue bars denote a histogram of data divided into 1 sec bins. Red curve is a Poisson curve with rate = median count rate of data. |
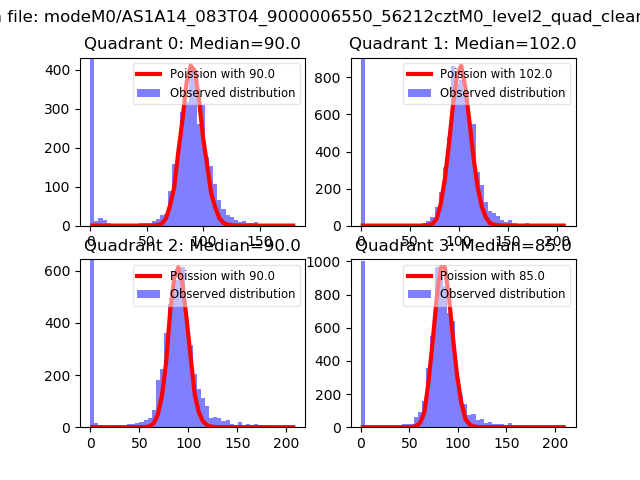 |
 |
| Quadrant-wise count rates Data is divided into 100 sec bins |
 |
|
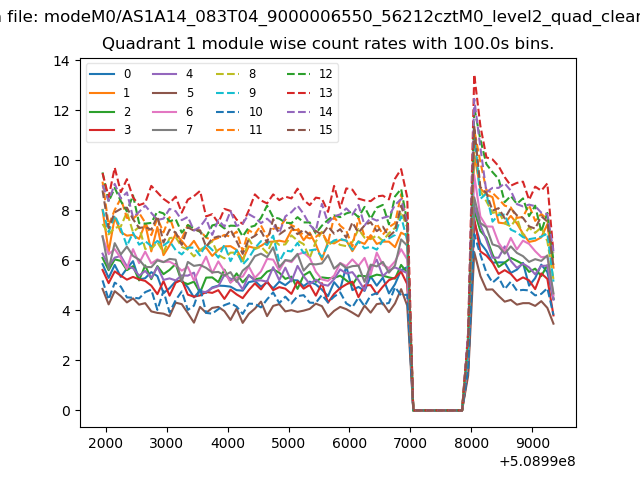
| Module-wise count rates for Quadrant A Data is divided into 100 sec bins |
 |
 |
| Module-wise count rates for Quadrant B Data is divided into 100 sec bins |
 |
 |
| Module-wise count rates for Quadrant C Data is divided into 100 sec bins |
 |
 |
| Module-wise count rates for Quadrant D Data is divided into 100 sec bins |
 |
 |
| Parameter | Plot |
|---|---|
| CZT HV Monitor | 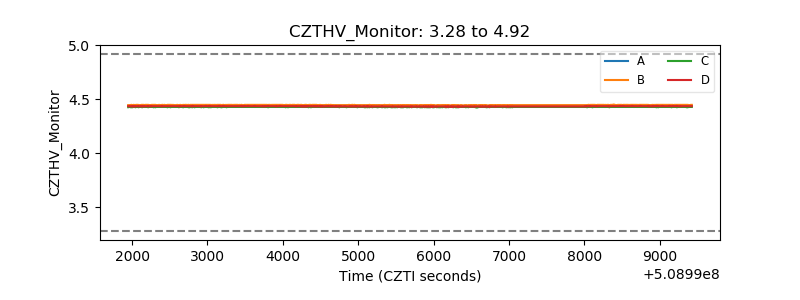 |
| D_VDD | 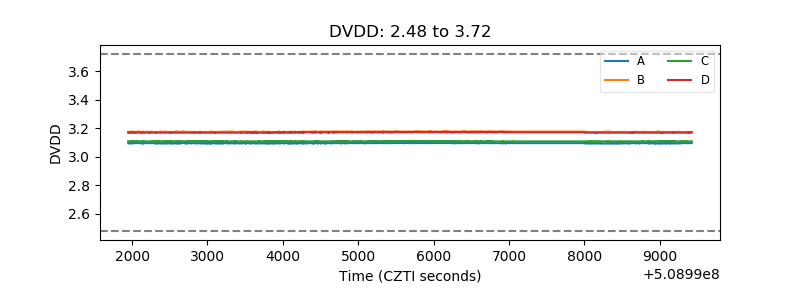 |
| Temperature 1 |  |
| Veto HV Monitor | 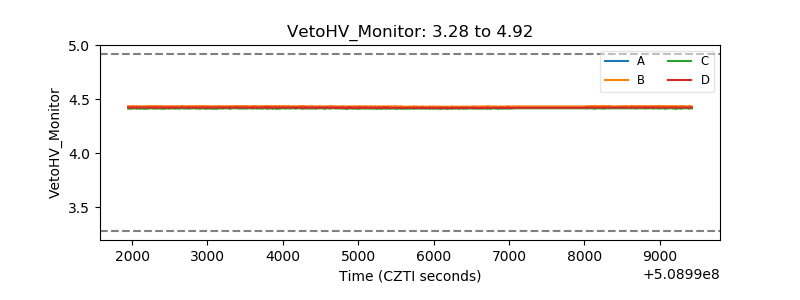 |
| Veto LLD |  |
| Alpha Counter |  |
| _CPM_Rate | 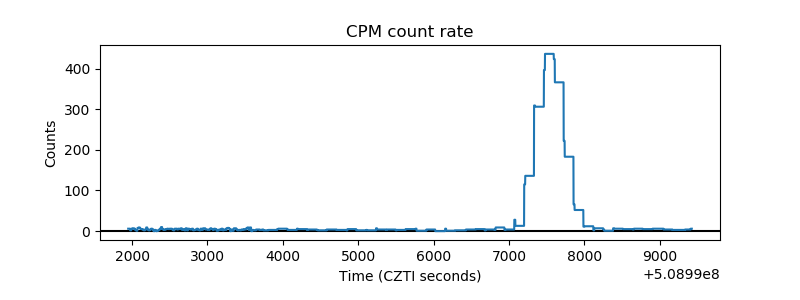 |
| CZT Counter |  |
| +2.5 Volts monitor |  |
| +5 Volts monitor | 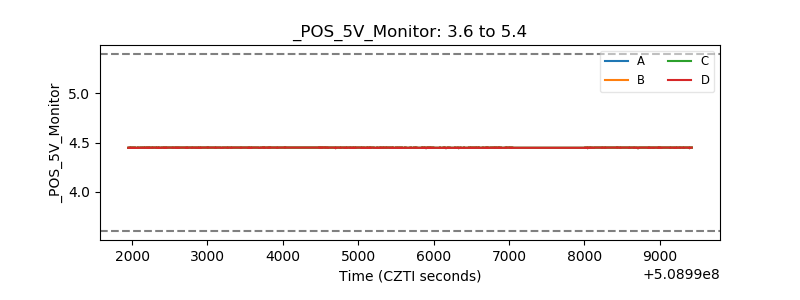 |
| _ROLL_ROT |  |
| _Roll_DEC |  |
| _Roll_RA |  |
| Veto Counter |  |