| Param | Original file | Final file |
|---|---|---|
| Filename | modeM0/AS1A14_083T04_9000006550_56215cztM0_level2.fits | modeM0/AS1A14_083T04_9000006550_56215cztM0_level2_quad_clean.evt |
| Size (bytes) | 496,704,960 | 96,390,720 |
| Size | 473.7 MB | 91.9 MB |
| Events in quadrant A | 6,715,218 | 552,180 |
| Events in quadrant B | 3,535,961 | 703,046 |
| Events in quadrant C | 4,284,032 | 613,249 |
| Events in quadrant D | 3,344,620 | 595,685 |
| Mode SS | |||
|---|---|---|---|
| Quadrant | BADHDUFLAG | Total packets | Discarded packets |
| A | 0 | 132 | 0 |
| B | 0 | 132 | 0 |
| C | 0 | 132 | 0 |
| D | 0 | 132 | 0 |
| Mode M9 | |||
|---|---|---|---|
| Quadrant | BADHDUFLAG | Total packets | Discarded packets |
| A | 0 | 12 | 0 |
| B | 0 | 12 | 0 |
| C | 0 | 12 | 0 |
| D | 0 | 12 | 0 |
| Mode M0 | |||
|---|---|---|---|
| Quadrant | BADHDUFLAG | Total packets | Discarded packets |
| A | 0 | 24376 | 2 |
| B | 0 | 15104 | 2 |
| C | 0 | 17320 | 2 |
| D | 0 | 14496 | 2 |
| Quadrant | Total seconds | Saturated seconds | Saturation percentage |
|---|---|---|---|
| A | 6517 | 1165 | 17.876323% |
| B | 6517 | 239 | 3.667332% |
| C | 6517 | 396 | 6.076416% |
| D | 6518 | 149 | 2.285977% |
Noise dominated data is calculated using 1-second bins in cleaned event files. If a bin has >2000 counts, and if more than 50% of those come from <1% of pixels, then it is considered to be noise-dominated and hence unusable.
| Quadrant | # 1 sec bins | Bins with >0 counts | Bins with >2000 counts | High rate bins dominated by noise | Noise dominated (total time) | Noise dominated (detector-on time) | Marked lightcurve |
|---|---|---|---|---|---|---|---|
| A | 7627 | 6517 | 941 | 941 | 12.34% | 14.44% |  |
| B | 7627 | 6517 | 35 | 35 | 0.46% | 0.54% | 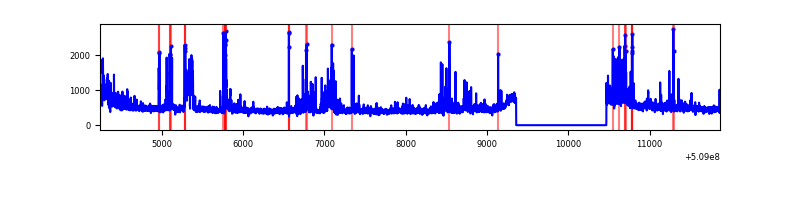 |
| C | 7627 | 6517 | 236 | 236 | 3.09% | 3.62% |  |
| D | 7628 | 6518 | 42 | 42 | 0.55% | 0.64% |  |
Top three noisy pixels from each quadrant. If the there are fewer than three noisy pixels in the level2.evt file, extra rows are filled as -1
| Pixel properties | Quadrant properties | ||||||
|---|---|---|---|---|---|---|---|
| Quadrant | DetID | PixID | Counts | Sigma | Mean | Median | Sigma |
| A | 12 | 115 | 2454914 | 14714.43 | 674 | 657 | 166.8 |
| A | 4 | 95 | 524396 | 3140.06 | 674 | 657 | 166.8 |
| A | 8 | 176 | 467956 | 2801.68 | 674 | 657 | 166.8 |
| B | 1 | 255 | 198897 | 1273.86 | 723 | 695 | 155.6 |
| B | 5 | 185 | 197247 | 1263.26 | 723 | 695 | 155.6 |
| B | 0 | 171 | 80349 | 511.94 | 723 | 695 | 155.6 |
| C | 12 | 254 | 1022357 | 5327.01 | 703 | 694 | 191.8 |
| C | 12 | 252 | 302914 | 1575.79 | 703 | 694 | 191.8 |
| C | 9 | 38 | 115036 | 596.18 | 703 | 694 | 191.8 |
| D | 6 | 239 | 169354 | 839.93 | 714 | 683 | 200.8 |
| D | 3 | 12 | 70483 | 347.58 | 714 | 683 | 200.8 |
| D | 14 | 52 | 67313 | 331.8 | 714 | 683 | 200.8 |
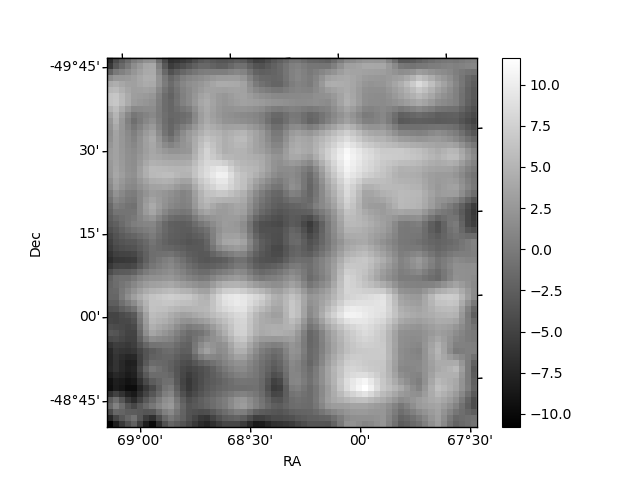
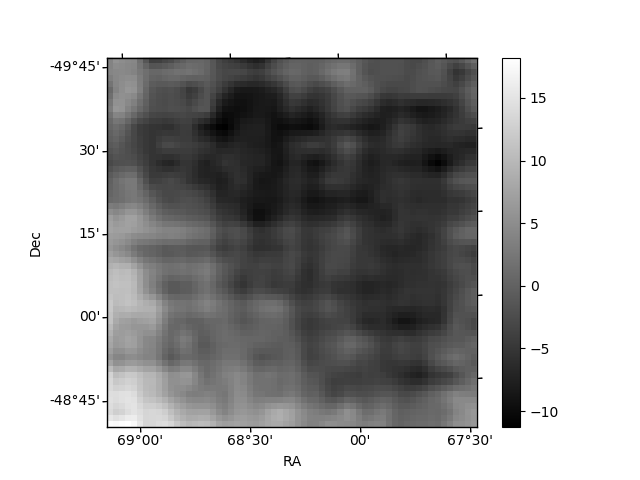
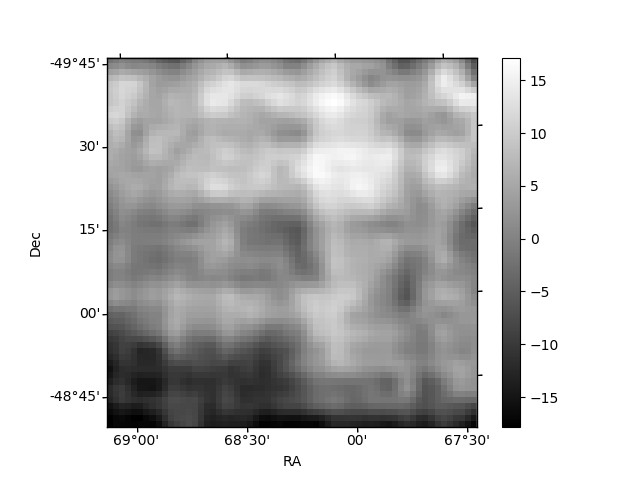
Histogram calculated using DETX and DETY for each event in the final _common_clean file
| Quadrant A | 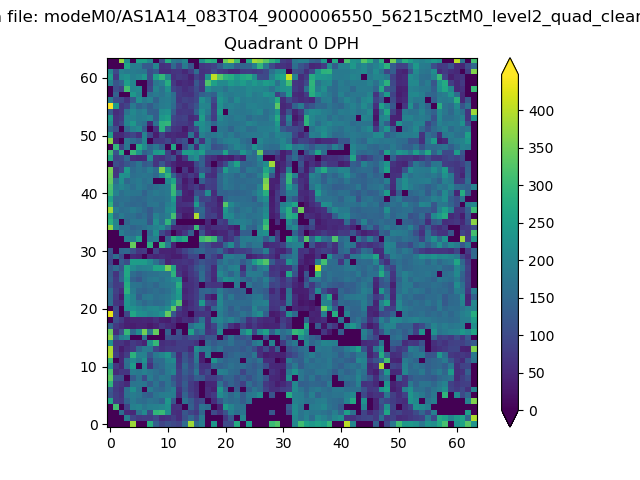 |
 |
Quadrant B |
|---|---|---|---|
| Quadrant D |  |
 |
Quadrant C |
| Plot type | Count rate plots | Images |
|---|---|---|
| Comparison with Poisson distribution Blue bars denote a histogram of data divided into 1 sec bins. Red curve is a Poisson curve with rate = median count rate of data. |
 |
 |
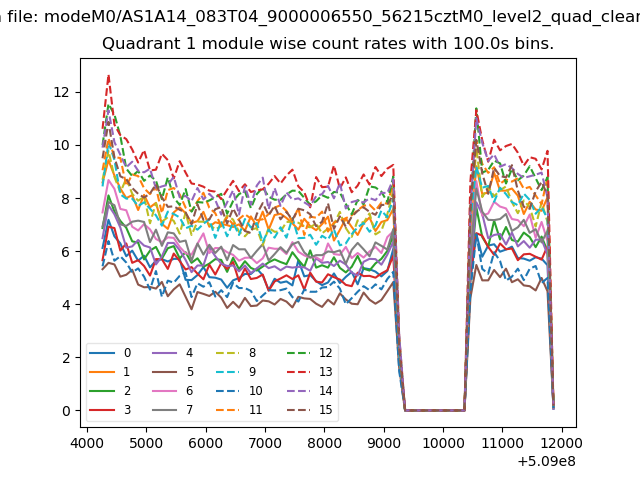
| Quadrant-wise count rates Data is divided into 100 sec bins |
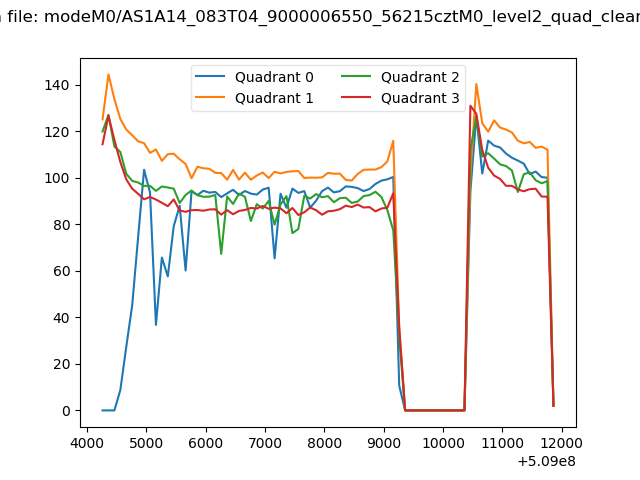 |
|
| Module-wise count rates for Quadrant A Data is divided into 100 sec bins |
 |
 |
| Module-wise count rates for Quadrant B Data is divided into 100 sec bins |
 |
 |
| Module-wise count rates for Quadrant C Data is divided into 100 sec bins |
 |
 |
| Module-wise count rates for Quadrant D Data is divided into 100 sec bins |
 |
 |
| Parameter | Plot |
|---|---|
| CZT HV Monitor | 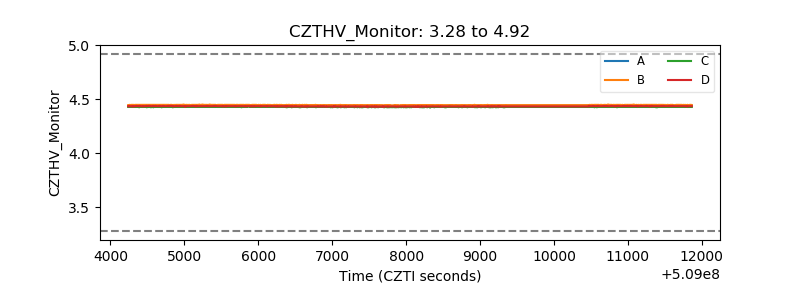 |
| D_VDD |  |
| Temperature 1 | 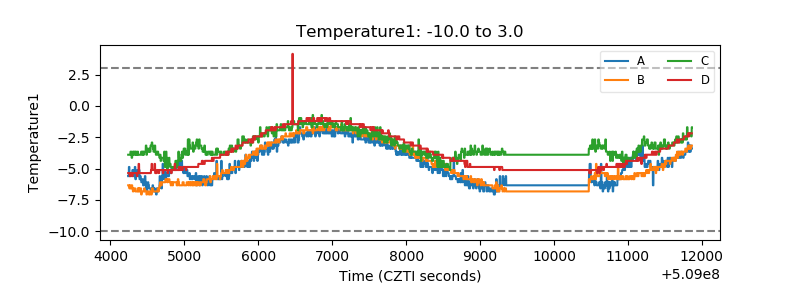 |
| Veto HV Monitor |  |
| Veto LLD |  |
| Alpha Counter |  |
| _CPM_Rate |  |
| CZT Counter | 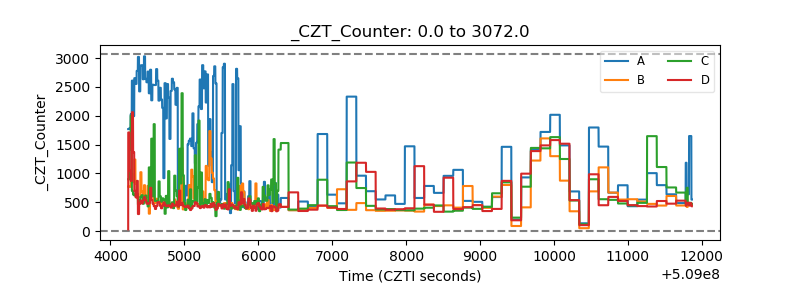 |
| +2.5 Volts monitor |  |
| +5 Volts monitor |  |
| _ROLL_ROT |  |
| _Roll_DEC |  |
| _Roll_RA |  |
| Veto Counter |  |