| Param | Original file | Final file |
|---|---|---|
| Filename | modeM0/AS1A14_083T04_9000006550_56221cztM0_level2.fits | modeM0/AS1A14_083T04_9000006550_56221cztM0_level2_quad_clean.evt |
| Size (bytes) | 736,675,200 | 82,094,400 |
| Size | 702.5 MB | 78.3 MB |
| Events in quadrant A | 13,018,000 | 331,529 |
| Events in quadrant B | 4,000,403 | 631,275 |
| Events in quadrant C | 4,610,876 | 538,774 |
| Events in quadrant D | 5,086,911 | 486,646 |
| Mode SS | |||
|---|---|---|---|
| Quadrant | BADHDUFLAG | Total packets | Discarded packets |
| A | 0 | 142 | 0 |
| B | 0 | 142 | 0 |
| C | 0 | 142 | 0 |
| D | 0 | 142 | 0 |
| Mode M0 | |||
|---|---|---|---|
| Quadrant | BADHDUFLAG | Total packets | Discarded packets |
| A | 0 | 43692 | 0 |
| B | 0 | 16994 | 0 |
| C | 0 | 18788 | 0 |
| D | 0 | 20223 | 0 |
| Quadrant | Total seconds | Saturated seconds | Saturation percentage |
|---|---|---|---|
| A | 7139 | 3538 | 49.558762% |
| B | 7139 | 217 | 3.039641% |
| C | 7140 | 277 | 3.879552% |
| D | 7140 | 372 | 5.210084% |
Noise dominated data is calculated using 1-second bins in cleaned event files. If a bin has >2000 counts, and if more than 50% of those come from <1% of pixels, then it is considered to be noise-dominated and hence unusable.
| Quadrant | # 1 sec bins | Bins with >0 counts | Bins with >2000 counts | High rate bins dominated by noise | Noise dominated (total time) | Noise dominated (detector-on time) | Marked lightcurve |
|---|---|---|---|---|---|---|---|
| A | 7418 | 7227 | 3433 | 3433 | 46.28% | 47.50% | 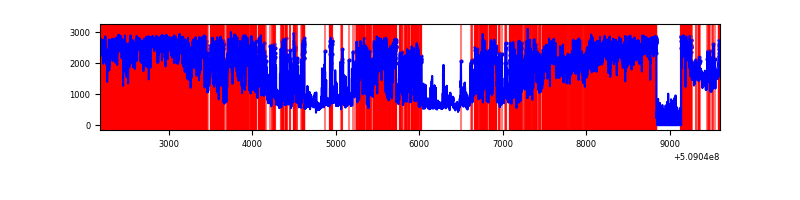 |
| B | 7419 | 7419 | 140 | 140 | 1.89% | 1.89% | 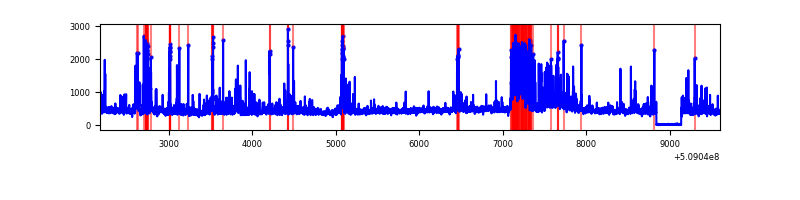 |
| C | 7420 | 7420 | 305 | 305 | 4.11% | 4.11% | 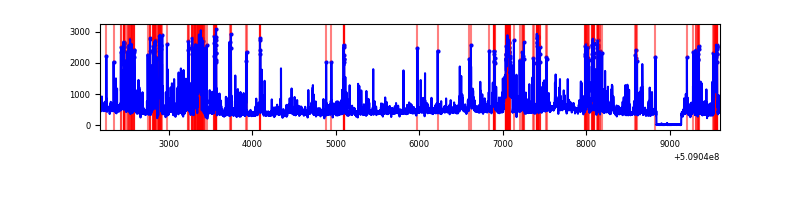 |
| D | 7420 | 7414 | 402 | 402 | 5.42% | 5.42% | 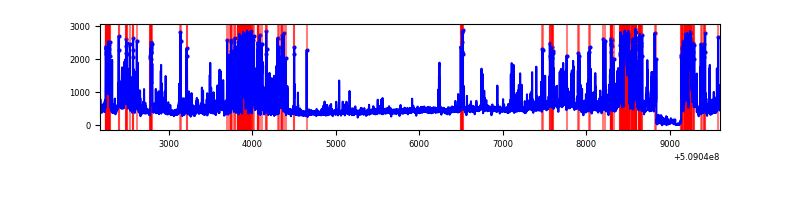 |
Top three noisy pixels from each quadrant. If the there are fewer than three noisy pixels in the level2.evt file, extra rows are filled as -1
| Pixel properties | Quadrant properties | ||||||
|---|---|---|---|---|---|---|---|
| Quadrant | DetID | PixID | Counts | Sigma | Mean | Median | Sigma |
| A | 15 | 32 | 7026907 | 47793.81 | 584 | 568 | 147.0 |
| A | 8 | 176 | 3225942 | 21939.29 | 584 | 568 | 147.0 |
| A | 10 | 251 | 199151 | 1350.78 | 584 | 568 | 147.0 |
| B | 5 | 185 | 462684 | 2967.31 | 731 | 706 | 155.7 |
| B | 0 | 213 | 176673 | 1130.24 | 731 | 706 | 155.7 |
| B | 0 | 171 | 124314 | 793.94 | 731 | 706 | 155.7 |
| C | 12 | 254 | 1150899 | 5986.19 | 702 | 696 | 192.1 |
| C | 12 | 252 | 310340 | 1611.53 | 702 | 696 | 192.1 |
| C | 9 | 38 | 121632 | 629.41 | 702 | 696 | 192.1 |
| D | 2 | 249 | 678482 | 3396.5 | 696 | 664 | 199.6 |
| D | 6 | 239 | 457778 | 2290.57 | 696 | 664 | 199.6 |
| D | 14 | 52 | 270766 | 1353.46 | 696 | 664 | 199.6 |
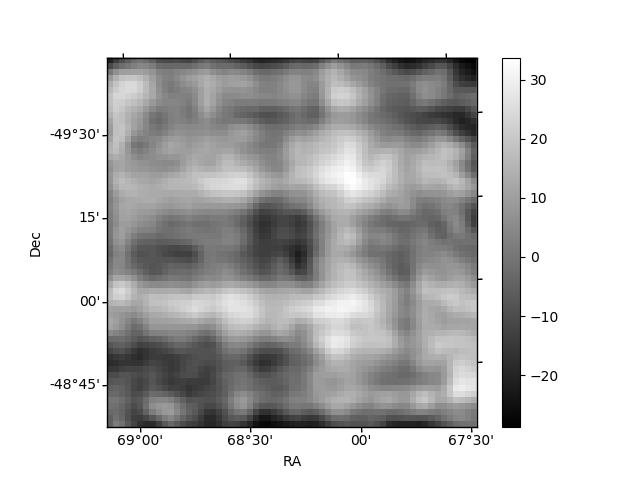
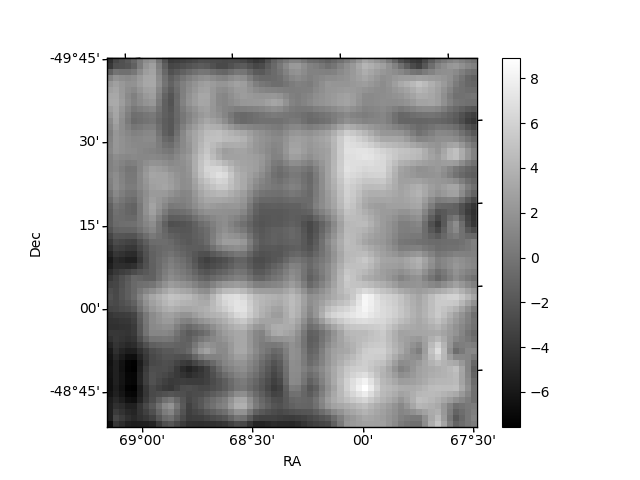
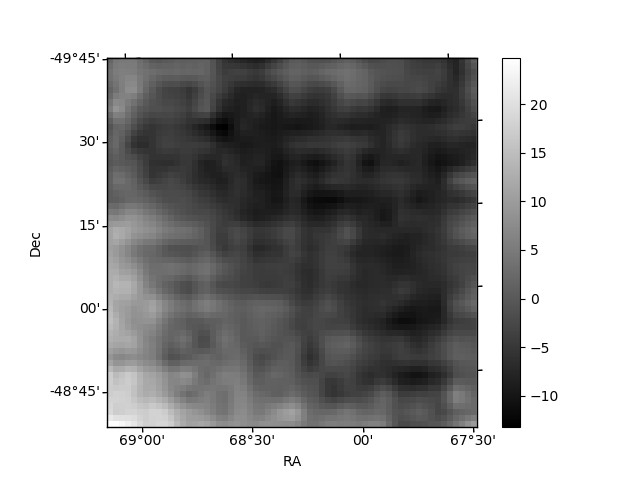
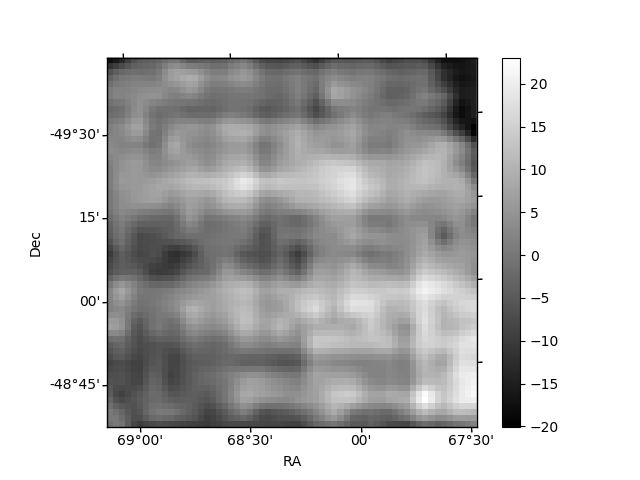
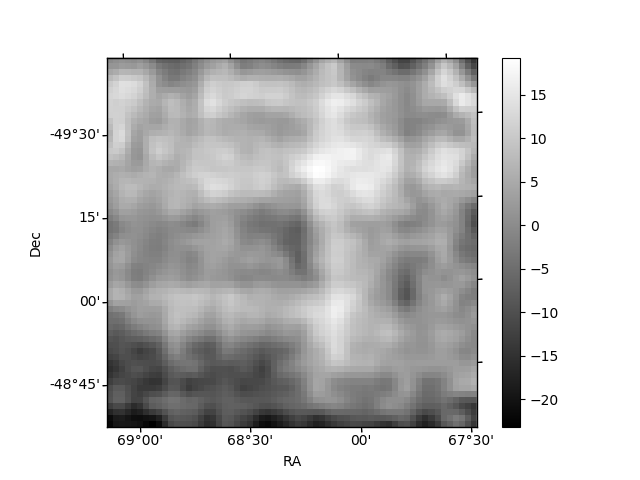
Histogram calculated using DETX and DETY for each event in the final _common_clean file
| Quadrant A | 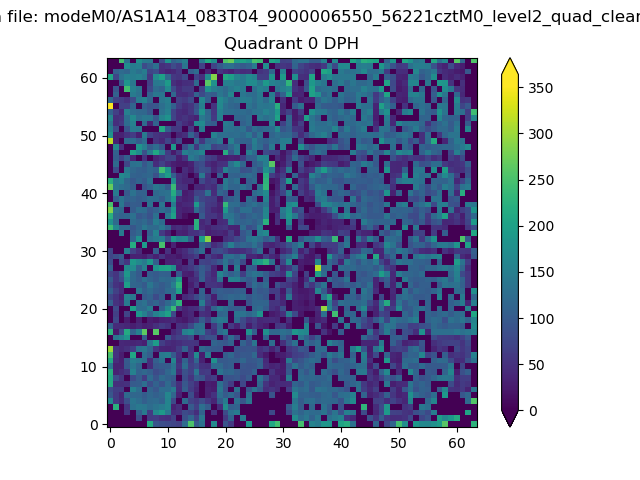 |
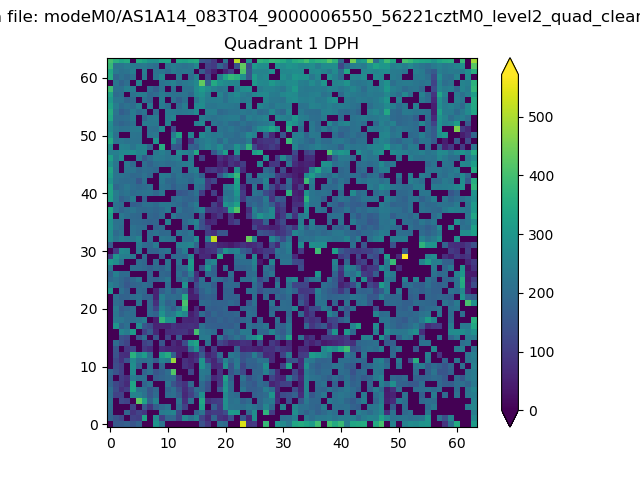 |
Quadrant B |
|---|---|---|---|
| Quadrant D | 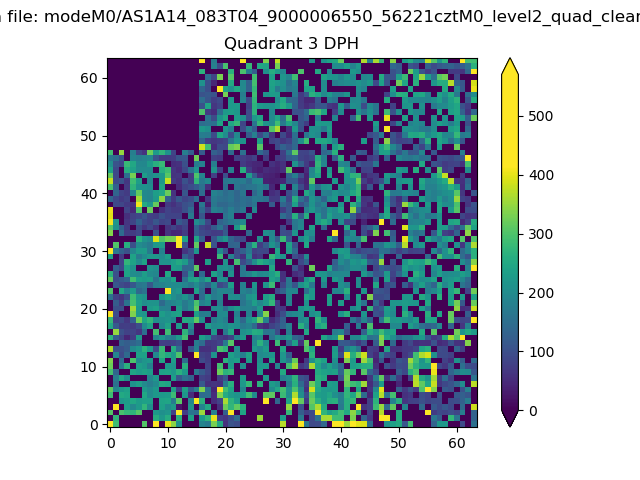 |
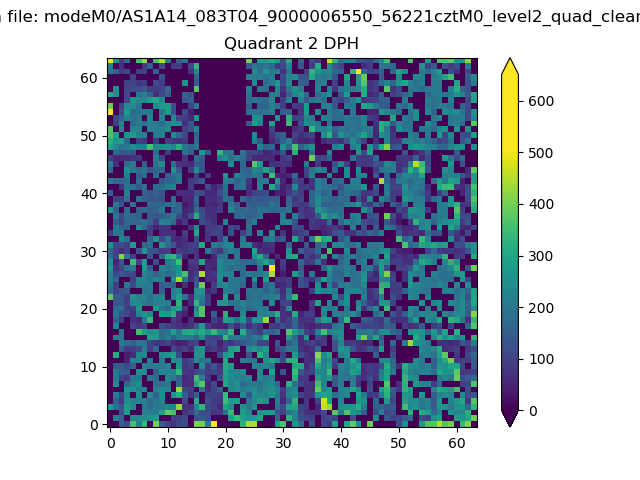 |
Quadrant C |
| Plot type | Count rate plots | Images |
|---|---|---|
| Comparison with Poisson distribution Blue bars denote a histogram of data divided into 1 sec bins. Red curve is a Poisson curve with rate = median count rate of data. |
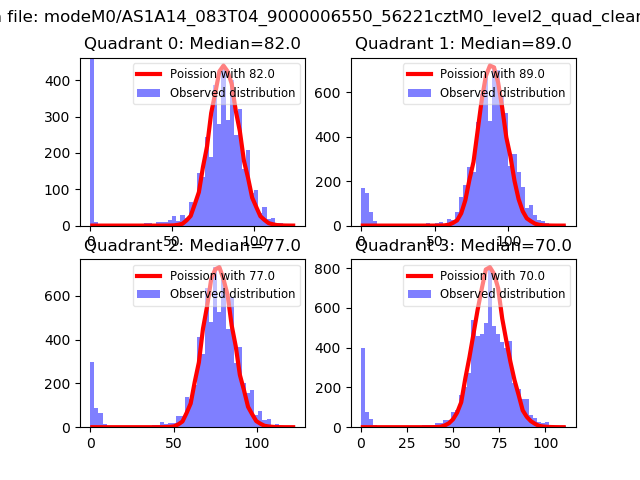 |
 |
| Quadrant-wise count rates Data is divided into 100 sec bins |
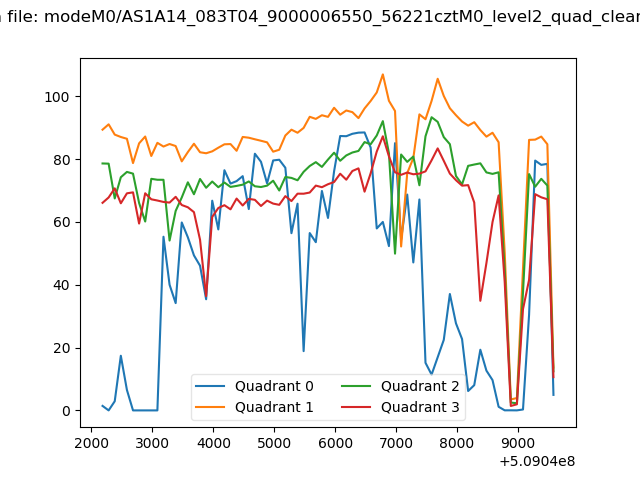 |
|
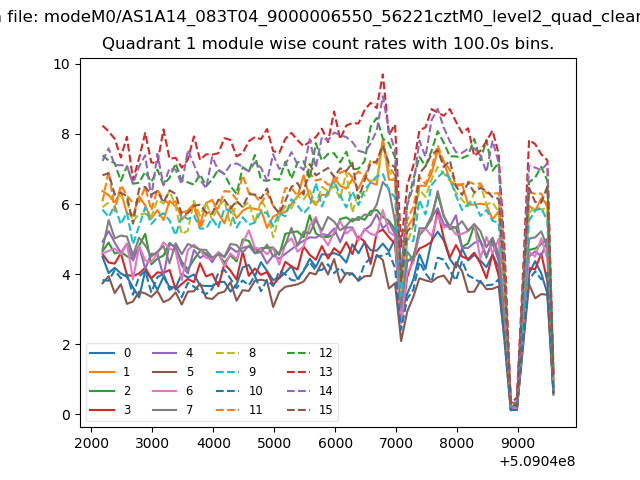
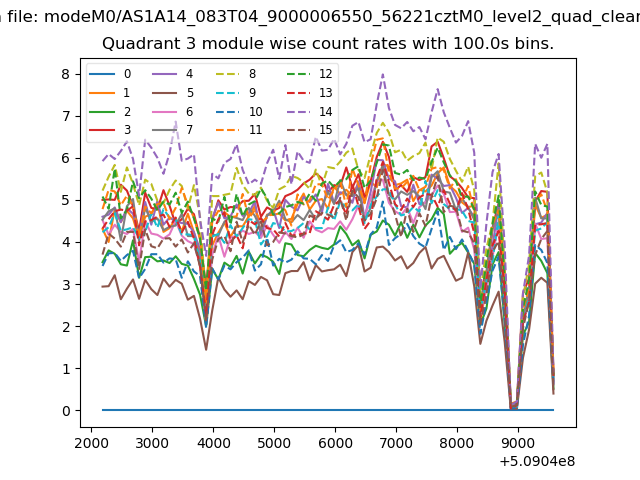
| Module-wise count rates for Quadrant A Data is divided into 100 sec bins |
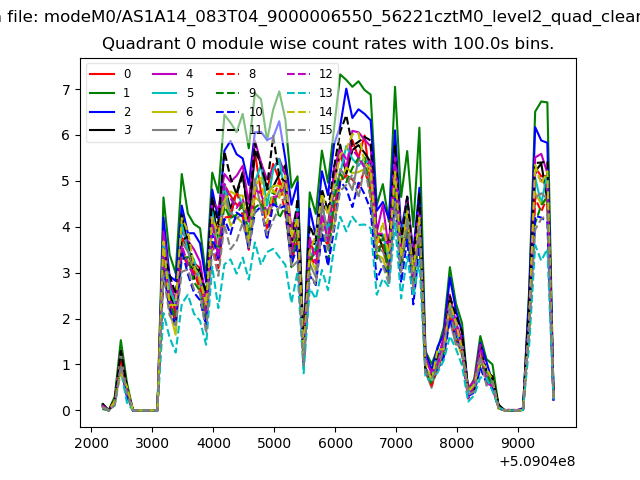 |
 |
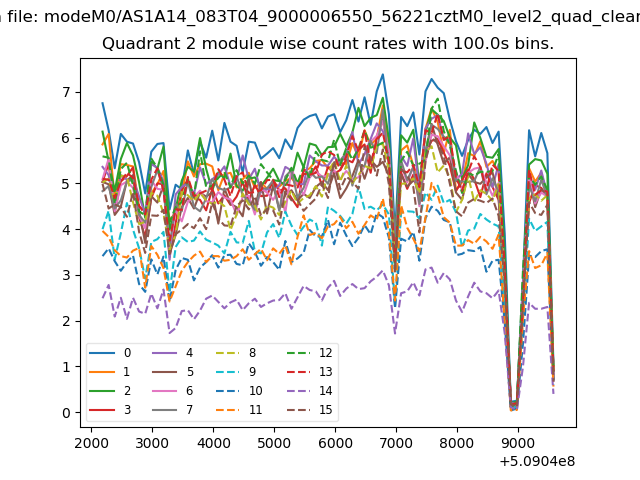
| Module-wise count rates for Quadrant B Data is divided into 100 sec bins |
 |
 |
| Module-wise count rates for Quadrant C Data is divided into 100 sec bins |
 |
 |
| Module-wise count rates for Quadrant D Data is divided into 100 sec bins |
 |
 |
| Parameter | Plot |
|---|---|
| CZT HV Monitor | 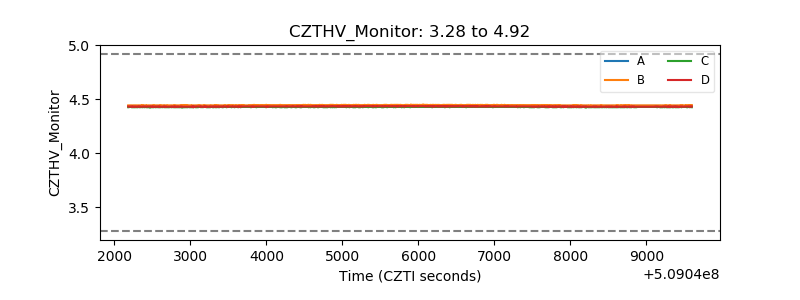 |
| D_VDD | 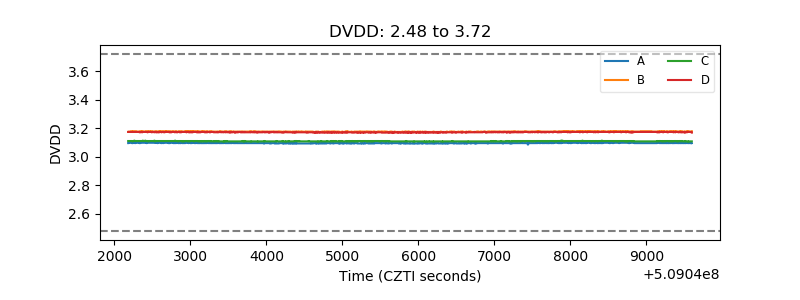 |
| Temperature 1 | 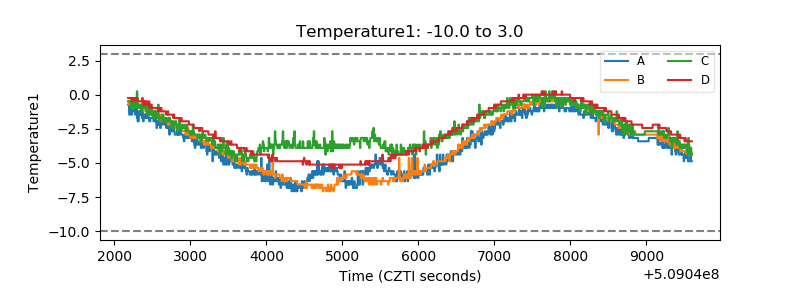 |
| Veto HV Monitor | 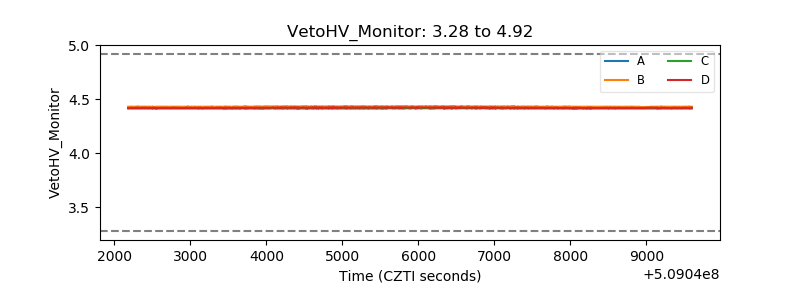 |
| Veto LLD | 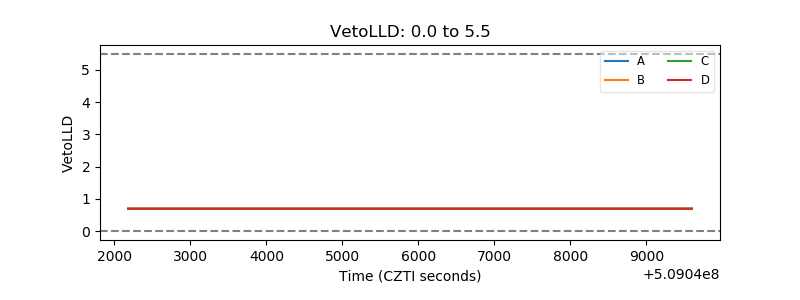 |
| Alpha Counter | 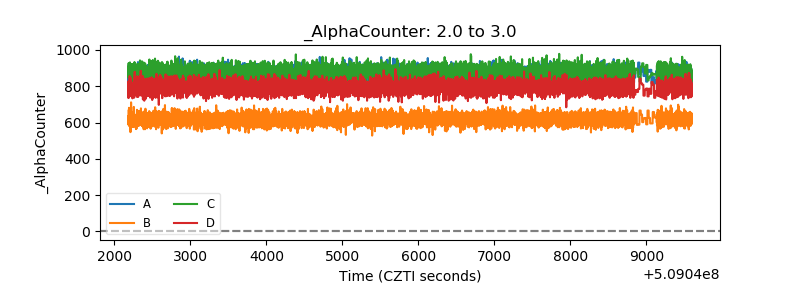 |
| _CPM_Rate | 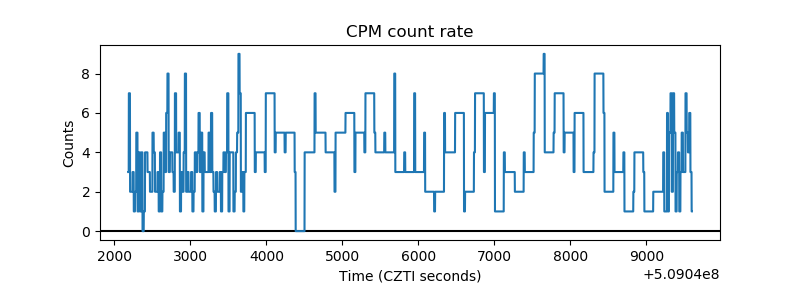 |
| CZT Counter | 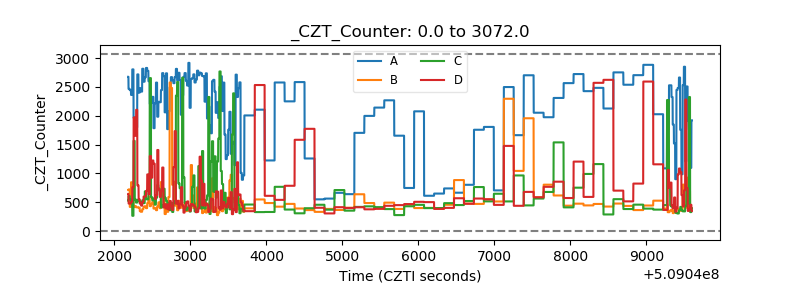 |
| +2.5 Volts monitor | 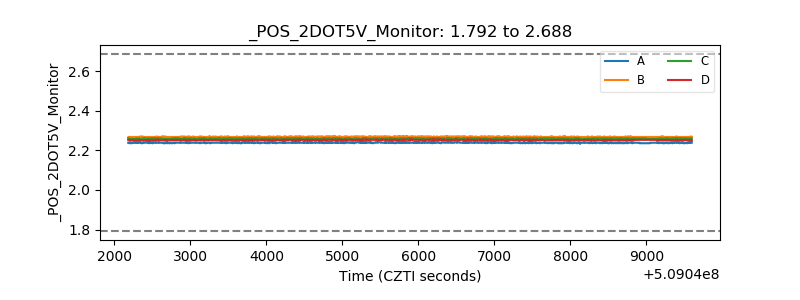 |
| +5 Volts monitor | 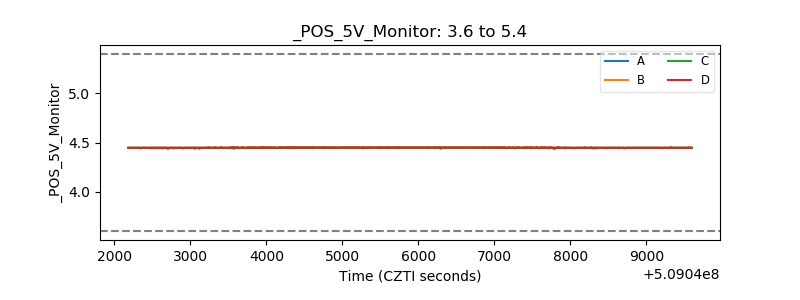 |
| _ROLL_ROT | 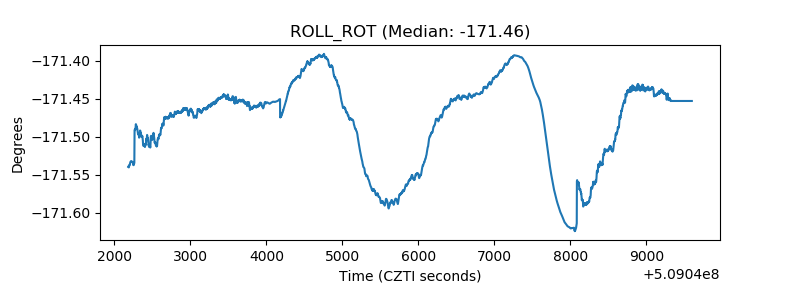 |
| _Roll_DEC | 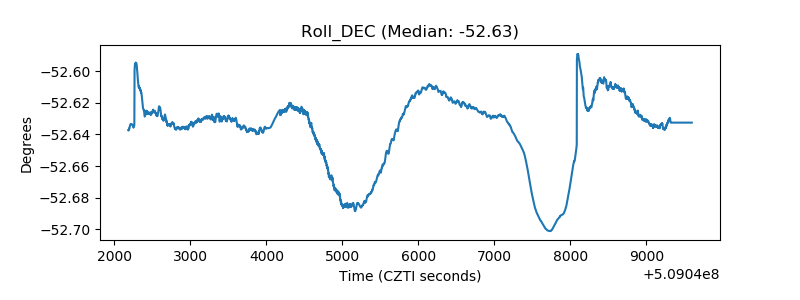 |
| _Roll_RA | 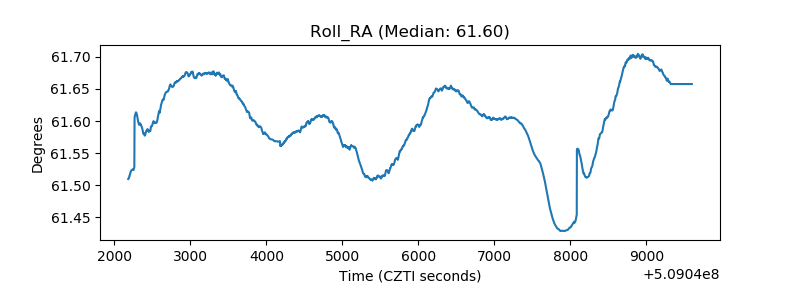 |
| Veto Counter | 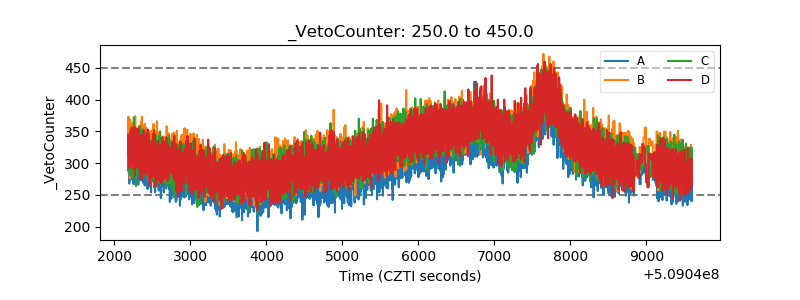 |