| Param | Original file | Final file |
|---|---|---|
| Filename | modeM0/AS1A14_083T04_9000006550_56222cztM0_level2.fits | modeM0/AS1A14_083T04_9000006550_56222cztM0_level2_quad_clean.evt |
| Size (bytes) | 780,834,240 | 84,919,680 |
| Size | 744.7 MB | 81.0 MB |
| Events in quadrant A | 14,001,531 | 343,721 |
| Events in quadrant B | 4,165,631 | 647,405 |
| Events in quadrant C | 3,957,954 | 563,036 |
| Events in quadrant D | 6,190,385 | 487,926 |
| Mode SS | |||
|---|---|---|---|
| Quadrant | BADHDUFLAG | Total packets | Discarded packets |
| A | 0 | 152 | 0 |
| B | 0 | 152 | 0 |
| C | 0 | 152 | 0 |
| D | 0 | 152 | 0 |
| Mode M0 | |||
|---|---|---|---|
| Quadrant | BADHDUFLAG | Total packets | Discarded packets |
| A | 0 | 46884 | 0 |
| B | 0 | 18048 | 0 |
| C | 0 | 17540 | 0 |
| D | 0 | 23826 | 0 |
| Quadrant | Total seconds | Saturated seconds | Saturation percentage |
|---|---|---|---|
| A | 7597 | 3660 | 48.176912% |
| B | 7598 | 279 | 3.672019% |
| C | 7598 | 83 | 1.092393% |
| D | 7597 | 713 | 9.385284% |
Noise dominated data is calculated using 1-second bins in cleaned event files. If a bin has >2000 counts, and if more than 50% of those come from <1% of pixels, then it is considered to be noise-dominated and hence unusable.
| Quadrant | # 1 sec bins | Bins with >0 counts | Bins with >2000 counts | High rate bins dominated by noise | Noise dominated (total time) | Noise dominated (detector-on time) | Marked lightcurve |
|---|---|---|---|---|---|---|---|
| A | 7877 | 7686 | 3715 | 3715 | 47.16% | 48.33% |  |
| B | 7878 | 7878 | 169 | 169 | 2.15% | 2.15% |  |
| C | 7878 | 7878 | 105 | 105 | 1.33% | 1.33% | 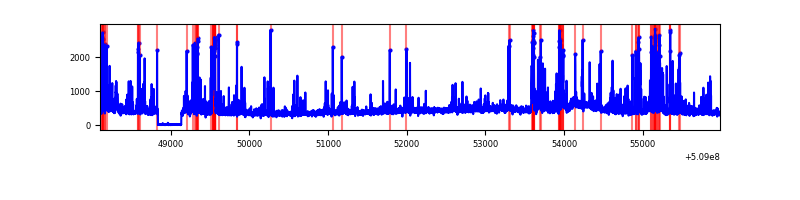 |
| D | 7877 | 7871 | 752 | 752 | 9.55% | 9.55% |  |
Top three noisy pixels from each quadrant. If the there are fewer than three noisy pixels in the level2.evt file, extra rows are filled as -1
| Pixel properties | Quadrant properties | ||||||
|---|---|---|---|---|---|---|---|
| Quadrant | DetID | PixID | Counts | Sigma | Mean | Median | Sigma |
| A | 15 | 32 | 6504308 | 41527.54 | 620 | 604 | 156.6 |
| A | 8 | 176 | 4301823 | 27464.2 | 620 | 604 | 156.6 |
| A | 0 | 8 | 256328 | 1632.85 | 620 | 604 | 156.6 |
| B | 1 | 159 | 495697 | 2960.44 | 777 | 747 | 167.2 |
| B | 10 | 247 | 194572 | 1159.32 | 777 | 747 | 167.2 |
| B | 5 | 185 | 150043 | 892.98 | 777 | 747 | 167.2 |
| C | 12 | 254 | 582401 | 2798.06 | 758 | 751 | 207.9 |
| C | 12 | 252 | 228916 | 1097.6 | 758 | 751 | 207.9 |
| C | 13 | 3 | 70472 | 335.4 | 758 | 751 | 207.9 |
| D | 6 | 239 | 1417924 | 6813.19 | 728 | 696 | 208.0 |
| D | 2 | 249 | 560795 | 2692.62 | 728 | 696 | 208.0 |
| D | 11 | 129 | 267459 | 1282.44 | 728 | 696 | 208.0 |
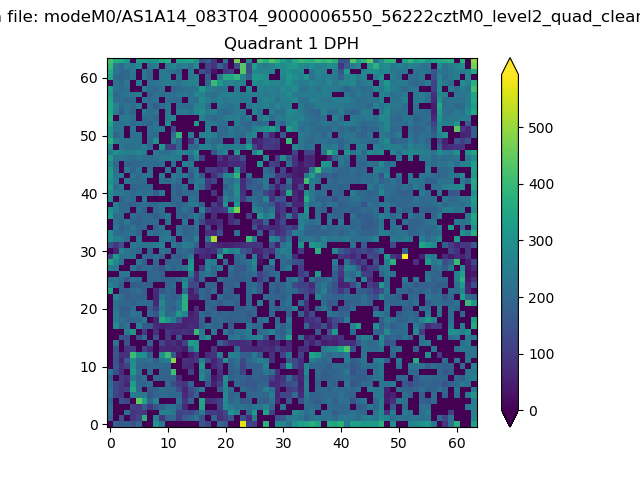
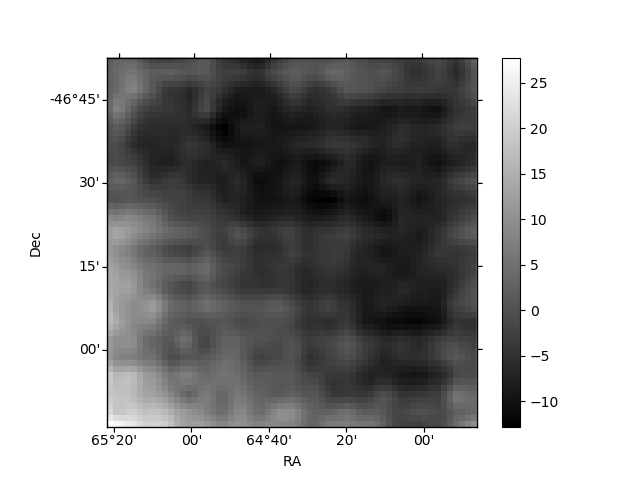
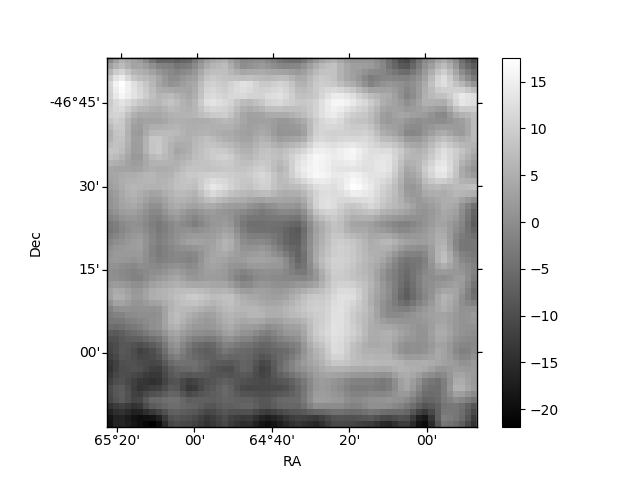
Histogram calculated using DETX and DETY for each event in the final _common_clean file
| Quadrant A |  |
 |
Quadrant B |
|---|---|---|---|
| Quadrant D |  |
 |
Quadrant C |
| Plot type | Count rate plots | Images |
|---|---|---|
| Comparison with Poisson distribution Blue bars denote a histogram of data divided into 1 sec bins. Red curve is a Poisson curve with rate = median count rate of data. |
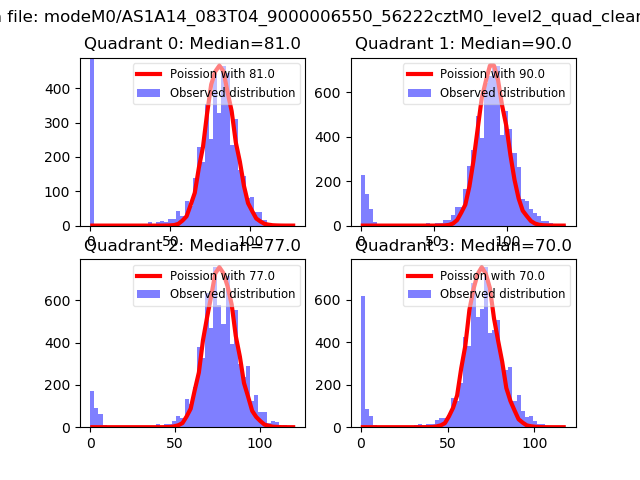 |
 |
| Quadrant-wise count rates Data is divided into 100 sec bins |
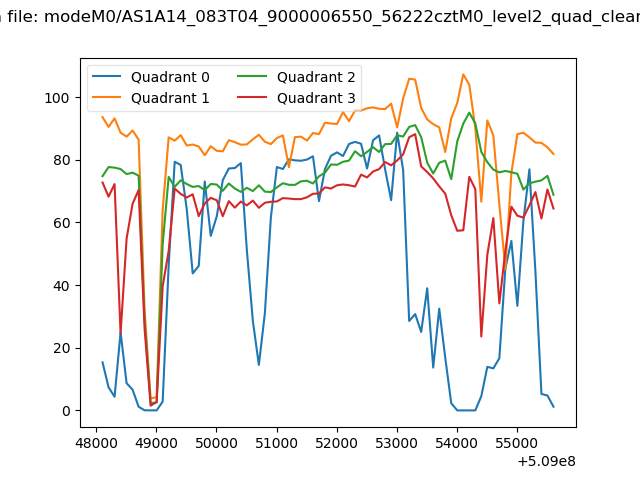 |
|
| Module-wise count rates for Quadrant A Data is divided into 100 sec bins |
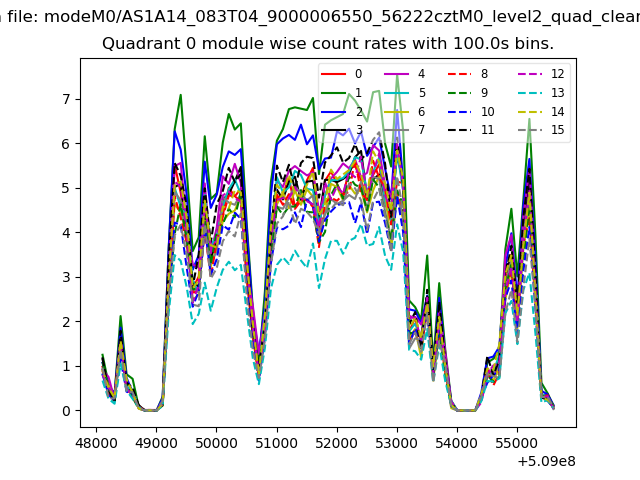 |
 |
| Module-wise count rates for Quadrant B Data is divided into 100 sec bins |
 |
 |
| Module-wise count rates for Quadrant C Data is divided into 100 sec bins |
 |
 |
| Module-wise count rates for Quadrant D Data is divided into 100 sec bins |
 |
 |
| Parameter | Plot |
|---|---|
| CZT HV Monitor | 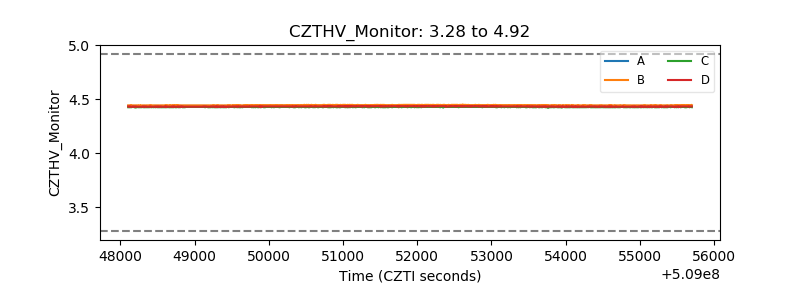 |
| D_VDD | 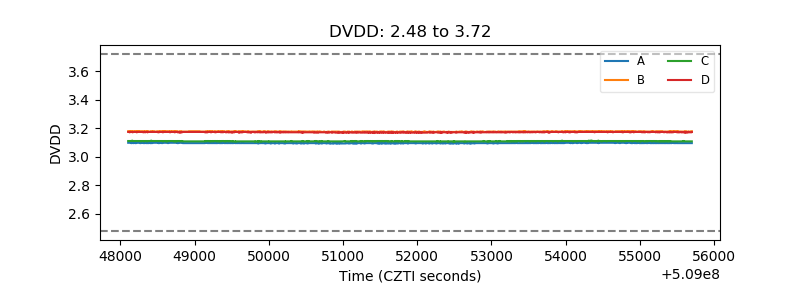 |
| Temperature 1 | 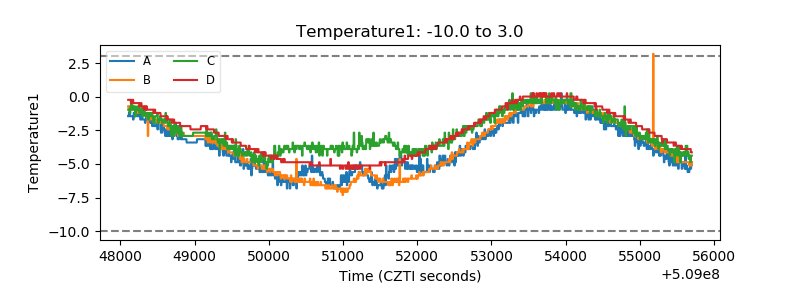 |
| Veto HV Monitor |  |
| Veto LLD | 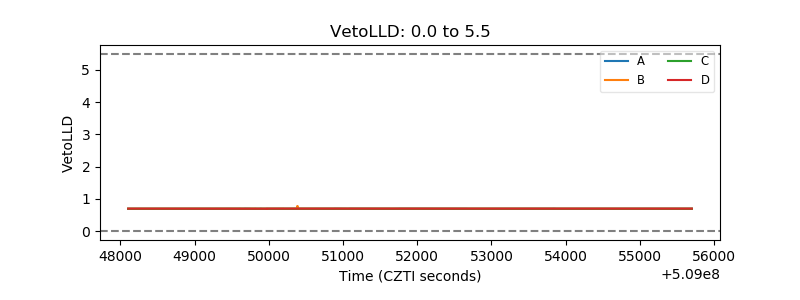 |
| Alpha Counter |  |
| _CPM_Rate | 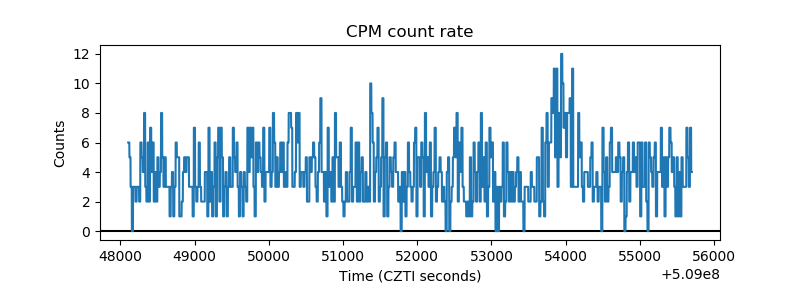 |
| CZT Counter | 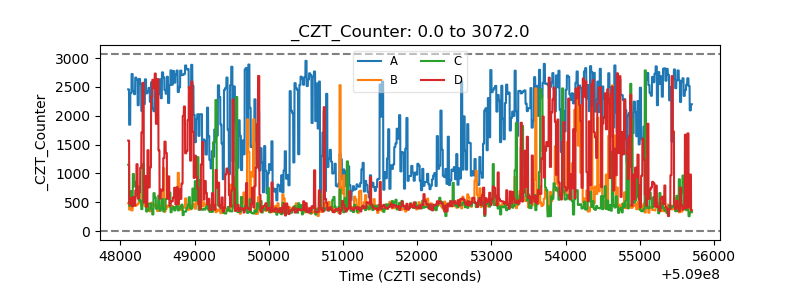 |
| +2.5 Volts monitor | 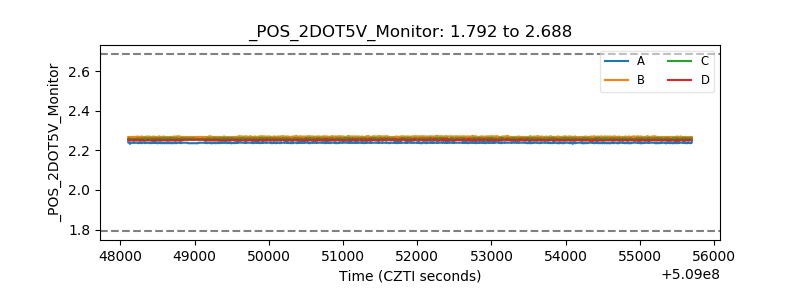 |
| +5 Volts monitor |  |
| _ROLL_ROT |  |
| _Roll_DEC |  |
| _Roll_RA |  |
| Veto Counter |  |