| Param | Original file | Final file |
|---|---|---|
| Filename | modeM0/AS1A14_083T04_9000006550_56225cztM0_level2.fits | modeM0/AS1A14_083T04_9000006550_56225cztM0_level2_quad_clean.evt |
| Size (bytes) | 2,057,417,280 | 187,476,480 |
| Size | 1.9 GB | 178.8 MB |
| Events in quadrant A | 38,707,695 | 589,688 |
| Events in quadrant B | 10,955,722 | 1,383,208 |
| Events in quadrant C | 9,171,115 | 1,273,021 |
| Events in quadrant D | 15,864,421 | 1,125,104 |
| Mode SS | |||
|---|---|---|---|
| Quadrant | BADHDUFLAG | Total packets | Discarded packets |
| A | 0 | 386 | 0 |
| B | 0 | 386 | 0 |
| C | 0 | 386 | 0 |
| D | 0 | 386 | 0 |
| Mode M9 | |||
|---|---|---|---|
| Quadrant | BADHDUFLAG | Total packets | Discarded packets |
| A | 0 | 14 | 0 |
| B | 0 | 14 | 0 |
| C | 0 | 14 | 0 |
| D | 0 | 14 | 0 |
| Mode M0 | |||
|---|---|---|---|
| Quadrant | BADHDUFLAG | Total packets | Discarded packets |
| A | 0 | 128000 | 3 |
| B | 0 | 46210 | 3 |
| C | 0 | 41555 | 3 |
| D | 0 | 60887 | 3 |
| Quadrant | Total seconds | Saturated seconds | Saturation percentage |
|---|---|---|---|
| A | 18911 | 11454 | 60.567923% |
| B | 18911 | 604 | 3.193908% |
| C | 18912 | 168 | 0.888325% |
| D | 18911 | 1851 | 9.787954% |
Noise dominated data is calculated using 1-second bins in cleaned event files. If a bin has >2000 counts, and if more than 50% of those come from <1% of pixels, then it is considered to be noise-dominated and hence unusable.
| Quadrant | # 1 sec bins | Bins with >0 counts | Bins with >2000 counts | High rate bins dominated by noise | Noise dominated (total time) | Noise dominated (detector-on time) | Marked lightcurve |
|---|---|---|---|---|---|---|---|
| A | 20717 | 19159 | 11570 | 11570 | 55.85% | 60.39% |  |
| B | 20717 | 19194 | 351 | 351 | 1.69% | 1.83% |  |
| C | 20718 | 19195 | 117 | 117 | 0.56% | 0.61% |  |
| D | 20717 | 19194 | 1912 | 1912 | 9.23% | 9.96% |  |
Top three noisy pixels from each quadrant. If the there are fewer than three noisy pixels in the level2.evt file, extra rows are filled as -1
| Pixel properties | Quadrant properties | ||||||
|---|---|---|---|---|---|---|---|
| Quadrant | DetID | PixID | Counts | Sigma | Mean | Median | Sigma |
| A | 12 | 115 | 13341438 | 38141.69 | 1401 | 1363 | 349.8 |
| A | 15 | 32 | 10419799 | 29788.19 | 1401 | 1363 | 349.8 |
| A | 8 | 176 | 8284572 | 23683.19 | 1401 | 1363 | 349.8 |
| B | 4 | 171 | 579602 | 1411.62 | 1939 | 1867 | 409.3 |
| B | 1 | 159 | 429556 | 1045.0 | 1939 | 1867 | 409.3 |
| B | 0 | 171 | 420701 | 1023.36 | 1939 | 1867 | 409.3 |
| C | 12 | 252 | 811879 | 1551.6 | 1905 | 1886 | 522.0 |
| C | 12 | 254 | 422416 | 805.55 | 1905 | 1886 | 522.0 |
| C | 6 | 223 | 137804 | 260.36 | 1905 | 1886 | 522.0 |
| D | 8 | 129 | 2646194 | 5106.7 | 1825 | 1742 | 517.8 |
| D | 6 | 239 | 1551606 | 2992.94 | 1825 | 1742 | 517.8 |
| D | 14 | 52 | 1282477 | 2473.23 | 1825 | 1742 | 517.8 |
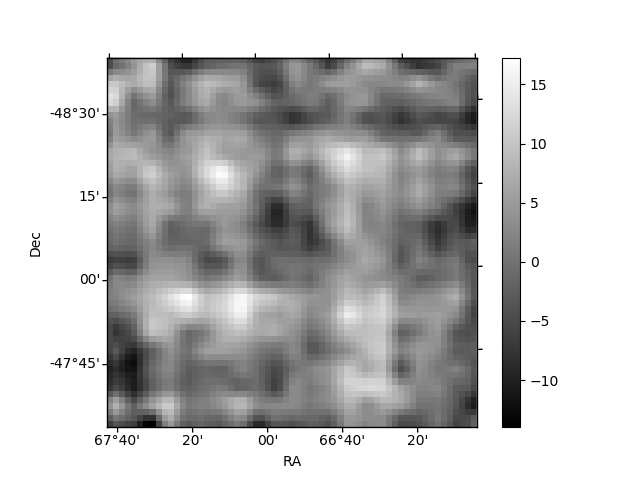
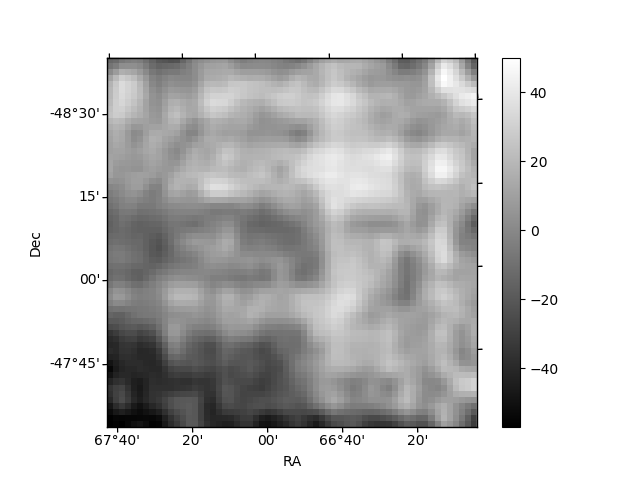
Histogram calculated using DETX and DETY for each event in the final _common_clean file
| Quadrant A |  |
 |
Quadrant B |
|---|---|---|---|
| Quadrant D |  |
 |
Quadrant C |
| Plot type | Count rate plots | Images |
|---|---|---|
| Comparison with Poisson distribution Blue bars denote a histogram of data divided into 1 sec bins. Red curve is a Poisson curve with rate = median count rate of data. |
 |
 |
| Quadrant-wise count rates Data is divided into 100 sec bins |
 |
|
| Module-wise count rates for Quadrant A Data is divided into 100 sec bins |
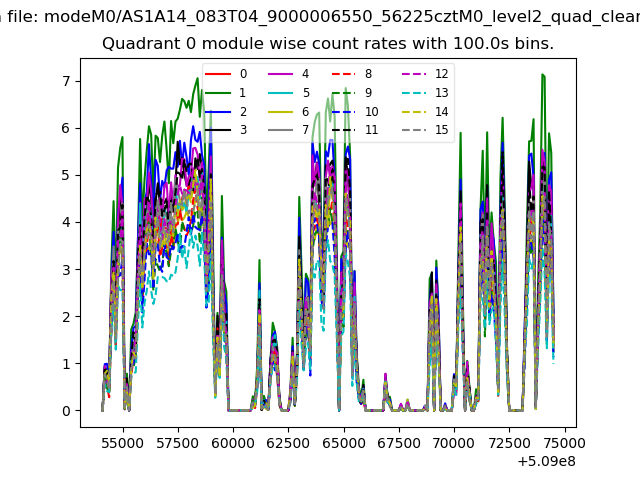 |
 |
| Module-wise count rates for Quadrant B Data is divided into 100 sec bins |
 |
 |
| Module-wise count rates for Quadrant C Data is divided into 100 sec bins |
 |
 |
| Module-wise count rates for Quadrant D Data is divided into 100 sec bins |
 |
 |
| Parameter | Plot |
|---|---|
| CZT HV Monitor |  |
| D_VDD |  |
| Temperature 1 |  |
| Veto HV Monitor |  |
| Veto LLD |  |
| Alpha Counter | 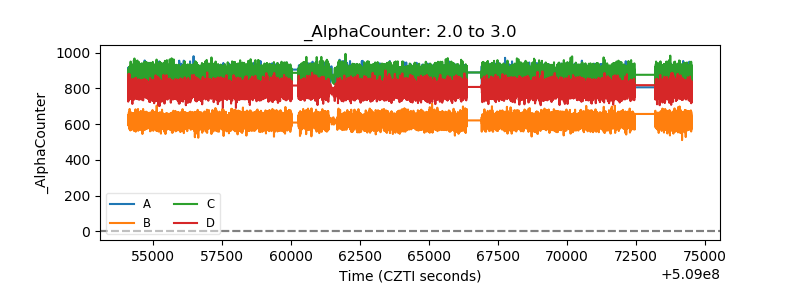 |
| _CPM_Rate |  |
| CZT Counter |  |
| +2.5 Volts monitor |  |
| +5 Volts monitor |  |
| _ROLL_ROT |  |
| _Roll_DEC |  |
| _Roll_RA |  |
| Veto Counter |  |