| Param | Original file | Final file |
|---|---|---|
| Filename | modeM0/AS1A14_083T04_9000006550_56226cztM0_level2.fits | modeM0/AS1A14_083T04_9000006550_56226cztM0_level2_quad_clean.evt |
| Size (bytes) | 669,159,360 | 79,416,000 |
| Size | 638.2 MB | 75.7 MB |
| Events in quadrant A | 11,156,367 | 344,265 |
| Events in quadrant B | 5,052,594 | 579,599 |
| Events in quadrant C | 4,069,269 | 527,899 |
| Events in quadrant D | 4,000,100 | 509,912 |
| Mode SS | |||
|---|---|---|---|
| Quadrant | BADHDUFLAG | Total packets | Discarded packets |
| A | 0 | 130 | 0 |
| B | 0 | 130 | 0 |
| C | 0 | 130 | 0 |
| D | 0 | 130 | 0 |
| Mode M9 | |||
|---|---|---|---|
| Quadrant | BADHDUFLAG | Total packets | Discarded packets |
| A | 0 | 8 | 0 |
| B | 0 | 8 | 0 |
| C | 0 | 8 | 0 |
| D | 0 | 8 | 0 |
| Mode M0 | |||
|---|---|---|---|
| Quadrant | BADHDUFLAG | Total packets | Discarded packets |
| A | 0 | 37532 | 1 |
| B | 0 | 19368 | 1 |
| C | 0 | 16825 | 1 |
| D | 0 | 16474 | 1 |
| Quadrant | Total seconds | Saturated seconds | Saturation percentage |
|---|---|---|---|
| A | 6340 | 2771 | 43.706625% |
| B | 6340 | 694 | 10.946372% |
| C | 6340 | 471 | 7.429022% |
| D | 6340 | 234 | 3.690852% |
Noise dominated data is calculated using 1-second bins in cleaned event files. If a bin has >2000 counts, and if more than 50% of those come from <1% of pixels, then it is considered to be noise-dominated and hence unusable.
| Quadrant | # 1 sec bins | Bins with >0 counts | Bins with >2000 counts | High rate bins dominated by noise | Noise dominated (total time) | Noise dominated (detector-on time) | Marked lightcurve |
|---|---|---|---|---|---|---|---|
| A | 7185 | 6341 | 2785 | 2785 | 38.76% | 43.92% | 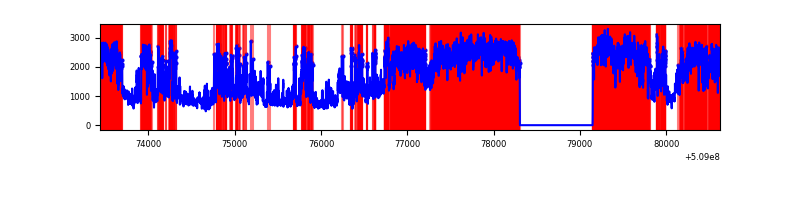 |
| B | 7185 | 6341 | 499 | 499 | 6.95% | 7.87% | 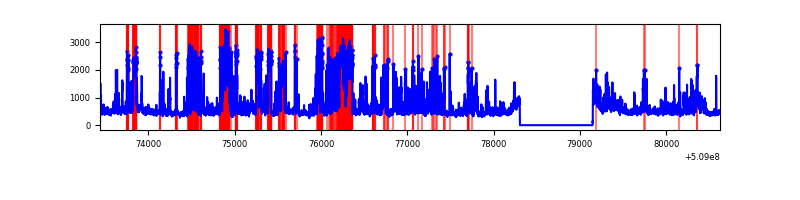 |
| C | 7185 | 6341 | 502 | 502 | 6.99% | 7.92% | 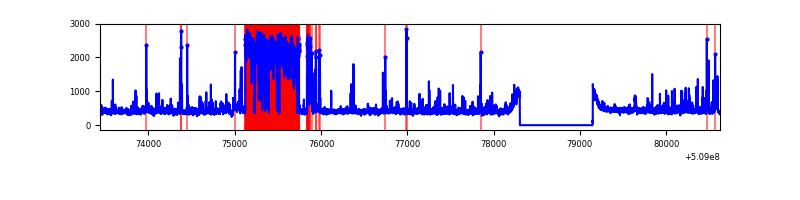 |
| D | 7185 | 6341 | 196 | 196 | 2.73% | 3.09% | 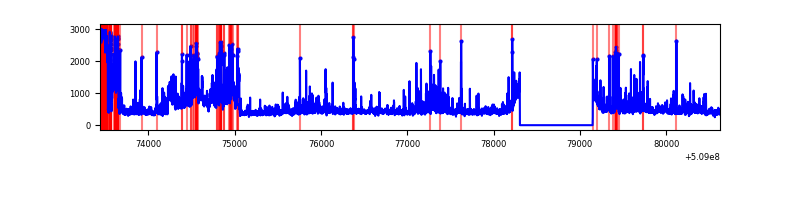 |
Top three noisy pixels from each quadrant. If the there are fewer than three noisy pixels in the level2.evt file, extra rows are filled as -1
| Pixel properties | Quadrant properties | ||||||
|---|---|---|---|---|---|---|---|
| Quadrant | DetID | PixID | Counts | Sigma | Mean | Median | Sigma |
| A | 15 | 32 | 2776926 | 20456.81 | 535 | 520 | 135.7 |
| A | 12 | 115 | 2771713 | 20418.4 | 535 | 520 | 135.7 |
| A | 8 | 176 | 2530882 | 18643.93 | 535 | 520 | 135.7 |
| B | 4 | 171 | 656570 | 4883.93 | 634 | 611 | 134.3 |
| B | 1 | 255 | 630086 | 4686.74 | 634 | 611 | 134.3 |
| B | 5 | 185 | 565345 | 4204.71 | 634 | 611 | 134.3 |
| C | 9 | 38 | 1253488 | 7115.13 | 644 | 638 | 176.1 |
| C | 12 | 252 | 148496 | 839.71 | 644 | 638 | 176.1 |
| C | 12 | 254 | 85764 | 483.44 | 644 | 638 | 176.1 |
| D | 8 | 129 | 761426 | 4209.52 | 635 | 605 | 180.7 |
| D | 6 | 239 | 324126 | 1790.0 | 635 | 605 | 180.7 |
| D | 2 | 120 | 149779 | 825.36 | 635 | 605 | 180.7 |
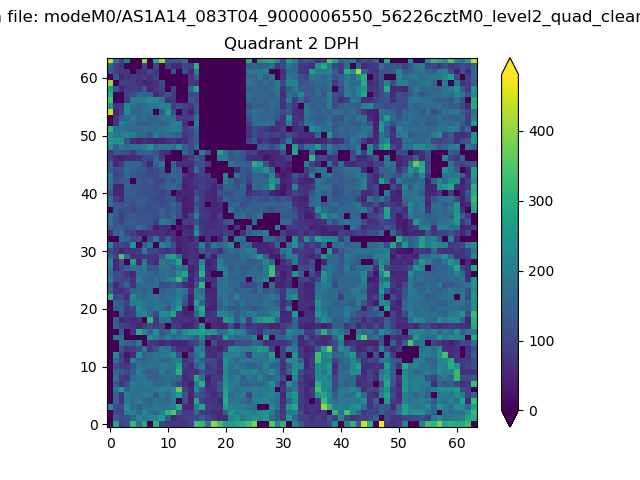
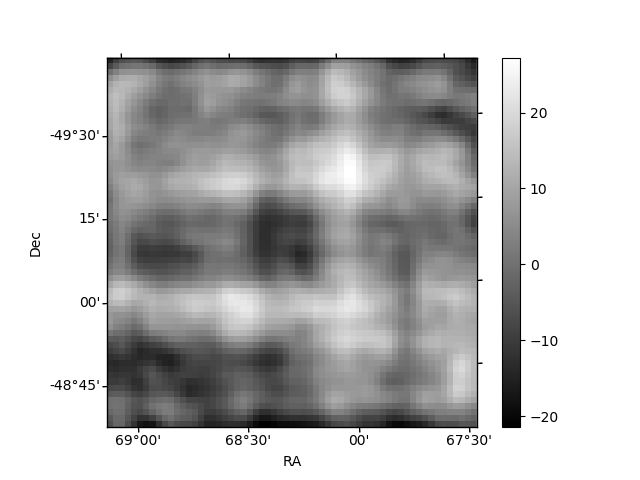
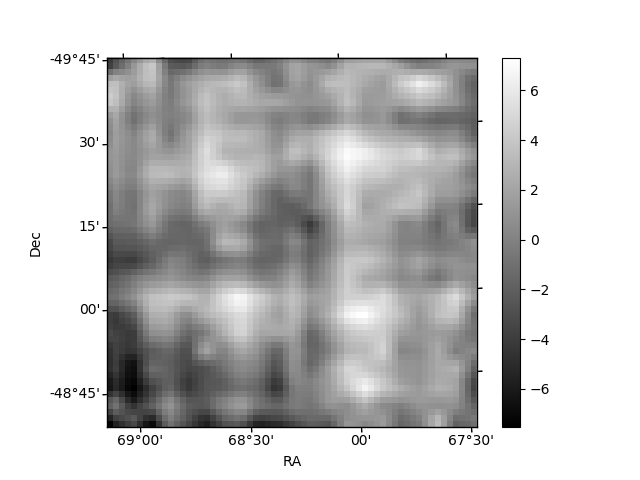
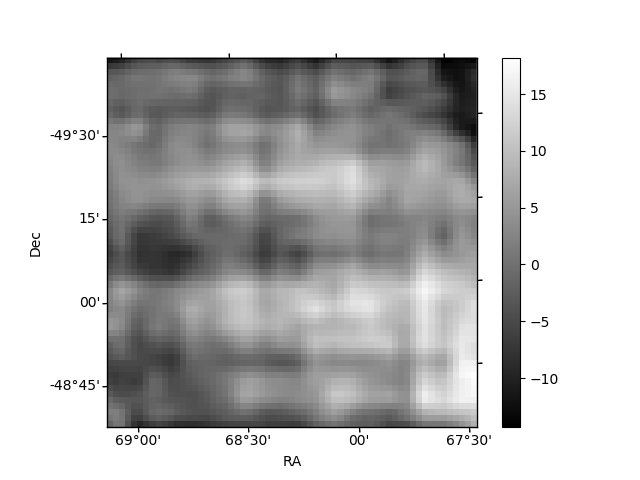
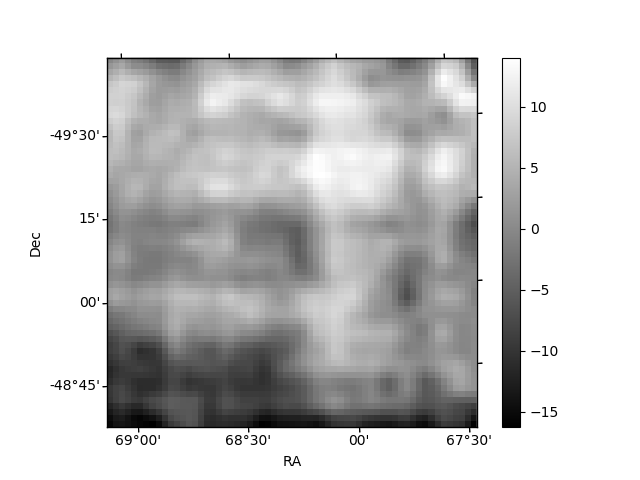
Histogram calculated using DETX and DETY for each event in the final _common_clean file
| Quadrant A | 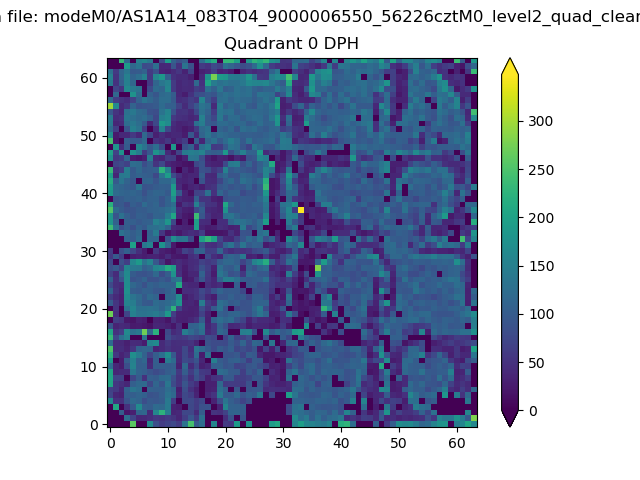 |
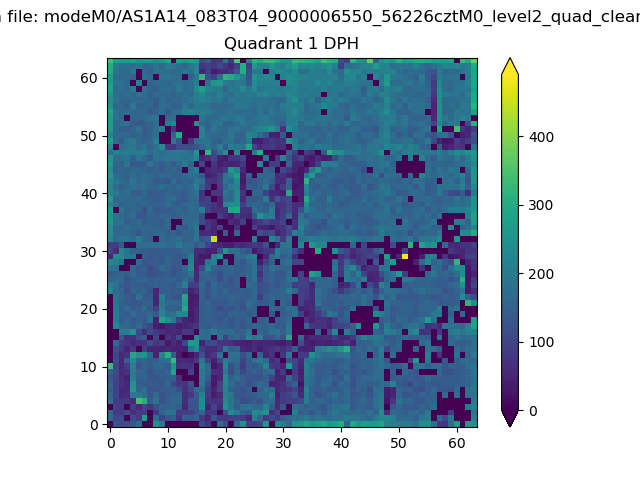 |
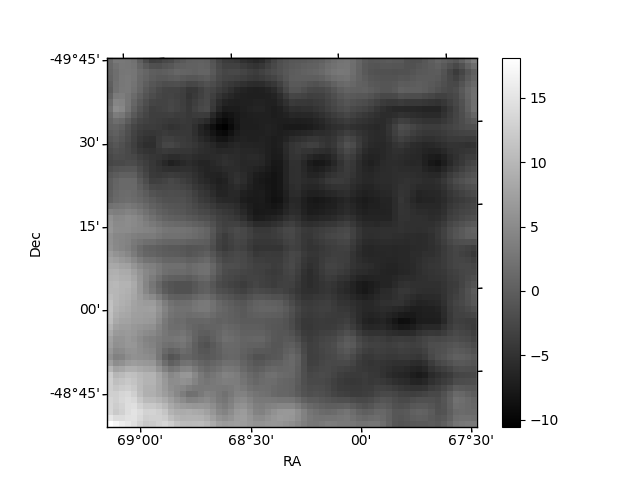
Quadrant B |
|---|---|---|---|
| Quadrant D | 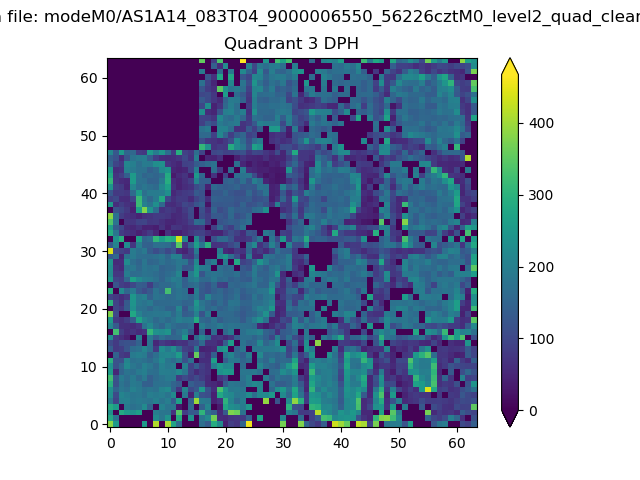 |
 |
Quadrant C |
| Plot type | Count rate plots | Images |
|---|---|---|
| Comparison with Poisson distribution Blue bars denote a histogram of data divided into 1 sec bins. Red curve is a Poisson curve with rate = median count rate of data. |
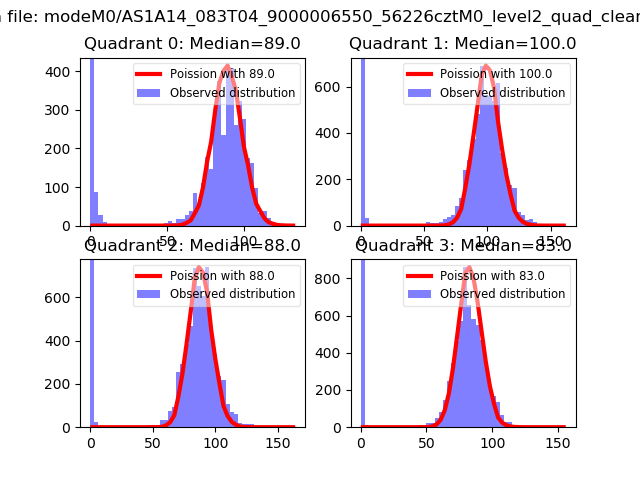 |
 |
| Quadrant-wise count rates Data is divided into 100 sec bins |
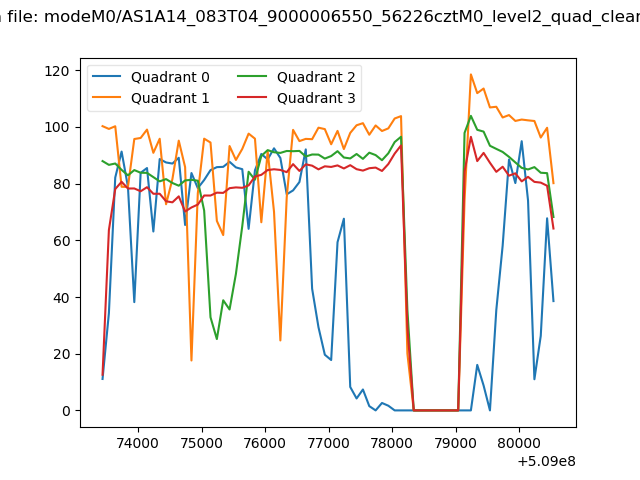 |
|
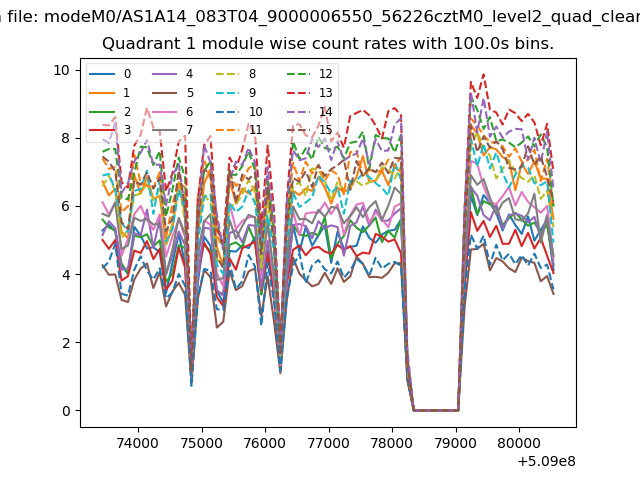
| Module-wise count rates for Quadrant A Data is divided into 100 sec bins |
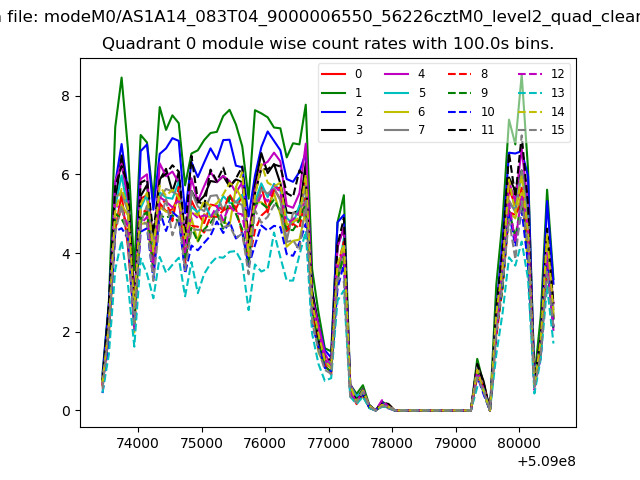 |
 |
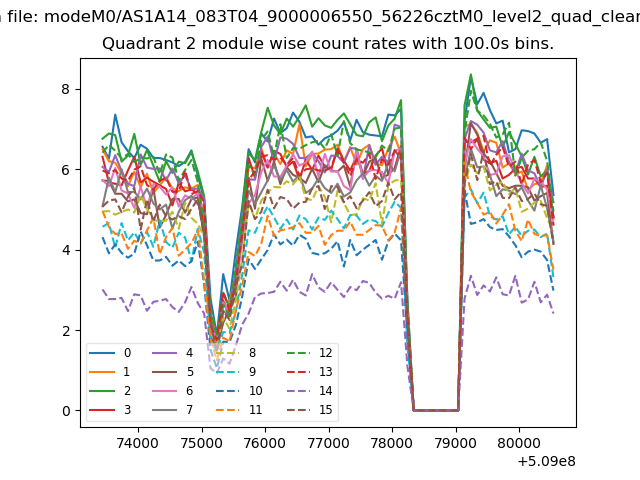
| Module-wise count rates for Quadrant B Data is divided into 100 sec bins |
 |
 |
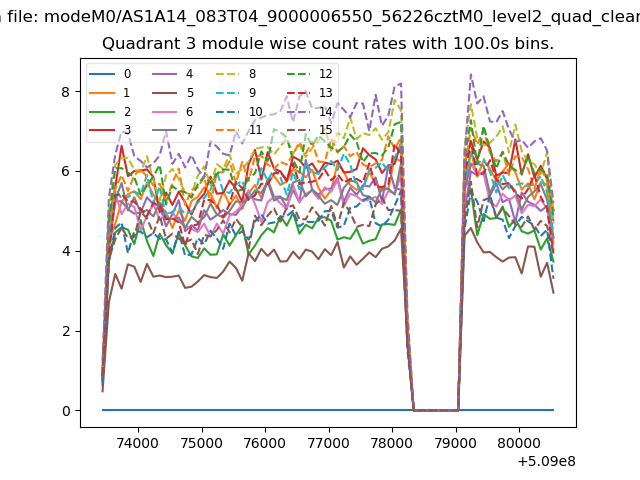
| Module-wise count rates for Quadrant C Data is divided into 100 sec bins |
 |
 |
| Module-wise count rates for Quadrant D Data is divided into 100 sec bins |
 |
 |
| Parameter | Plot |
|---|---|
| CZT HV Monitor | 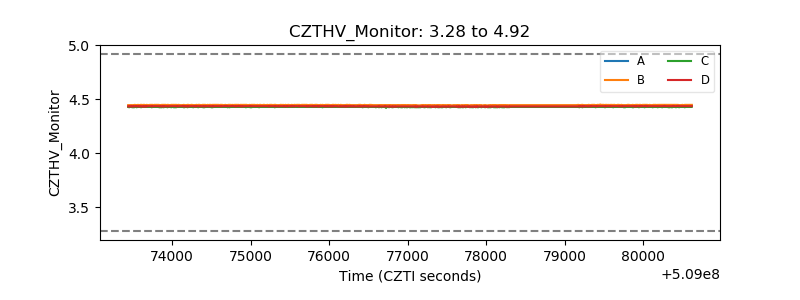 |
| D_VDD | 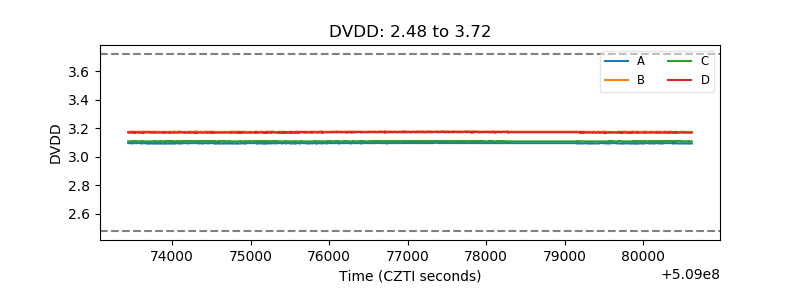 |
| Temperature 1 | 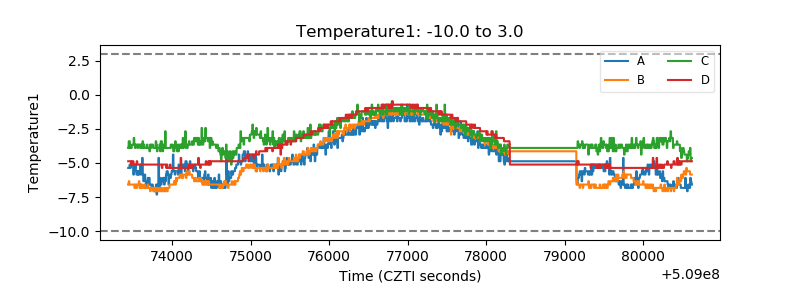 |
| Veto HV Monitor | 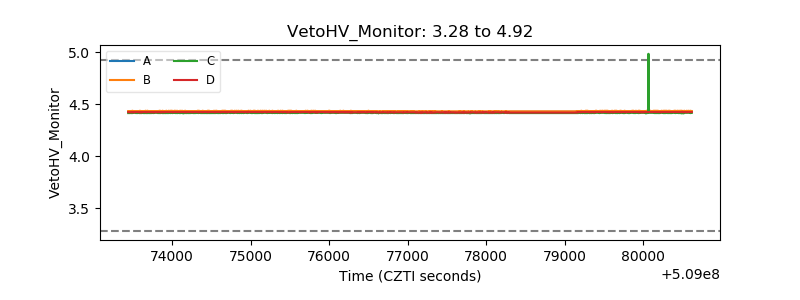 |
| Veto LLD | 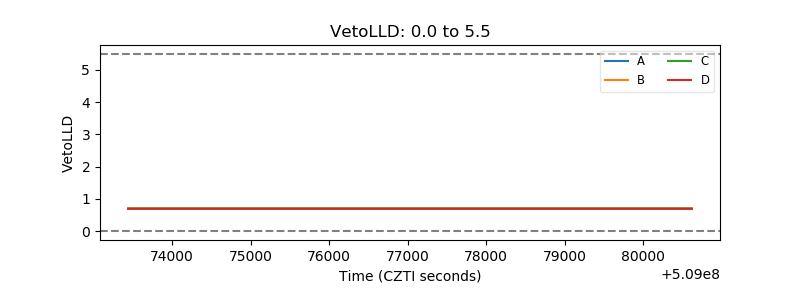 |
| Alpha Counter | 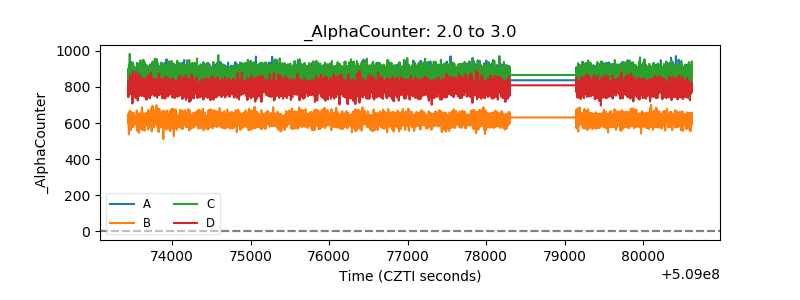 |
| _CPM_Rate | 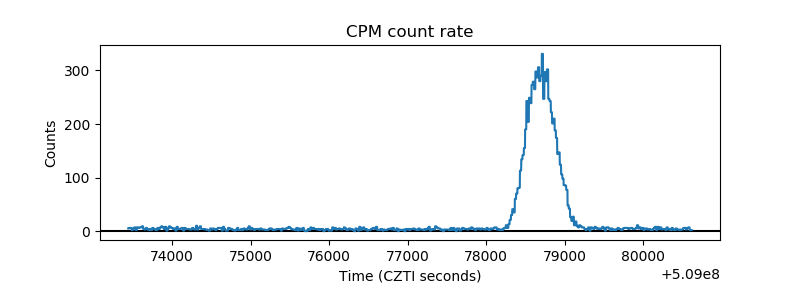 |
| CZT Counter | 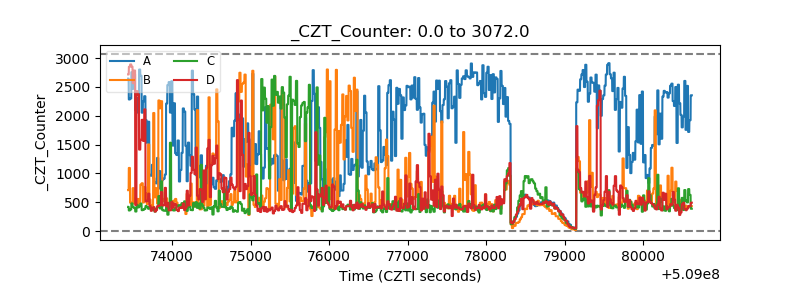 |
| +2.5 Volts monitor | 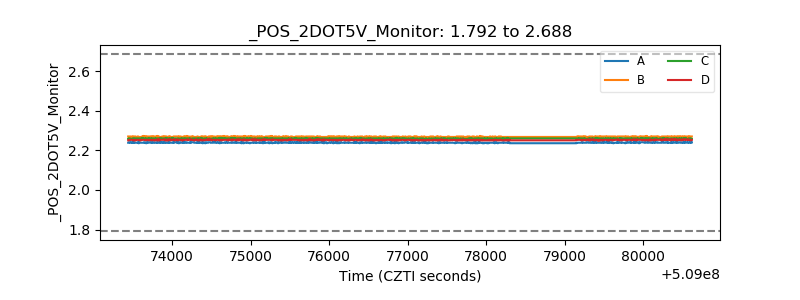 |
| +5 Volts monitor | 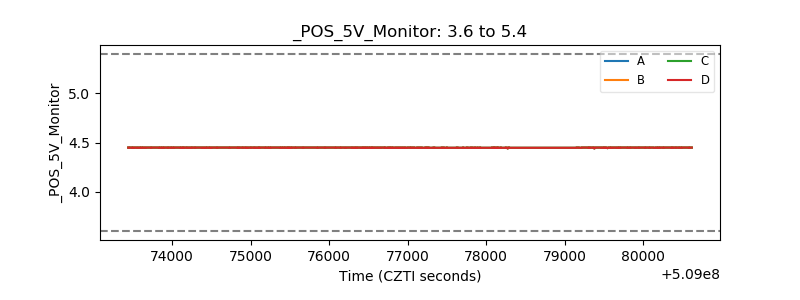 |
| _ROLL_ROT | 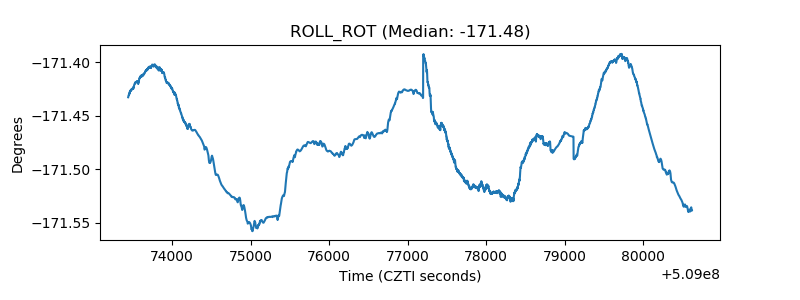 |
| _Roll_DEC | 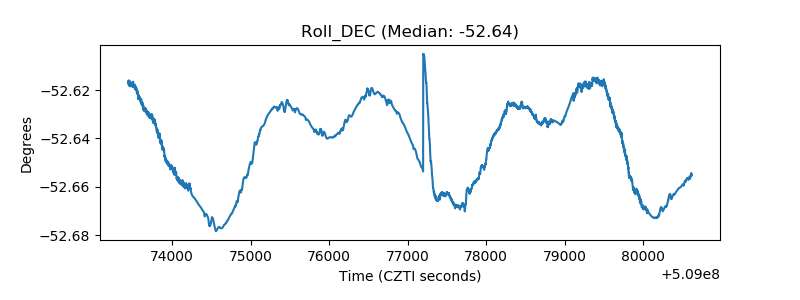 |
| _Roll_RA | 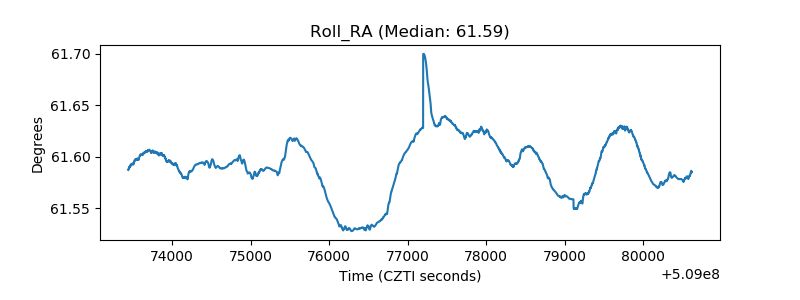 |
| Veto Counter | 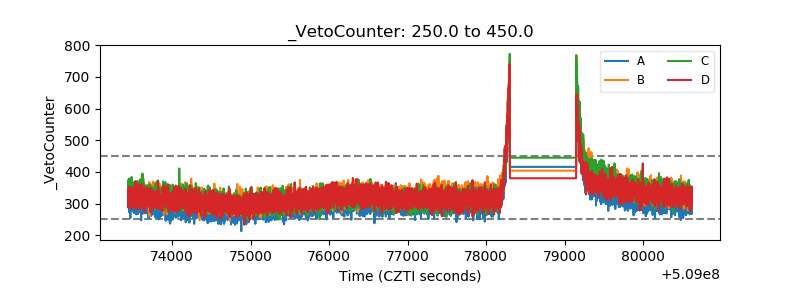 |