| Param | Original file | Final file |
|---|---|---|
| Filename | modeM0/AS1A14_083T04_9000006550_56230cztM0_level2.fits | modeM0/AS1A14_083T04_9000006550_56230cztM0_level2_quad_clean.evt |
| Size (bytes) | 751,199,040 | 80,334,720 |
| Size | 716.4 MB | 76.6 MB |
| Events in quadrant A | 15,196,685 | 138,488 |
| Events in quadrant B | 3,651,198 | 695,514 |
| Events in quadrant C | 4,383,256 | 585,548 |
| Events in quadrant D | 4,080,207 | 567,479 |
| Mode SS | |||
|---|---|---|---|
| Quadrant | BADHDUFLAG | Total packets | Discarded packets |
| A | 0 | 130 | 0 |
| B | 0 | 130 | 0 |
| C | 0 | 130 | 0 |
| D | 0 | 130 | 0 |
| Mode M9 | |||
|---|---|---|---|
| Quadrant | BADHDUFLAG | Total packets | Discarded packets |
| A | 0 | 11 | 0 |
| B | 0 | 11 | 0 |
| C | 0 | 11 | 0 |
| D | 0 | 11 | 0 |
| Mode M0 | |||
|---|---|---|---|
| Quadrant | BADHDUFLAG | Total packets | Discarded packets |
| A | 0 | 49481 | 7 |
| B | 0 | 15254 | 1 |
| C | 0 | 17539 | 1 |
| D | 0 | 16455 | 1 |
| Quadrant | Total seconds | Saturated seconds | Saturation percentage |
|---|---|---|---|
| A | 6382 | 5287 | 82.842369% |
| B | 6383 | 156 | 2.443992% |
| C | 6383 | 497 | 7.786307% |
| D | 6383 | 237 | 3.712988% |
Noise dominated data is calculated using 1-second bins in cleaned event files. If a bin has >2000 counts, and if more than 50% of those come from <1% of pixels, then it is considered to be noise-dominated and hence unusable.
| Quadrant | # 1 sec bins | Bins with >0 counts | Bins with >2000 counts | High rate bins dominated by noise | Noise dominated (total time) | Noise dominated (detector-on time) | Marked lightcurve |
|---|---|---|---|---|---|---|---|
| A | 7517 | 6383 | 5188 | 5188 | 69.02% | 81.28% |  |
| B | 7518 | 6384 | 25 | 25 | 0.33% | 0.39% | 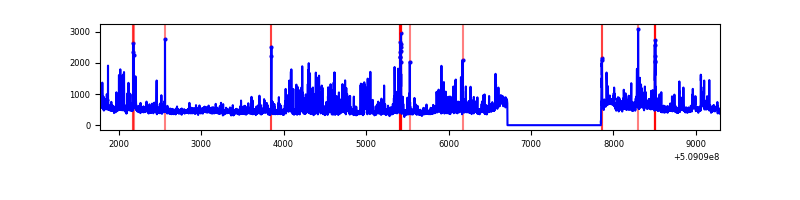 |
| C | 7518 | 6384 | 385 | 385 | 5.12% | 6.03% |  |
| D | 7518 | 6384 | 159 | 159 | 2.11% | 2.49% |  |
Top three noisy pixels from each quadrant. If the there are fewer than three noisy pixels in the level2.evt file, extra rows are filled as -1
| Pixel properties | Quadrant properties | ||||||
|---|---|---|---|---|---|---|---|
| Quadrant | DetID | PixID | Counts | Sigma | Mean | Median | Sigma |
| A | 12 | 115 | 9400536 | 93463.49 | 402 | 391 | 100.6 |
| A | 15 | 32 | 1849953 | 18389.77 | 402 | 391 | 100.6 |
| A | 8 | 176 | 1797382 | 17867.07 | 402 | 391 | 100.6 |
| B | 4 | 171 | 417960 | 2778.2 | 703 | 676 | 150.2 |
| B | 1 | 255 | 109049 | 721.53 | 703 | 676 | 150.2 |
| B | 0 | 63 | 93330 | 616.87 | 703 | 676 | 150.2 |
| C | 9 | 237 | 738000 | 3989.71 | 677 | 670 | 184.8 |
| C | 5 | 250 | 272668 | 1471.78 | 677 | 670 | 184.8 |
| C | 15 | 198 | 272317 | 1469.89 | 677 | 670 | 184.8 |
| D | 2 | 249 | 282925 | 1432.24 | 688 | 657 | 197.1 |
| D | 8 | 129 | 276772 | 1401.02 | 688 | 657 | 197.1 |
| D | 7 | 96 | 226615 | 1146.52 | 688 | 657 | 197.1 |
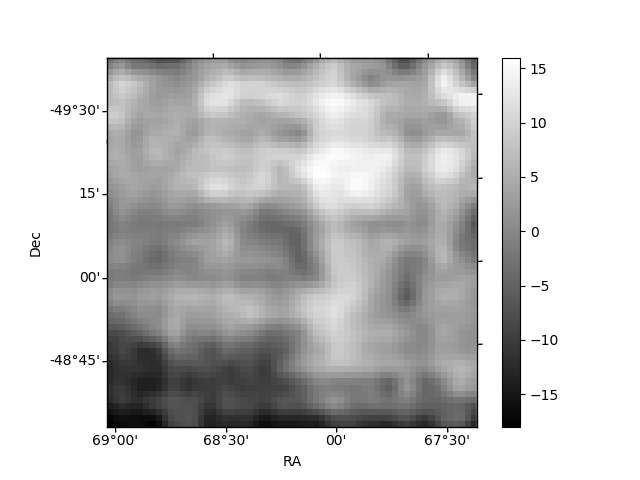
Histogram calculated using DETX and DETY for each event in the final _common_clean file
| Quadrant A | 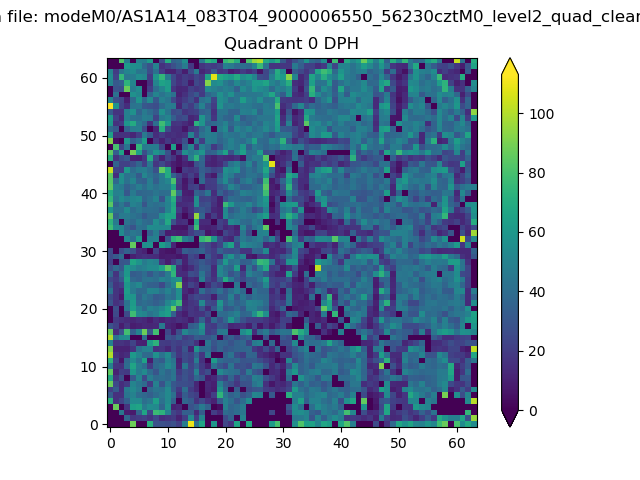 |
 |
Quadrant B |
|---|---|---|---|
| Quadrant D |  |
 |
Quadrant C |
| Plot type | Count rate plots | Images |
|---|---|---|
| Comparison with Poisson distribution Blue bars denote a histogram of data divided into 1 sec bins. Red curve is a Poisson curve with rate = median count rate of data. |
 |
 |
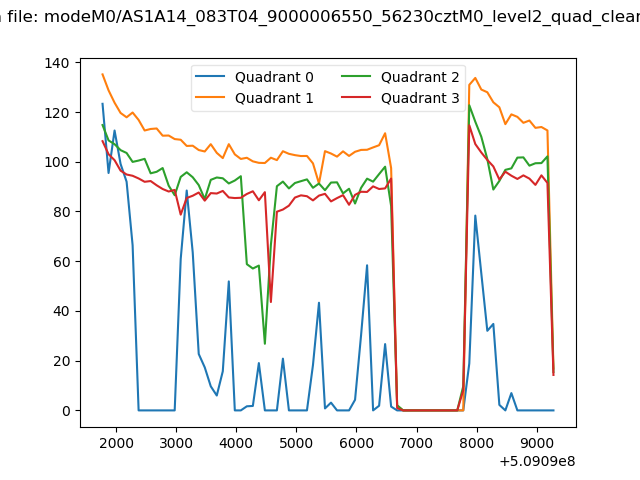
| Quadrant-wise count rates Data is divided into 100 sec bins |
 |
|
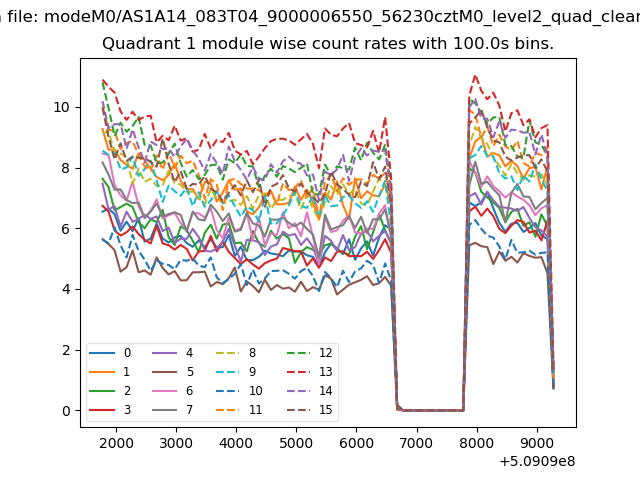
| Module-wise count rates for Quadrant A Data is divided into 100 sec bins |
 |
 |
| Module-wise count rates for Quadrant B Data is divided into 100 sec bins |
 |
 |
| Module-wise count rates for Quadrant C Data is divided into 100 sec bins |
 |
 |
| Module-wise count rates for Quadrant D Data is divided into 100 sec bins |
 |
 |
| Parameter | Plot |
|---|---|
| CZT HV Monitor | 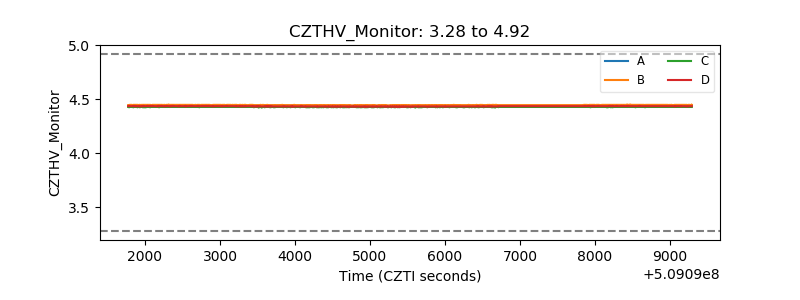 |
| D_VDD |  |
| Temperature 1 | 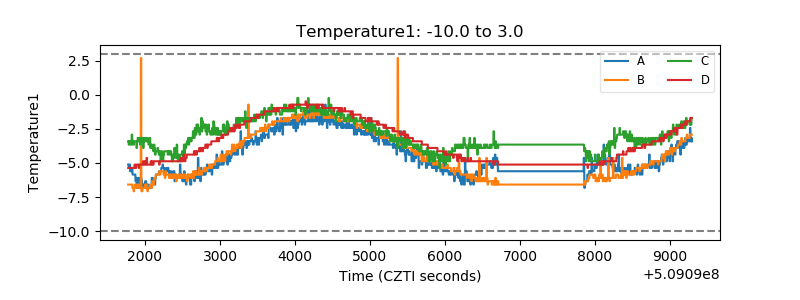 |
| Veto HV Monitor |  |
| Veto LLD |  |
| Alpha Counter |  |
| _CPM_Rate |  |
| CZT Counter | 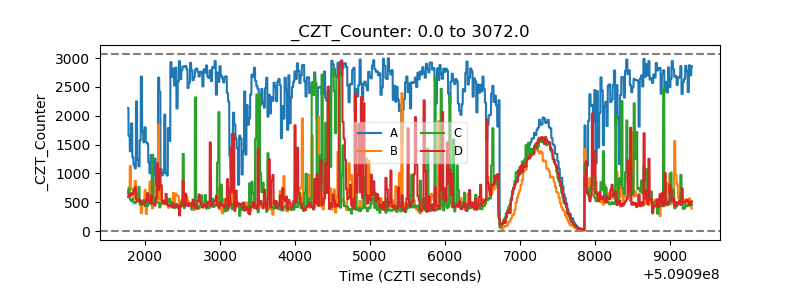 |
| +2.5 Volts monitor |  |
| +5 Volts monitor |  |
| _ROLL_ROT |  |
| _Roll_DEC |  |
| _Roll_RA | 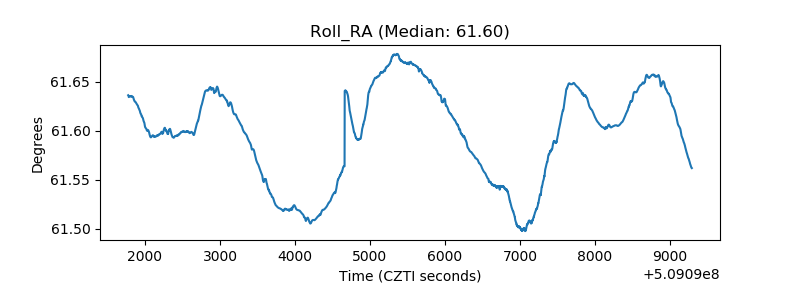 |
| Veto Counter |  |