| Param | Original file | Final file |
|---|---|---|
| Filename | modeM0/AS1A14_083T04_9000006550_56231cztM0_level2.fits | modeM0/AS1A14_083T04_9000006550_56231cztM0_level2_quad_clean.evt |
| Size (bytes) | 767,810,880 | 81,535,680 |
| Size | 732.2 MB | 77.8 MB |
| Events in quadrant A | 15,315,747 | 129,660 |
| Events in quadrant B | 4,005,631 | 694,902 |
| Events in quadrant C | 4,209,335 | 619,091 |
| Events in quadrant D | 4,386,597 | 572,170 |
| Mode SS | |||
|---|---|---|---|
| Quadrant | BADHDUFLAG | Total packets | Discarded packets |
| A | 0 | 132 | 0 |
| B | 0 | 132 | 0 |
| C | 0 | 132 | 0 |
| D | 0 | 132 | 0 |
| Mode M9 | |||
|---|---|---|---|
| Quadrant | BADHDUFLAG | Total packets | Discarded packets |
| A | 0 | 13 | 0 |
| B | 0 | 14 | 0 |
| C | 0 | 14 | 0 |
| D | 0 | 14 | 0 |
| Mode M0 | |||
|---|---|---|---|
| Quadrant | BADHDUFLAG | Total packets | Discarded packets |
| A | 0 | 49902 | 2 |
| B | 0 | 16353 | 2 |
| C | 0 | 17014 | 2 |
| D | 0 | 17533 | 2 |
| Quadrant | Total seconds | Saturated seconds | Saturation percentage |
|---|---|---|---|
| A | 6494 | 5531 | 85.170927% |
| B | 6494 | 304 | 4.681244% |
| C | 6494 | 325 | 5.004620% |
| D | 6494 | 375 | 5.774561% |
Noise dominated data is calculated using 1-second bins in cleaned event files. If a bin has >2000 counts, and if more than 50% of those come from <1% of pixels, then it is considered to be noise-dominated and hence unusable.
| Quadrant | # 1 sec bins | Bins with >0 counts | Bins with >2000 counts | High rate bins dominated by noise | Noise dominated (total time) | Noise dominated (detector-on time) | Marked lightcurve |
|---|---|---|---|---|---|---|---|
| A | 7624 | 6495 | 5281 | 5281 | 69.27% | 81.31% |  |
| B | 7624 | 6495 | 75 | 75 | 0.98% | 1.15% | 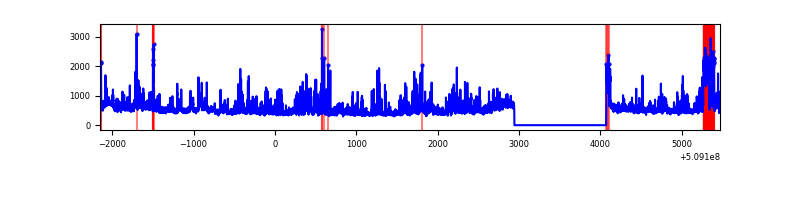 |
| C | 7624 | 6495 | 214 | 214 | 2.81% | 3.29% |  |
| D | 7624 | 6495 | 250 | 250 | 3.28% | 3.85% |  |
Top three noisy pixels from each quadrant. If the there are fewer than three noisy pixels in the level2.evt file, extra rows are filled as -1
| Pixel properties | Quadrant properties | ||||||
|---|---|---|---|---|---|---|---|
| Quadrant | DetID | PixID | Counts | Sigma | Mean | Median | Sigma |
| A | 12 | 115 | 8847643 | 82381.82 | 433 | 423 | 107.4 |
| A | 15 | 32 | 3067205 | 28556.66 | 433 | 423 | 107.4 |
| A | 8 | 176 | 1221721 | 11372.24 | 433 | 423 | 107.4 |
| B | 4 | 171 | 459972 | 3007.45 | 718 | 691 | 152.7 |
| B | 5 | 185 | 241627 | 1577.69 | 718 | 691 | 152.7 |
| B | 1 | 255 | 107313 | 698.18 | 718 | 691 | 152.7 |
| C | 15 | 198 | 949607 | 4965.21 | 704 | 696 | 191.1 |
| C | 6 | 223 | 169347 | 882.47 | 704 | 696 | 191.1 |
| C | 5 | 250 | 162194 | 845.04 | 704 | 696 | 191.1 |
| D | 2 | 249 | 633576 | 3182.9 | 702 | 668 | 198.8 |
| D | 8 | 129 | 257108 | 1289.64 | 702 | 668 | 198.8 |
| D | 7 | 96 | 219261 | 1099.31 | 702 | 668 | 198.8 |
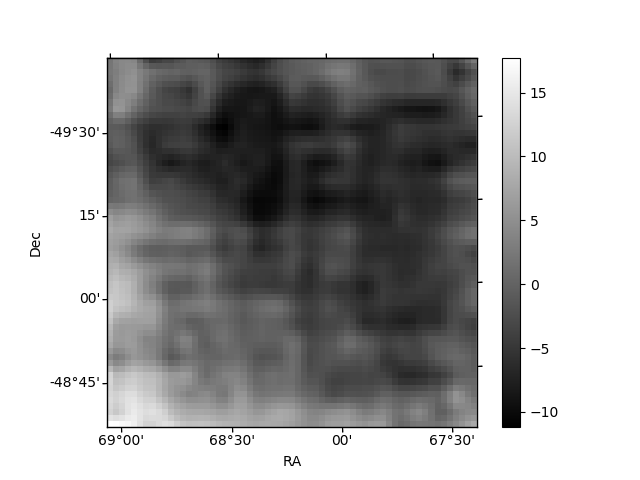
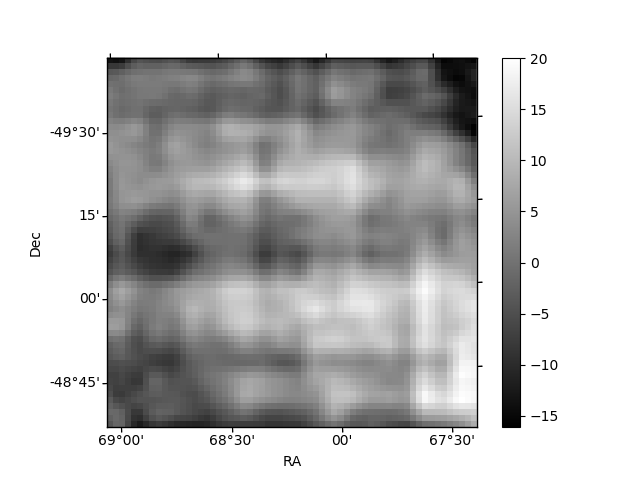
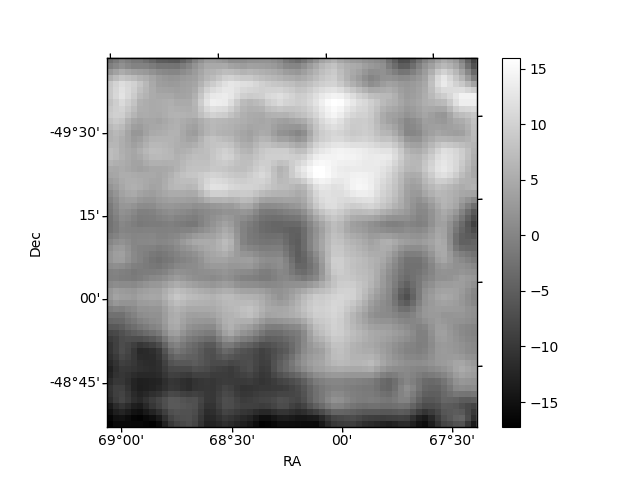
Histogram calculated using DETX and DETY for each event in the final _common_clean file
| Quadrant A | 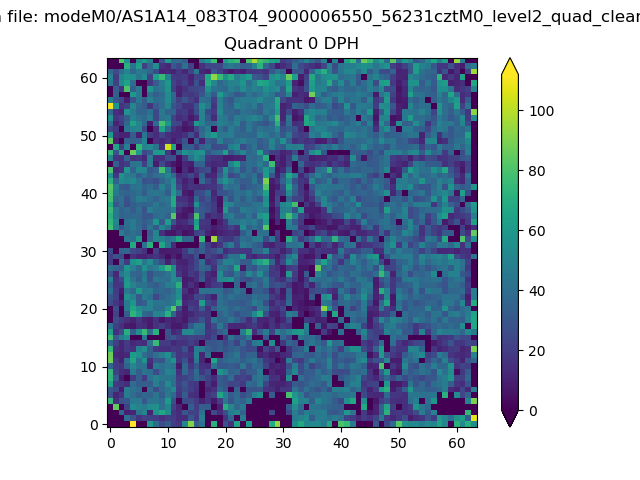 |
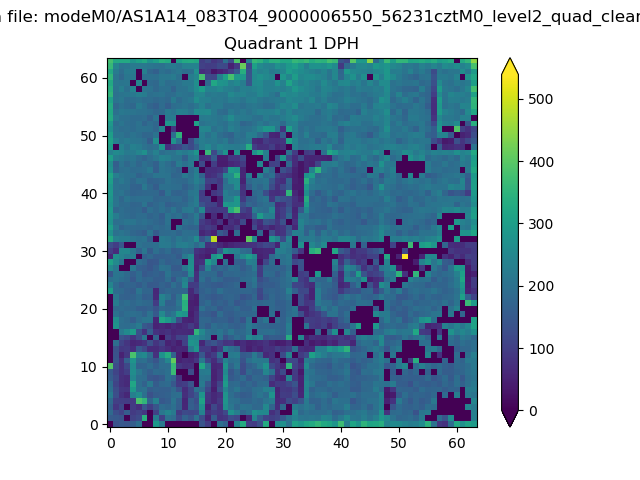 |
Quadrant B |
|---|---|---|---|
| Quadrant D | 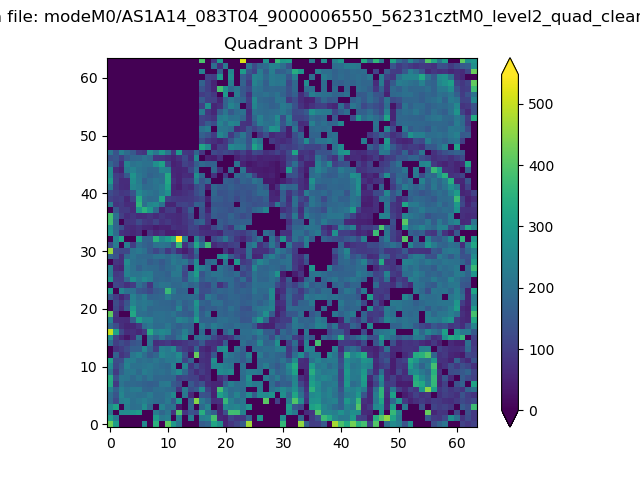 |
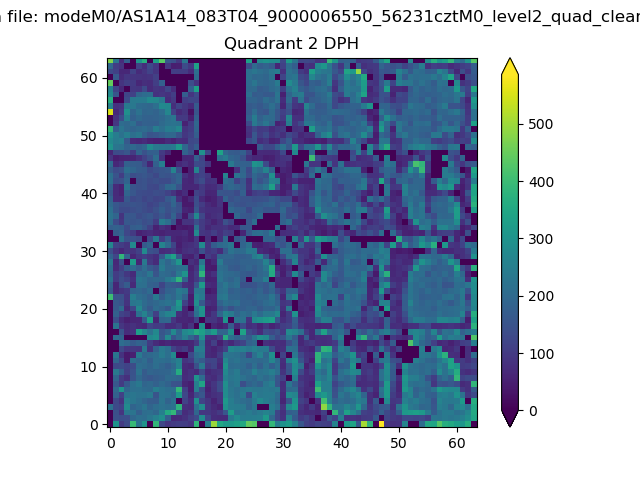 |
Quadrant C |
| Plot type | Count rate plots | Images |
|---|---|---|
| Comparison with Poisson distribution Blue bars denote a histogram of data divided into 1 sec bins. Red curve is a Poisson curve with rate = median count rate of data. |
 |
 |
| Quadrant-wise count rates Data is divided into 100 sec bins |
 |
|
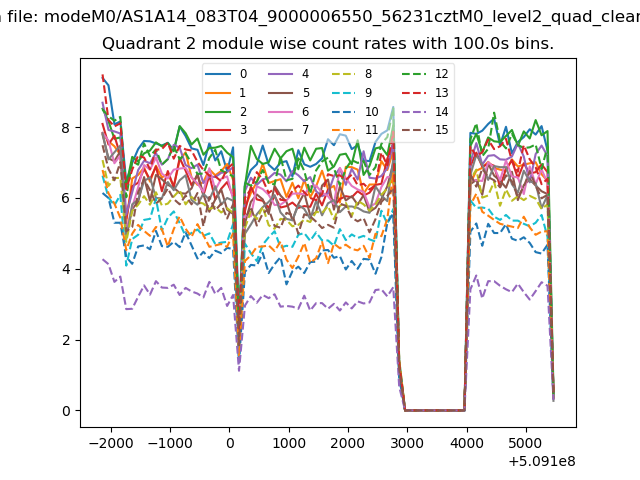
| Module-wise count rates for Quadrant A Data is divided into 100 sec bins |
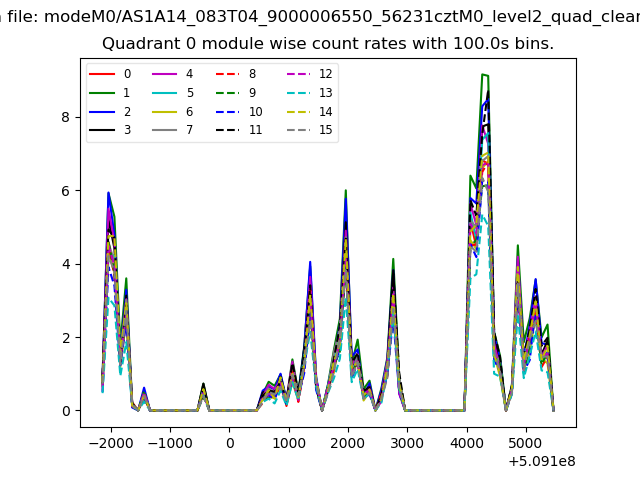 |
 |
| Module-wise count rates for Quadrant B Data is divided into 100 sec bins |
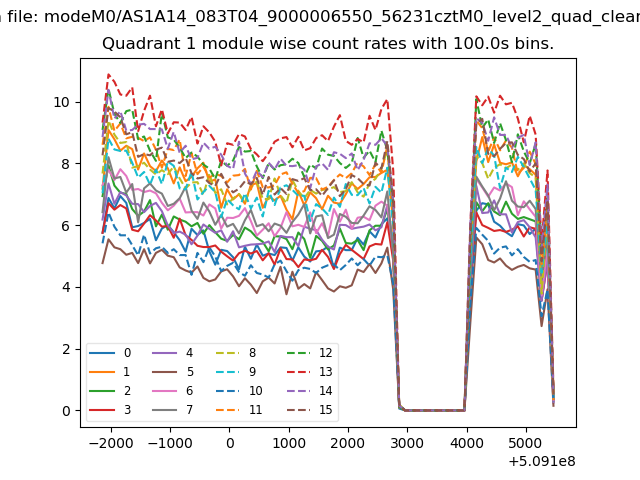 |
 |
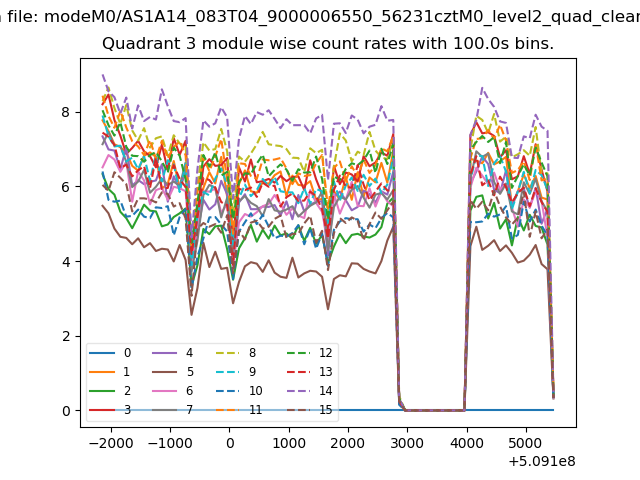
| Module-wise count rates for Quadrant C Data is divided into 100 sec bins |
 |
 |
| Module-wise count rates for Quadrant D Data is divided into 100 sec bins |
 |
 |
| Parameter | Plot |
|---|---|
| CZT HV Monitor |  |
| D_VDD |  |
| Temperature 1 | 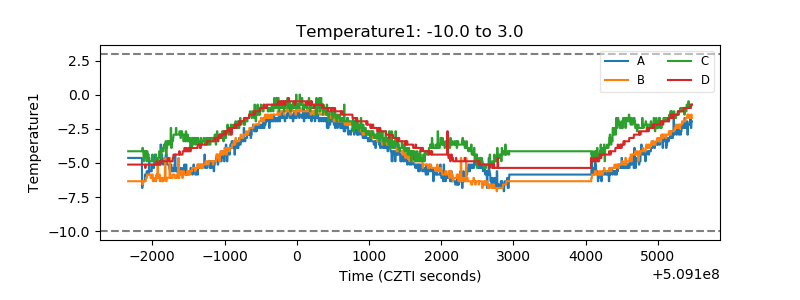 |
| Veto HV Monitor | 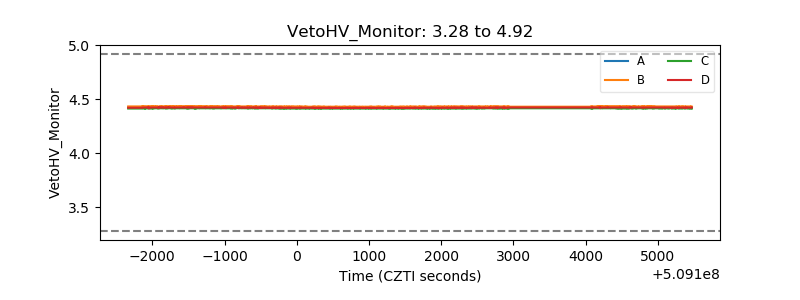 |
| Veto LLD |  |
| Alpha Counter |  |
| _CPM_Rate |  |
| CZT Counter | 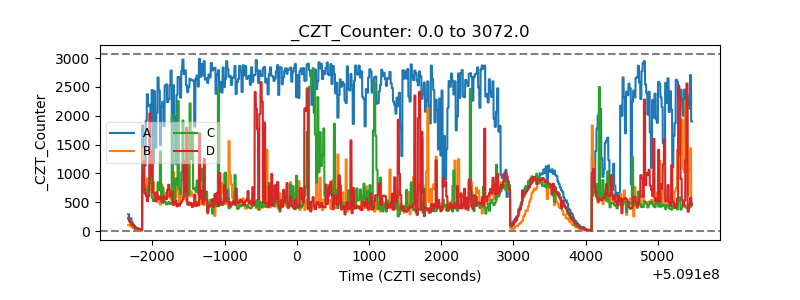 |
| +2.5 Volts monitor | 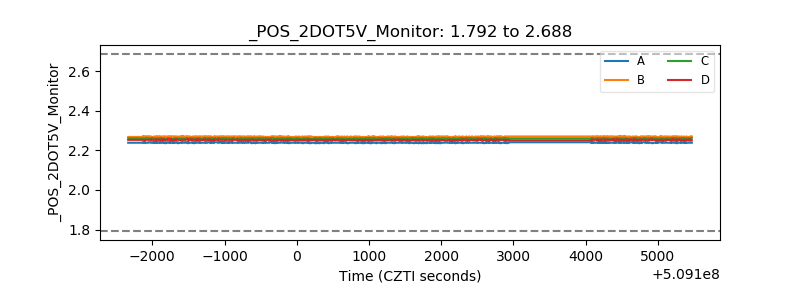 |
| +5 Volts monitor |  |
| _ROLL_ROT | 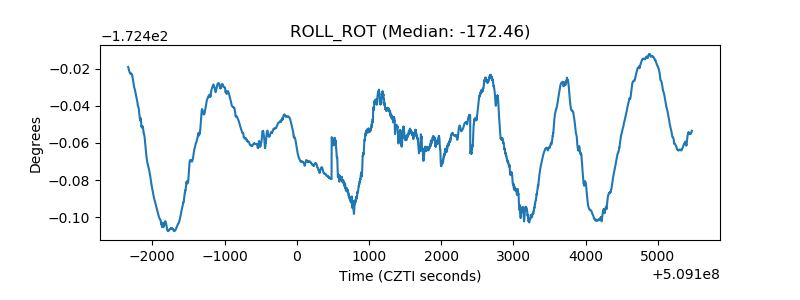 |
| _Roll_DEC | 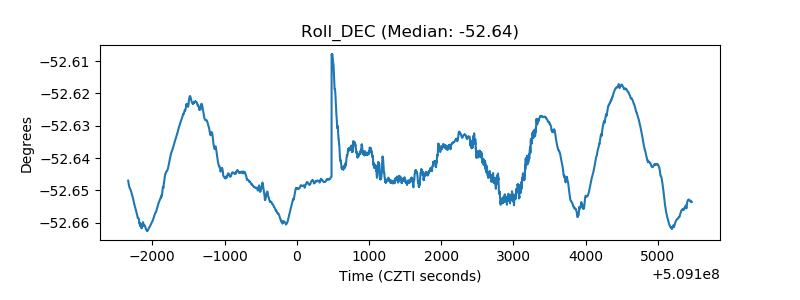 |
| _Roll_RA | 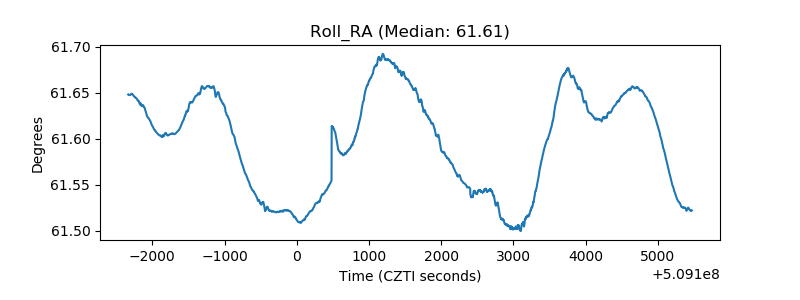 |
| Veto Counter | 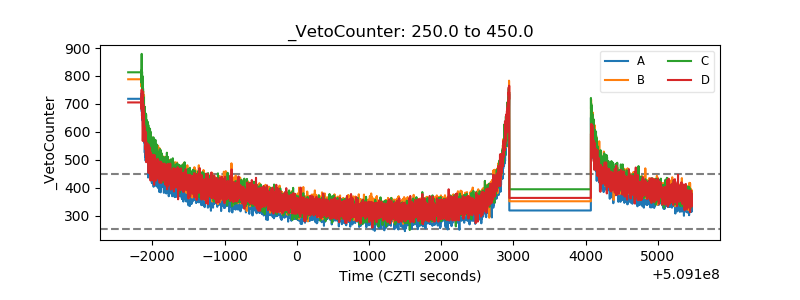 |