| Param | Original file | Final file |
|---|---|---|
| Filename | modeM0/AS1A14_083T04_9000006550_56232cztM0_level2.fits | modeM0/AS1A14_083T04_9000006550_56232cztM0_level2_quad_clean.evt |
| Size (bytes) | 766,180,800 | 91,975,680 |
| Size | 730.7 MB | 87.7 MB |
| Events in quadrant A | 12,628,251 | 387,544 |
| Events in quadrant B | 4,983,794 | 710,845 |
| Events in quadrant C | 4,338,541 | 628,715 |
| Events in quadrant D | 5,876,946 | 577,316 |
| Mode SS | |||
|---|---|---|---|
| Quadrant | BADHDUFLAG | Total packets | Discarded packets |
| A | 0 | 140 | 0 |
| B | 0 | 140 | 0 |
| C | 0 | 140 | 0 |
| D | 0 | 140 | 0 |
| Mode M9 | |||
|---|---|---|---|
| Quadrant | BADHDUFLAG | Total packets | Discarded packets |
| A | 0 | 15 | 0 |
| B | 0 | 15 | 0 |
| C | 0 | 16 | 0 |
| D | 0 | 16 | 0 |
| Mode M0 | |||
|---|---|---|---|
| Quadrant | BADHDUFLAG | Total packets | Discarded packets |
| A | 0 | 42300 | 2 |
| B | 0 | 19562 | 2 |
| C | 0 | 17917 | 2 |
| D | 0 | 22229 | 2 |
| Quadrant | Total seconds | Saturated seconds | Saturation percentage |
|---|---|---|---|
| A | 6898 | 3381 | 49.014207% |
| B | 6898 | 392 | 5.682807% |
| C | 6898 | 439 | 6.364164% |
| D | 6898 | 611 | 8.857640% |
Noise dominated data is calculated using 1-second bins in cleaned event files. If a bin has >2000 counts, and if more than 50% of those come from <1% of pixels, then it is considered to be noise-dominated and hence unusable.
| Quadrant | # 1 sec bins | Bins with >0 counts | Bins with >2000 counts | High rate bins dominated by noise | Noise dominated (total time) | Noise dominated (detector-on time) | Marked lightcurve |
|---|---|---|---|---|---|---|---|
| A | 7998 | 6900 | 3091 | 3091 | 38.65% | 44.80% |  |
| B | 7998 | 6900 | 192 | 192 | 2.40% | 2.78% |  |
| C | 7998 | 6900 | 330 | 330 | 4.13% | 4.78% | 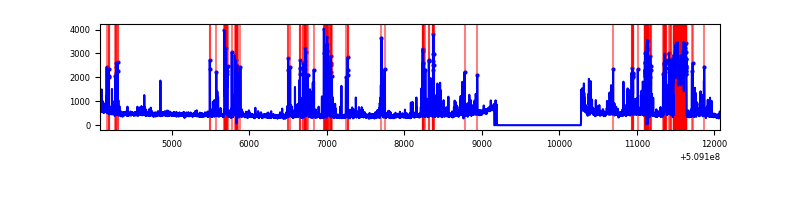 |
| D | 7998 | 6900 | 515 | 515 | 6.44% | 7.46% |  |
Top three noisy pixels from each quadrant. If the there are fewer than three noisy pixels in the level2.evt file, extra rows are filled as -1
| Pixel properties | Quadrant properties | ||||||
|---|---|---|---|---|---|---|---|
| Quadrant | DetID | PixID | Counts | Sigma | Mean | Median | Sigma |
| A | 15 | 32 | 4534239 | 29757.35 | 613 | 600 | 152.4 |
| A | 8 | 176 | 2234312 | 14661.37 | 613 | 600 | 152.4 |
| A | 12 | 115 | 1873655 | 12294.13 | 613 | 600 | 152.4 |
| B | 4 | 171 | 506808 | 3265.45 | 734 | 709 | 155.0 |
| B | 5 | 185 | 398954 | 2569.55 | 734 | 709 | 155.0 |
| B | 0 | 63 | 220921 | 1420.85 | 734 | 709 | 155.0 |
| C | 5 | 250 | 784458 | 4036.93 | 710 | 702 | 194.1 |
| C | 6 | 223 | 333956 | 1716.51 | 710 | 702 | 194.1 |
| C | 5 | 233 | 221841 | 1139.03 | 710 | 702 | 194.1 |
| D | 8 | 129 | 1706328 | 8570.29 | 709 | 676 | 199.0 |
| D | 2 | 249 | 468815 | 2352.23 | 709 | 676 | 199.0 |
| D | 13 | 153 | 258390 | 1294.92 | 709 | 676 | 199.0 |
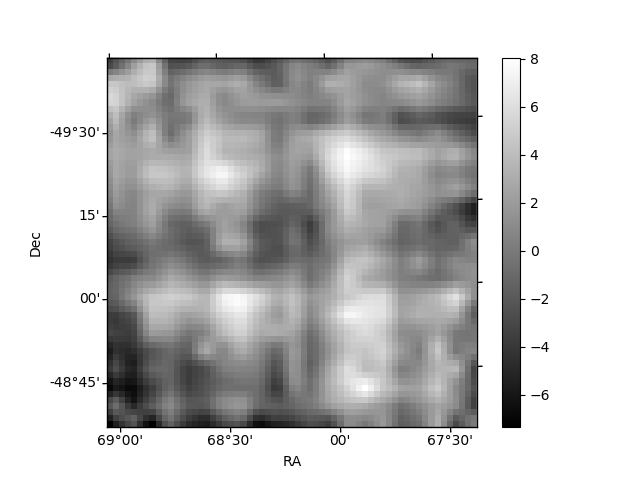
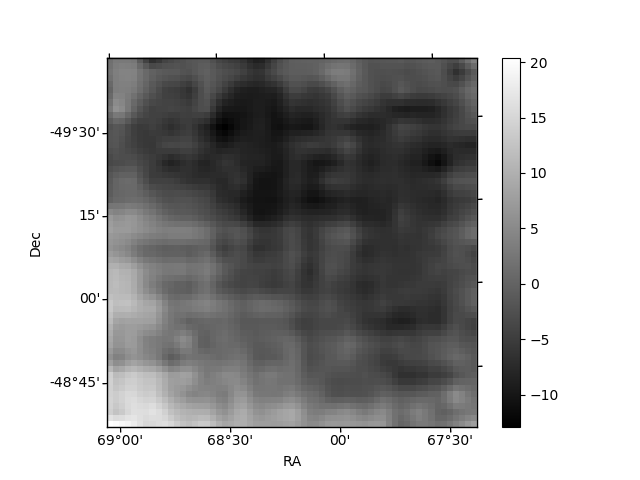
Histogram calculated using DETX and DETY for each event in the final _common_clean file
| Quadrant A | 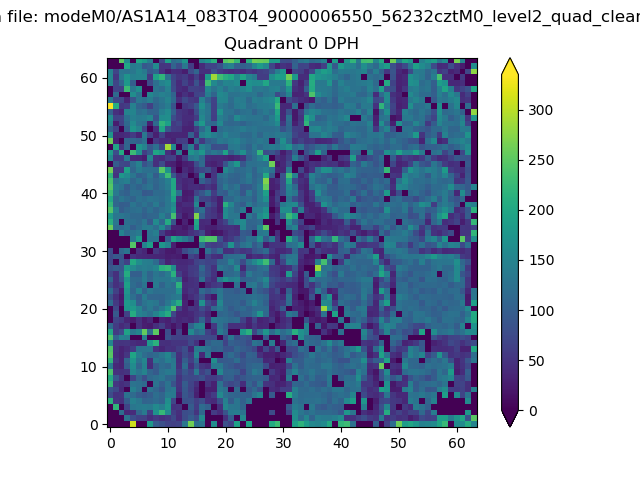 |
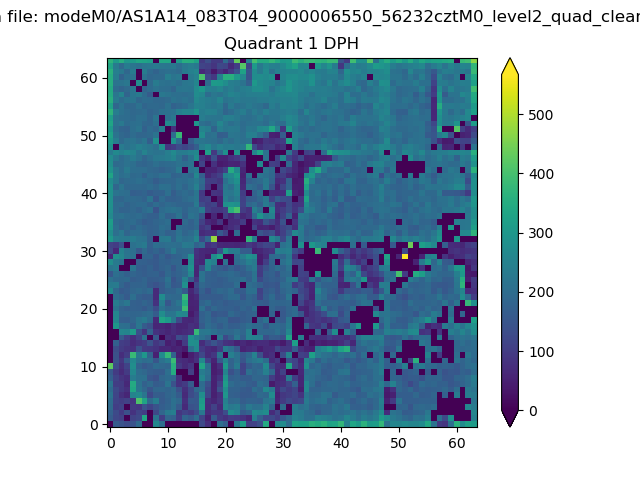 |
Quadrant B |
|---|---|---|---|
| Quadrant D |  |
 |
Quadrant C |
| Plot type | Count rate plots | Images |
|---|---|---|
| Comparison with Poisson distribution Blue bars denote a histogram of data divided into 1 sec bins. Red curve is a Poisson curve with rate = median count rate of data. |
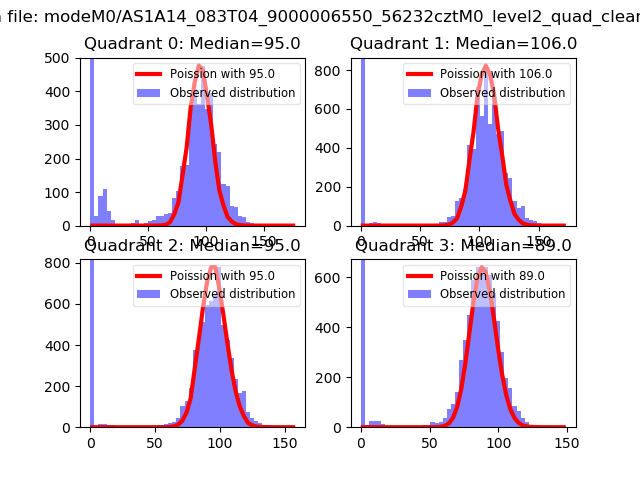 |
 |
| Quadrant-wise count rates Data is divided into 100 sec bins |
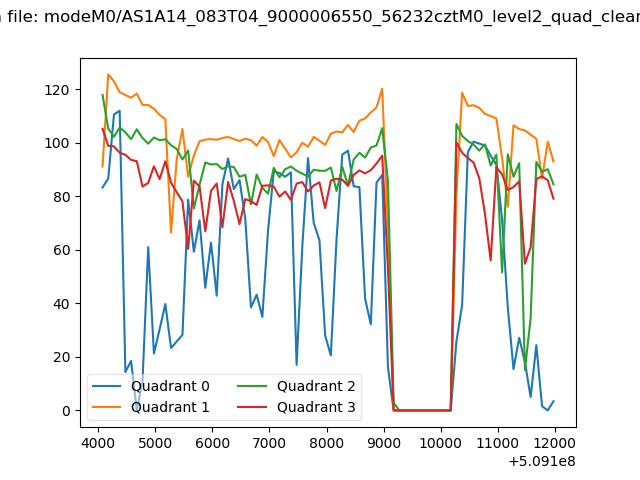 |
|
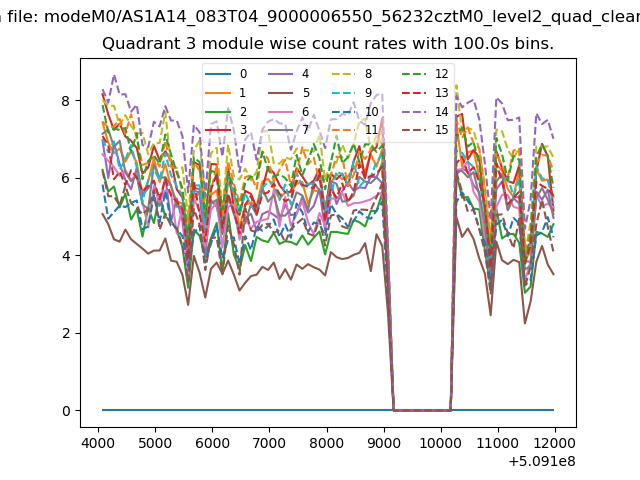
| Module-wise count rates for Quadrant A Data is divided into 100 sec bins |
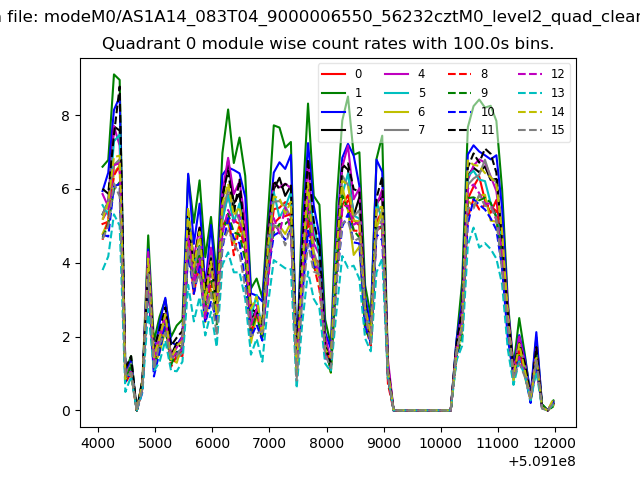 |
 |
| Module-wise count rates for Quadrant B Data is divided into 100 sec bins |
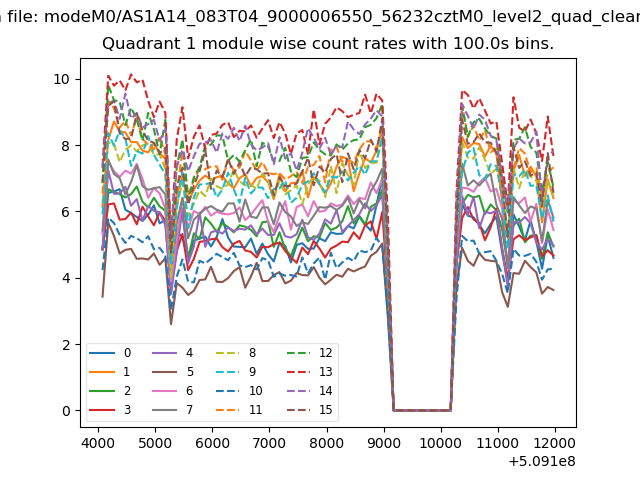 |
 |
| Module-wise count rates for Quadrant C Data is divided into 100 sec bins |
 |
 |
| Module-wise count rates for Quadrant D Data is divided into 100 sec bins |
 |
 |
| Parameter | Plot |
|---|---|
| CZT HV Monitor |  |
| D_VDD | 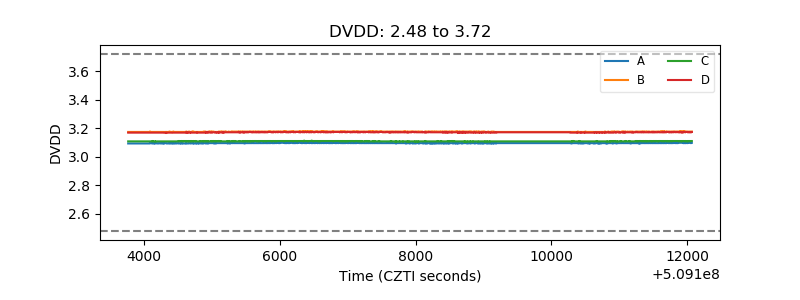 |
| Temperature 1 |  |
| Veto HV Monitor | 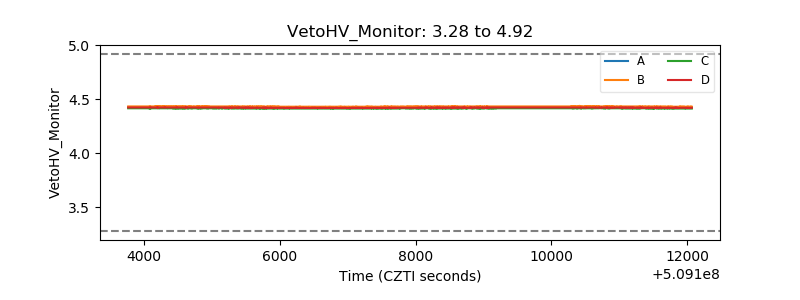 |
| Veto LLD | 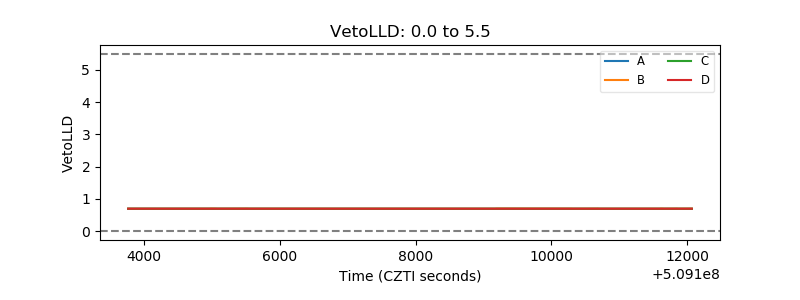 |
| Alpha Counter |  |
| _CPM_Rate | 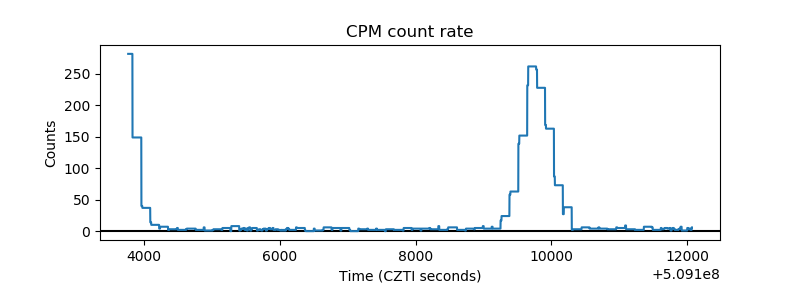 |
| CZT Counter | 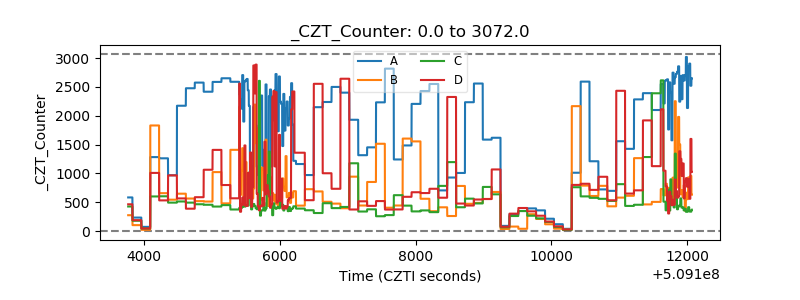 |
| +2.5 Volts monitor |  |
| +5 Volts monitor |  |
| _ROLL_ROT | 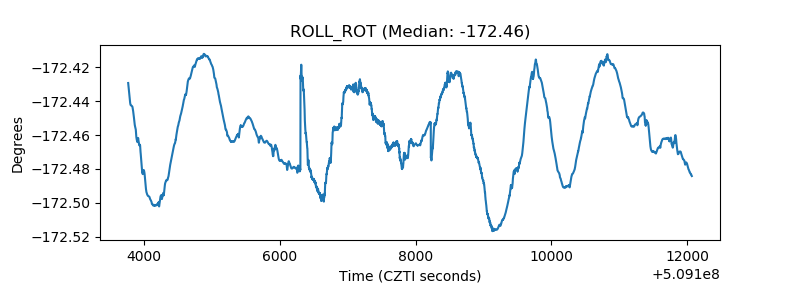 |
| _Roll_DEC | 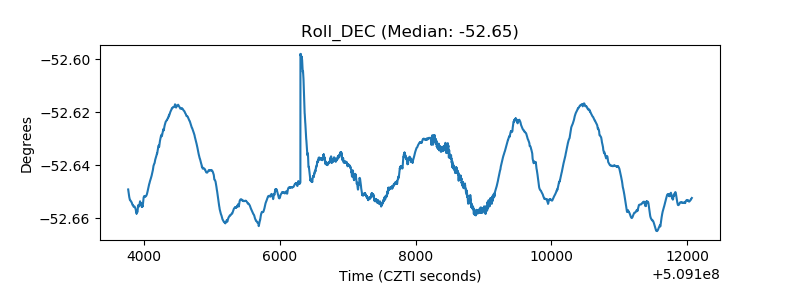 |
| _Roll_RA |  |
| Veto Counter | 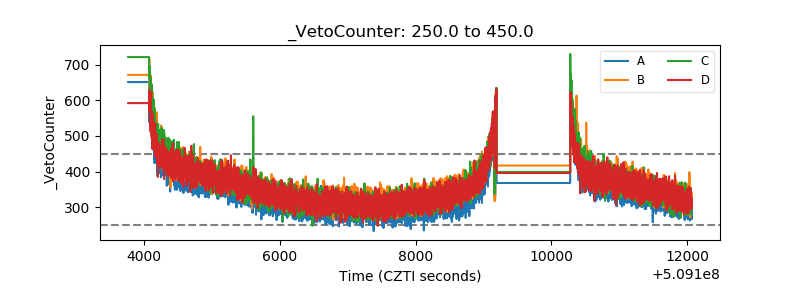 |