| Param | Original file | Final file |
|---|---|---|
| Filename | modeM0/AS1A14_083T04_9000006550_56233cztM0_level2.fits | modeM0/AS1A14_083T04_9000006550_56233cztM0_level2_quad_clean.evt |
| Size (bytes) | 1,464,387,840 | 136,837,440 |
| Size | 1.4 GB | 130.5 MB |
| Events in quadrant A | 23,237,745 | 466,337 |
| Events in quadrant B | 9,007,319 | 1,099,993 |
| Events in quadrant C | 6,804,730 | 1,001,902 |
| Events in quadrant D | 14,277,401 | 785,515 |
| Mode SS | |||
|---|---|---|---|
| Quadrant | BADHDUFLAG | Total packets | Discarded packets |
| A | 0 | 232 | 0 |
| B | 0 | 232 | 0 |
| C | 0 | 232 | 0 |
| D | 0 | 232 | 0 |
| Mode M9 | |||
|---|---|---|---|
| Quadrant | BADHDUFLAG | Total packets | Discarded packets |
| A | 0 | 21 | 0 |
| B | 0 | 21 | 0 |
| C | 0 | 21 | 0 |
| D | 0 | 21 | 0 |
| Mode M0 | |||
|---|---|---|---|
| Quadrant | BADHDUFLAG | Total packets | Discarded packets |
| A | 0 | 76878 | 2 |
| B | 0 | 34776 | 2 |
| C | 0 | 28666 | 3 |
| D | 0 | 50281 | 2 |
| Quadrant | Total seconds | Saturated seconds | Saturation percentage |
|---|---|---|---|
| A | 11406 | 7098 | 62.230405% |
| B | 11406 | 1049 | 9.196914% |
| C | 11406 | 550 | 4.822023% |
| D | 11406 | 2621 | 22.979134% |
Noise dominated data is calculated using 1-second bins in cleaned event files. If a bin has >2000 counts, and if more than 50% of those come from <1% of pixels, then it is considered to be noise-dominated and hence unusable.
| Quadrant | # 1 sec bins | Bins with >0 counts | Bins with >2000 counts | High rate bins dominated by noise | Noise dominated (total time) | Noise dominated (detector-on time) | Marked lightcurve |
|---|---|---|---|---|---|---|---|
| A | 13356 | 11409 | 6711 | 6711 | 50.25% | 58.82% |  |
| B | 13356 | 11409 | 575 | 575 | 4.31% | 5.04% |  |
| C | 13356 | 11409 | 375 | 375 | 2.81% | 3.29% |  |
| D | 13356 | 11409 | 2613 | 2613 | 19.56% | 22.90% |  |
Top three noisy pixels from each quadrant. If the there are fewer than three noisy pixels in the level2.evt file, extra rows are filled as -1
| Pixel properties | Quadrant properties | ||||||
|---|---|---|---|---|---|---|---|
| Quadrant | DetID | PixID | Counts | Sigma | Mean | Median | Sigma |
| A | 15 | 32 | 9591040 | 43508.14 | 886 | 865 | 220.4 |
| A | 8 | 176 | 4390911 | 19916.5 | 886 | 865 | 220.4 |
| A | 12 | 115 | 3817956 | 17317.15 | 886 | 865 | 220.4 |
| B | 5 | 185 | 1278199 | 5154.47 | 1166 | 1124 | 247.8 |
| B | 4 | 171 | 1215348 | 4900.79 | 1166 | 1124 | 247.8 |
| B | 0 | 63 | 439791 | 1770.53 | 1166 | 1124 | 247.8 |
| C | 5 | 250 | 850009 | 2698.16 | 1148 | 1136 | 314.6 |
| C | 6 | 223 | 457875 | 1451.75 | 1148 | 1136 | 314.6 |
| C | 12 | 254 | 399012 | 1264.66 | 1148 | 1136 | 314.6 |
| D | 8 | 129 | 7636737 | 25351.09 | 1067 | 1018 | 301.2 |
| D | 2 | 249 | 625691 | 2073.96 | 1067 | 1018 | 301.2 |
| D | 6 | 239 | 601009 | 1992.01 | 1067 | 1018 | 301.2 |
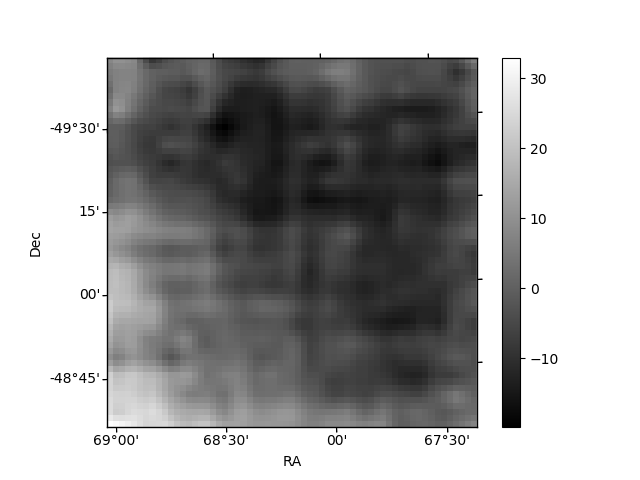
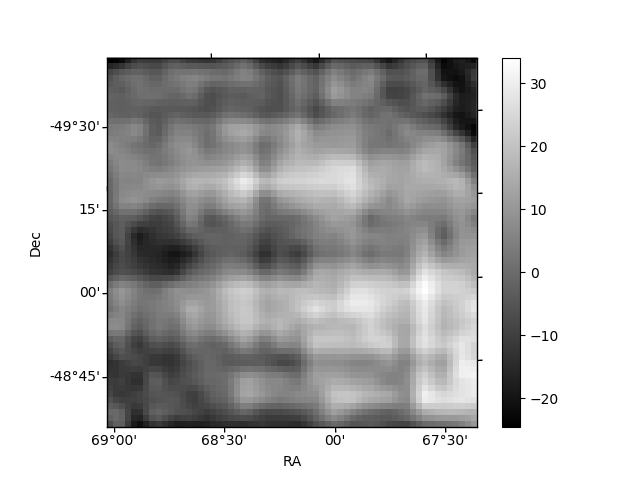
Histogram calculated using DETX and DETY for each event in the final _common_clean file
| Quadrant A |  |
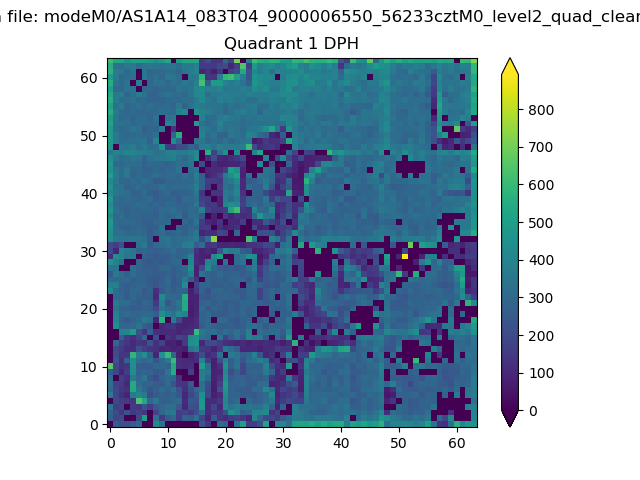 |
Quadrant B |
|---|---|---|---|
| Quadrant D |  |
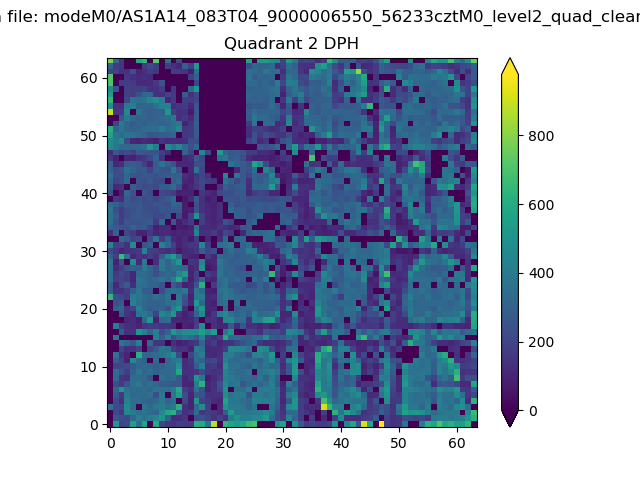 |
Quadrant C |
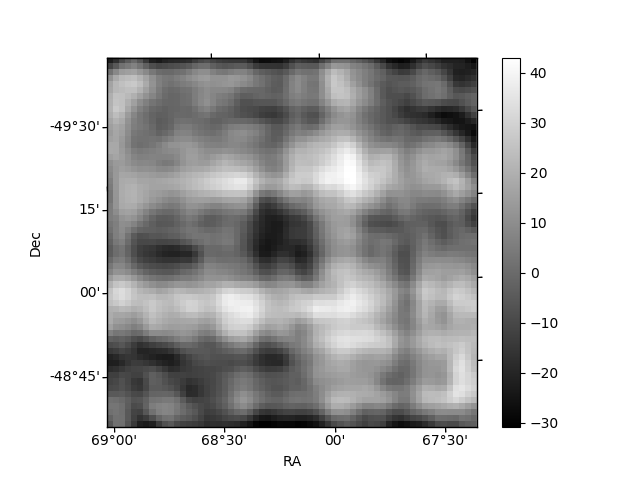
| Plot type | Count rate plots | Images |
|---|---|---|
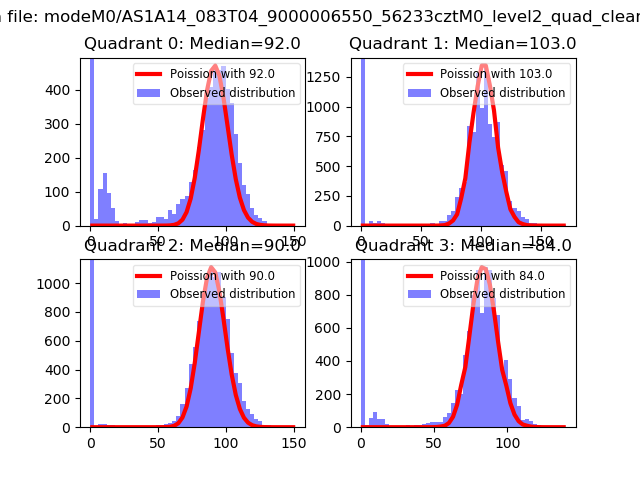
| Comparison with Poisson distribution Blue bars denote a histogram of data divided into 1 sec bins. Red curve is a Poisson curve with rate = median count rate of data. |
 |
 |
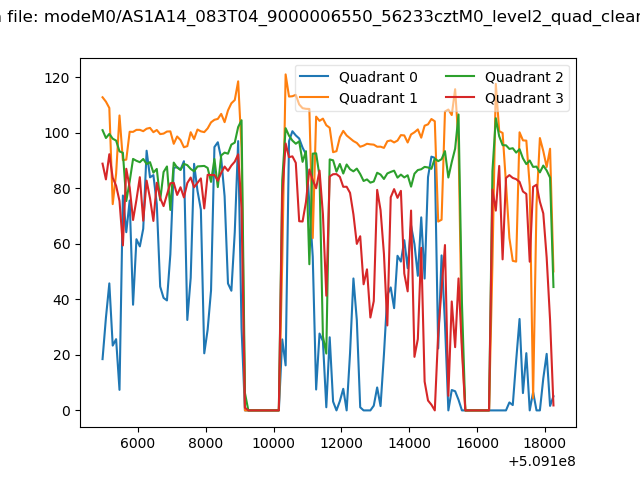
| Quadrant-wise count rates Data is divided into 100 sec bins |
 |
|
| Module-wise count rates for Quadrant A Data is divided into 100 sec bins |
 |
 |
| Module-wise count rates for Quadrant B Data is divided into 100 sec bins |
 |
 |
| Module-wise count rates for Quadrant C Data is divided into 100 sec bins |
 |
 |
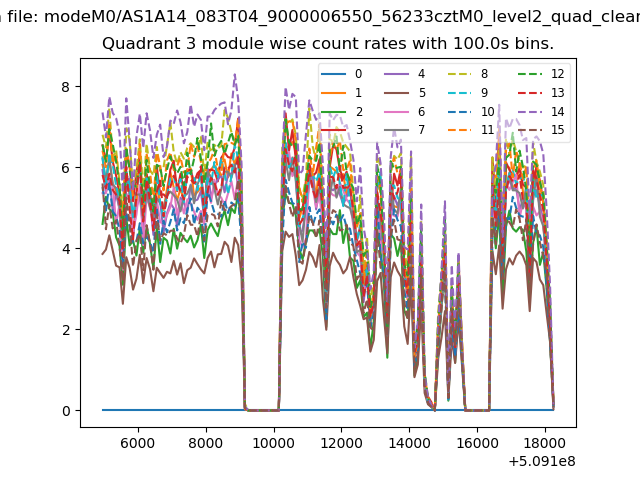
| Module-wise count rates for Quadrant D Data is divided into 100 sec bins |
 |
 |
| Parameter | Plot |
|---|---|
| CZT HV Monitor | 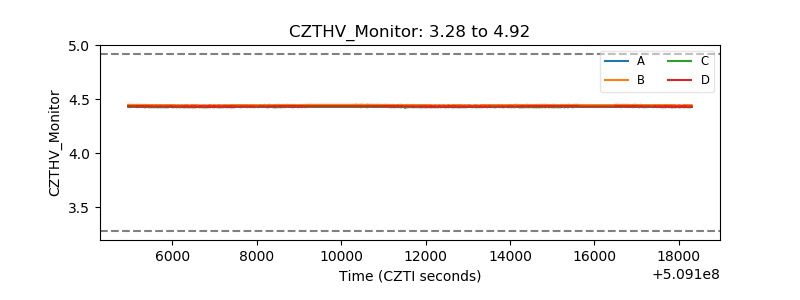 |
| D_VDD |  |
| Temperature 1 | 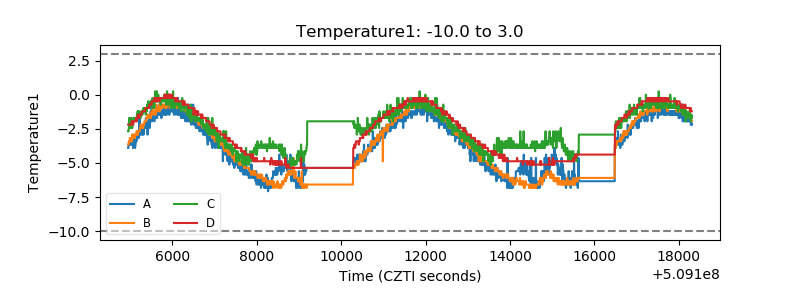 |
| Veto HV Monitor | 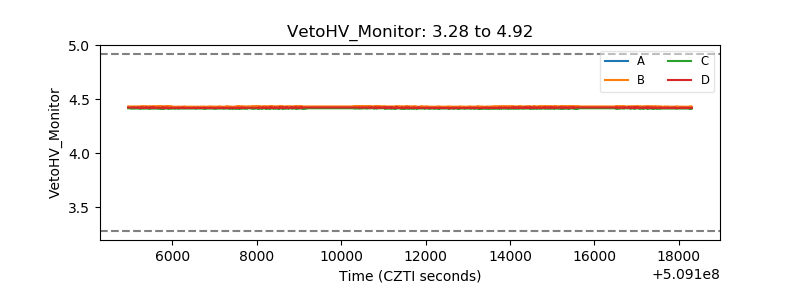 |
| Veto LLD |  |
| Alpha Counter | 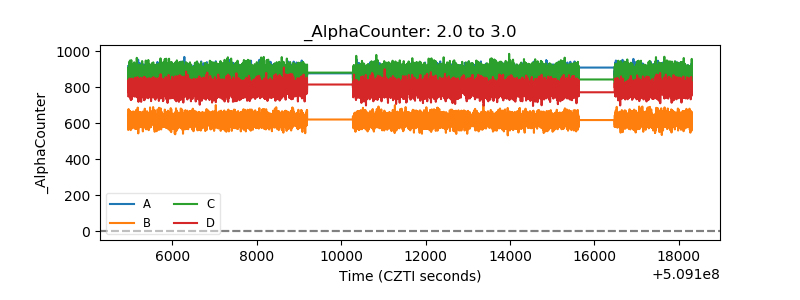 |
| _CPM_Rate | 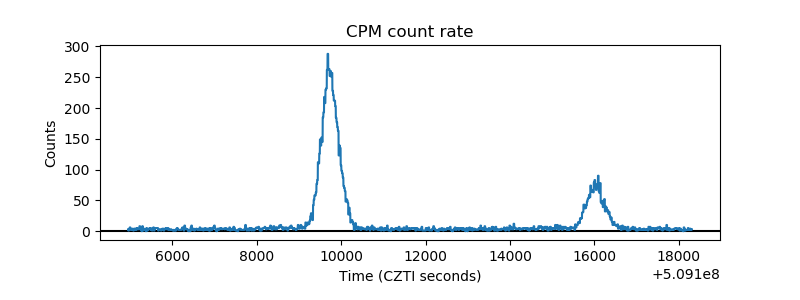 |
| CZT Counter | 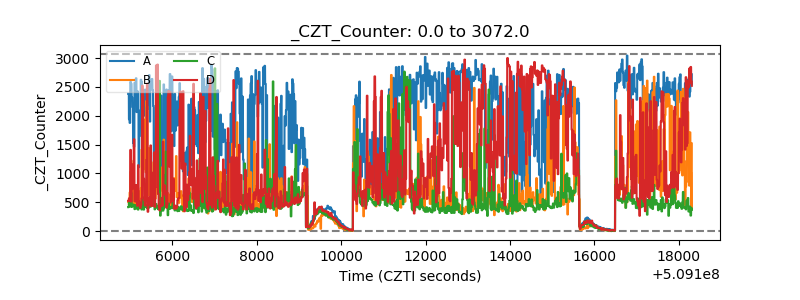 |
| +2.5 Volts monitor | 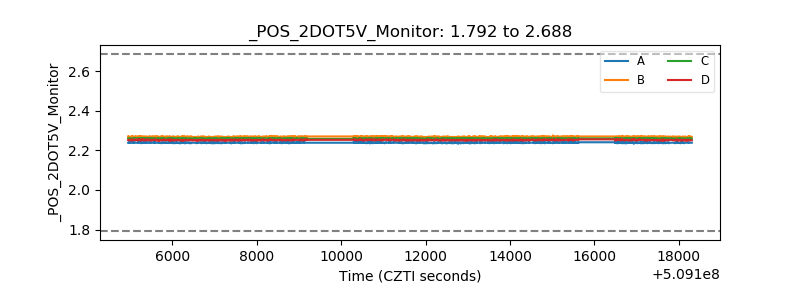 |
| +5 Volts monitor | 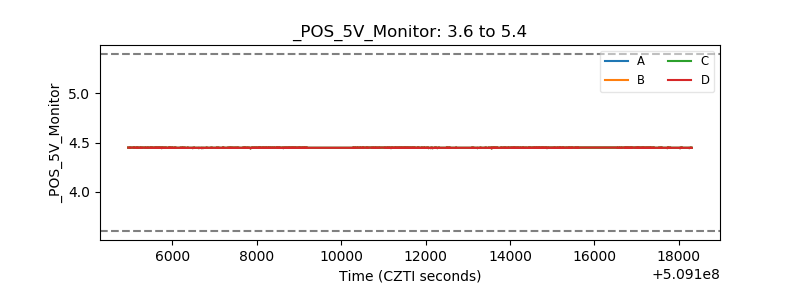 |
| _ROLL_ROT | 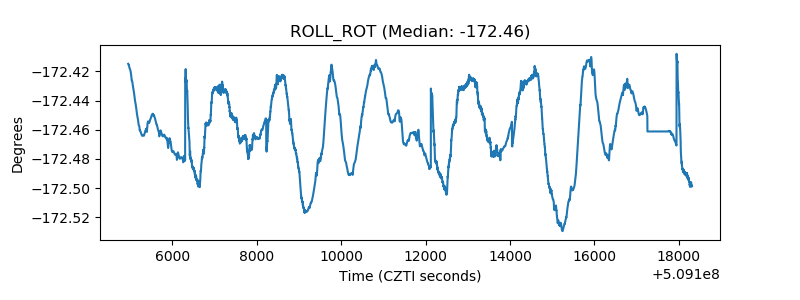 |
| _Roll_DEC | 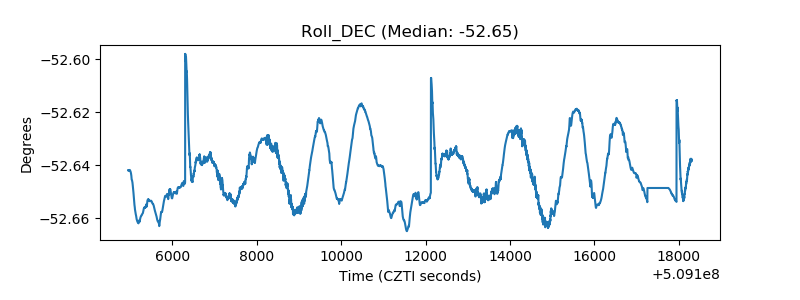 |
| _Roll_RA |  |
| Veto Counter | 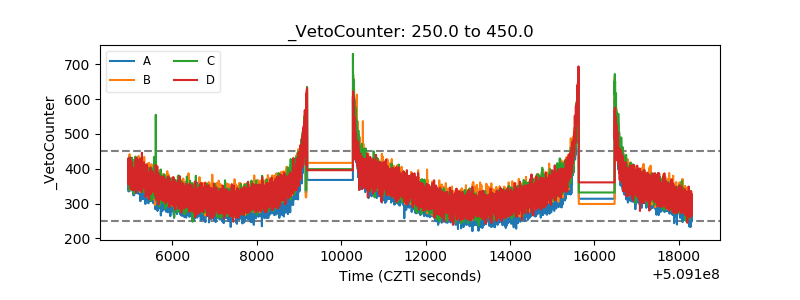 |