| Param | Original file | Final file |
|---|---|---|
| Filename | modeM0/AS1A14_083T04_9000006550_56234cztM0_level2.fits | modeM0/AS1A14_083T04_9000006550_56234cztM0_level2_quad_clean.evt |
| Size (bytes) | 943,070,400 | 70,574,400 |
| Size | 899.4 MB | 67.3 MB |
| Events in quadrant A | 16,627,986 | 48,559 |
| Events in quadrant B | 5,139,668 | 617,820 |
| Events in quadrant C | 4,017,464 | 585,371 |
| Events in quadrant D | 8,613,793 | 425,074 |
| Mode SS | |||
|---|---|---|---|
| Quadrant | BADHDUFLAG | Total packets | Discarded packets |
| A | 0 | 134 | 0 |
| B | 0 | 134 | 0 |
| C | 0 | 134 | 0 |
| D | 0 | 134 | 0 |
| Mode M9 | |||
|---|---|---|---|
| Quadrant | BADHDUFLAG | Total packets | Discarded packets |
| A | 0 | 3 | 0 |
| B | 0 | 3 | 0 |
| C | 0 | 3 | 0 |
| D | 0 | 3 | 0 |
| Mode M0 | |||
|---|---|---|---|
| Quadrant | BADHDUFLAG | Total packets | Discarded packets |
| A | 0 | 53718 | 5 |
| B | 0 | 19816 | 2 |
| C | 0 | 16825 | 2 |
| D | 0 | 30155 | 2 |
| Quadrant | Total seconds | Saturated seconds | Saturation percentage |
|---|---|---|---|
| A | 6592 | 6248 | 94.781553% |
| B | 6593 | 682 | 10.344305% |
| C | 6593 | 271 | 4.110420% |
| D | 6593 | 1910 | 28.970120% |
Noise dominated data is calculated using 1-second bins in cleaned event files. If a bin has >2000 counts, and if more than 50% of those come from <1% of pixels, then it is considered to be noise-dominated and hence unusable.
| Quadrant | # 1 sec bins | Bins with >0 counts | Bins with >2000 counts | High rate bins dominated by noise | Noise dominated (total time) | Noise dominated (detector-on time) | Marked lightcurve |
|---|---|---|---|---|---|---|---|
| A | 6882 | 6594 | 5875 | 5875 | 85.37% | 89.10% |  |
| B | 6883 | 6595 | 399 | 399 | 5.80% | 6.05% |  |
| C | 6883 | 6595 | 155 | 155 | 2.25% | 2.35% | 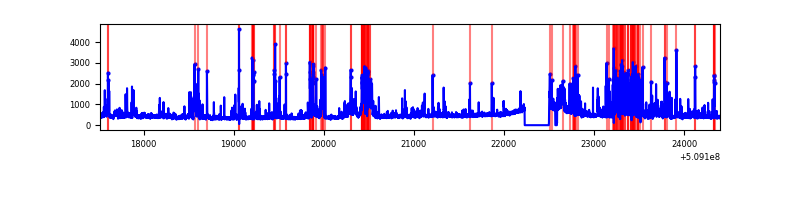 |
| D | 6883 | 6595 | 1678 | 1678 | 24.38% | 25.44% |  |
Top three noisy pixels from each quadrant. If the there are fewer than three noisy pixels in the level2.evt file, extra rows are filled as -1
| Pixel properties | Quadrant properties | ||||||
|---|---|---|---|---|---|---|---|
| Quadrant | DetID | PixID | Counts | Sigma | Mean | Median | Sigma |
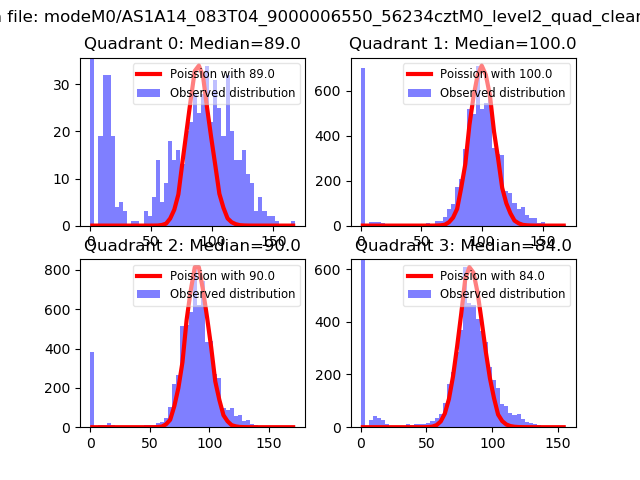
| A | 12 | 115 | 7822510 | 87900.67 | 352 | 344 | 89.0 |
| A | 8 | 176 | 3552373 | 39915.51 | 352 | 344 | 89.0 |
| A | 15 | 32 | 2631572 | 29568.12 | 352 | 344 | 89.0 |
| B | 5 | 185 | 895510 | 6235.65 | 676 | 651 | 143.5 |
| B | 4 | 171 | 503237 | 3502.17 | 676 | 651 | 143.5 |
| B | 4 | 156 | 293914 | 2043.54 | 676 | 651 | 143.5 |
| C | 12 | 254 | 444812 | 2398.51 | 672 | 663 | 185.2 |
| C | 5 | 250 | 409887 | 2209.91 | 672 | 663 | 185.2 |
| C | 12 | 252 | 241329 | 1299.65 | 672 | 663 | 185.2 |
| D | 8 | 129 | 4352560 | 26367.27 | 577 | 550 | 165.1 |
| D | 6 | 239 | 926984 | 5612.93 | 577 | 550 | 165.1 |
| D | 2 | 249 | 369573 | 2235.78 | 577 | 550 | 165.1 |
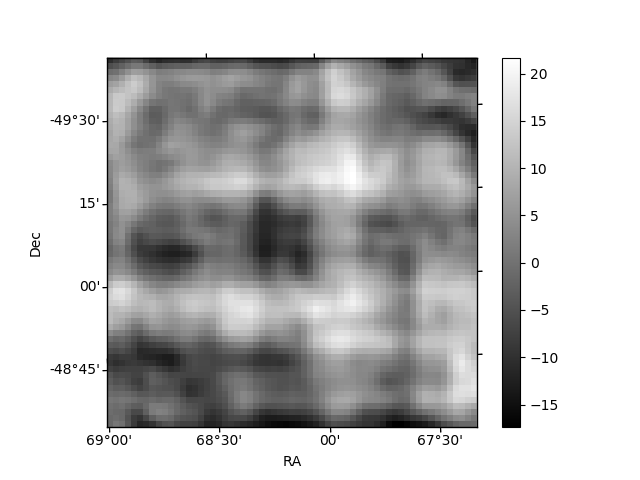
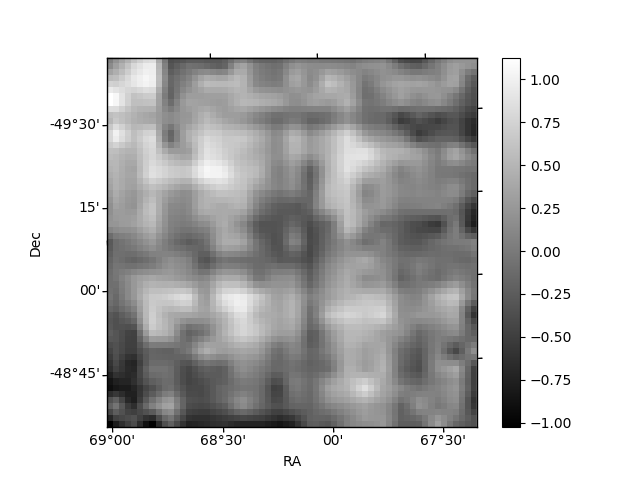
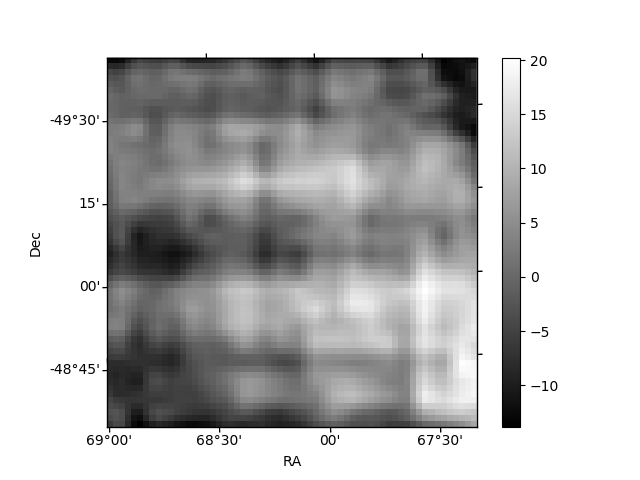
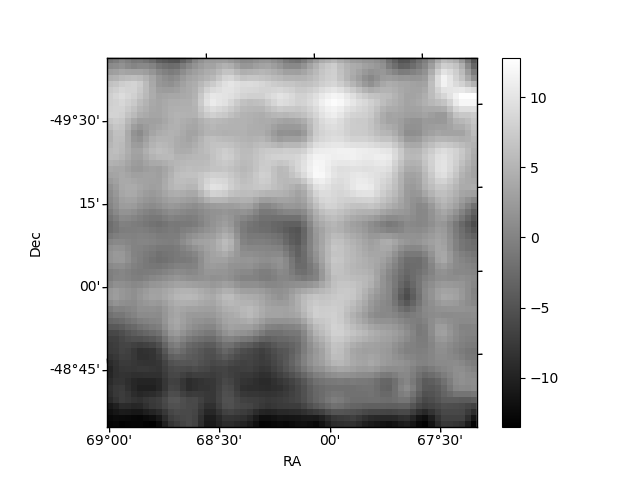
Histogram calculated using DETX and DETY for each event in the final _common_clean file
| Quadrant A | 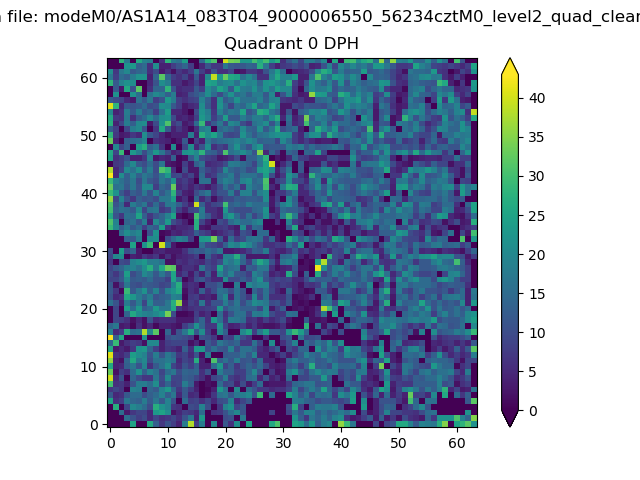 |
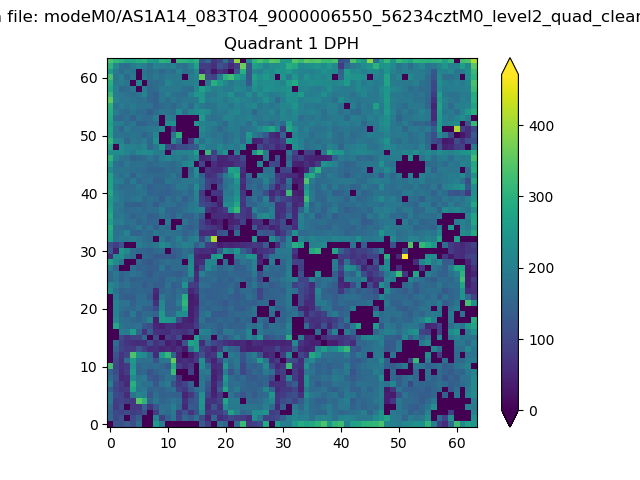 |
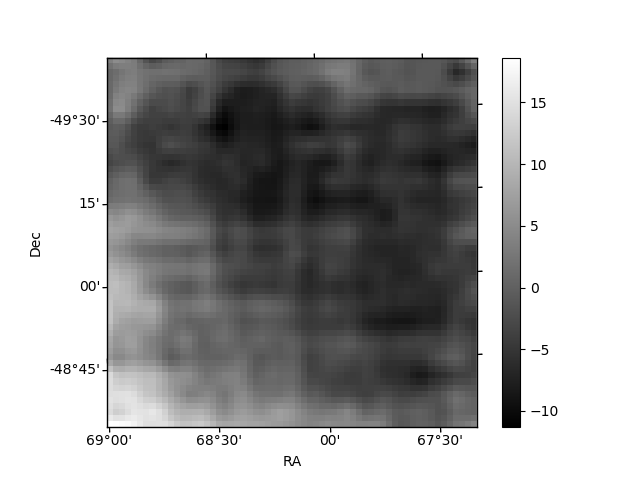
Quadrant B |
|---|---|---|---|
| Quadrant D | 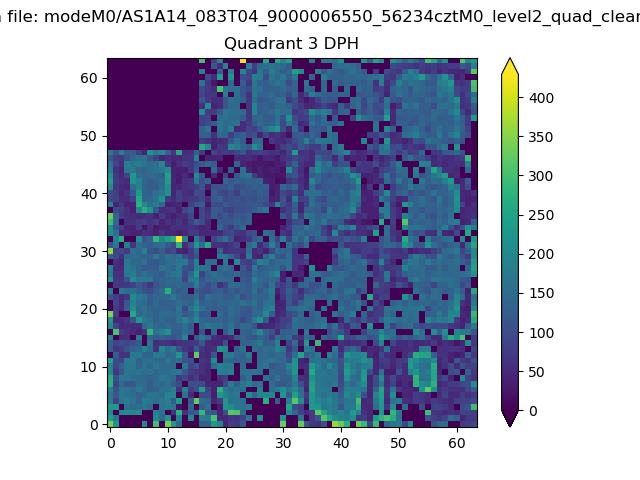 |
 |
Quadrant C |
| Plot type | Count rate plots | Images |
|---|---|---|
| Comparison with Poisson distribution Blue bars denote a histogram of data divided into 1 sec bins. Red curve is a Poisson curve with rate = median count rate of data. |
 |
 |
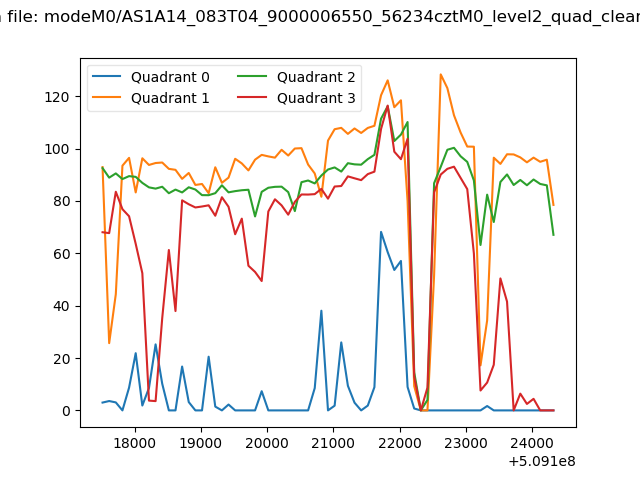
| Quadrant-wise count rates Data is divided into 100 sec bins |
 |
|
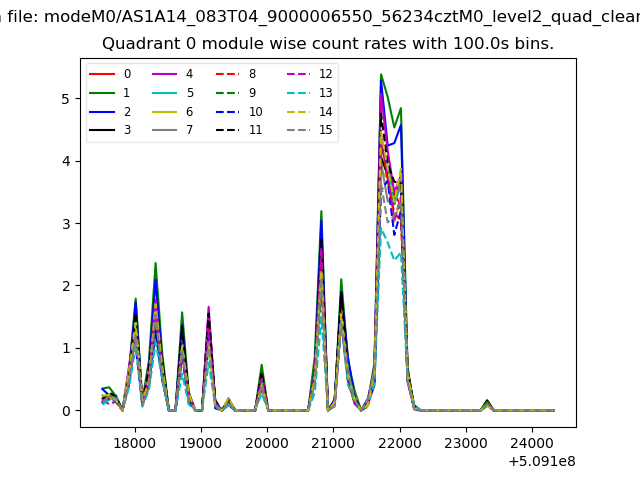
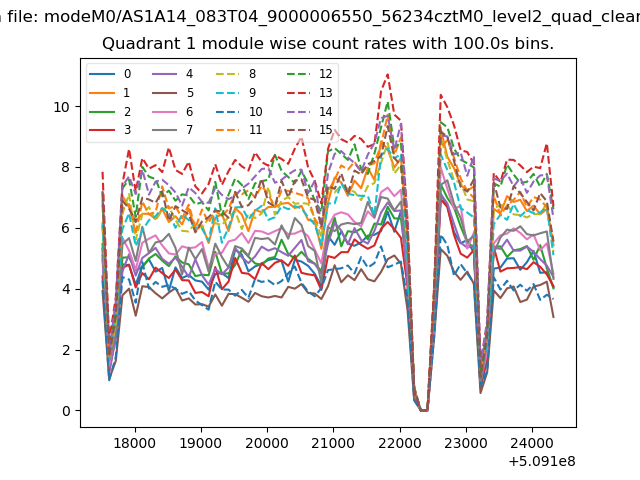
| Module-wise count rates for Quadrant A Data is divided into 100 sec bins |
 |
 |
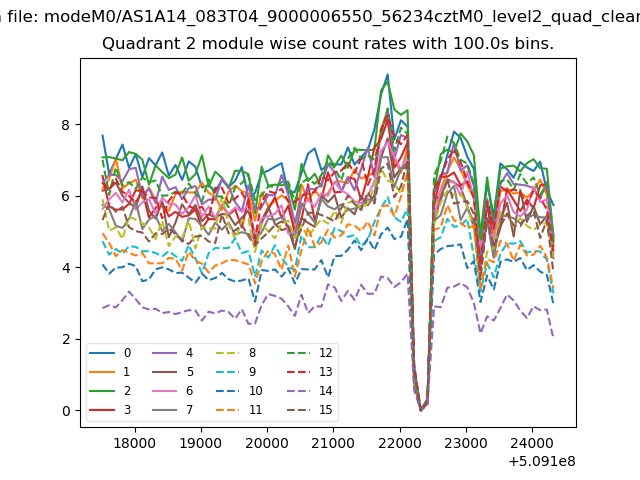
| Module-wise count rates for Quadrant B Data is divided into 100 sec bins |
 |
 |
| Module-wise count rates for Quadrant C Data is divided into 100 sec bins |
 |
 |
| Module-wise count rates for Quadrant D Data is divided into 100 sec bins |
 |
 |
| Parameter | Plot |
|---|---|
| CZT HV Monitor | 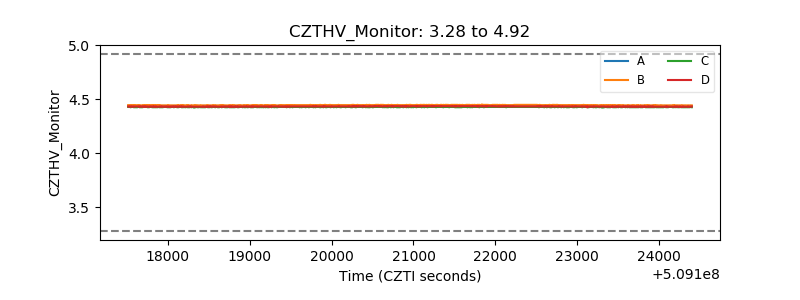 |
| D_VDD | 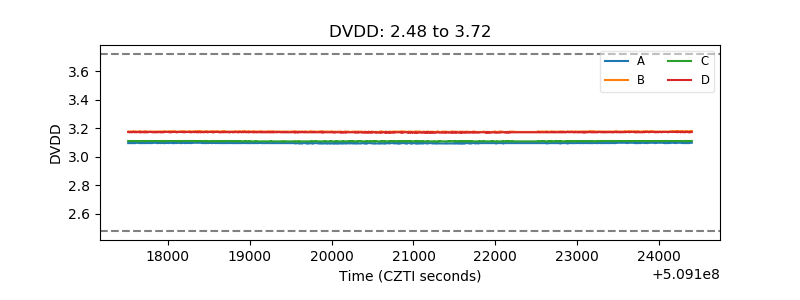 |
| Temperature 1 | 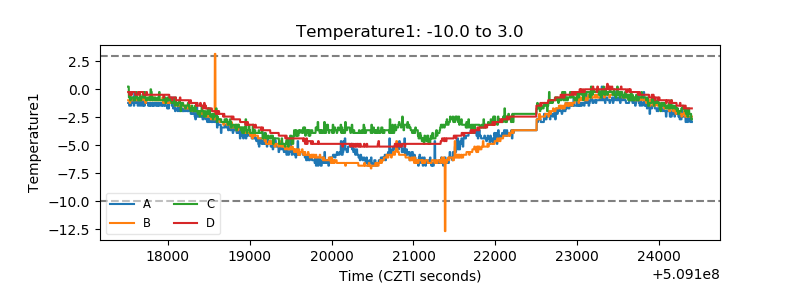 |
| Veto HV Monitor |  |
| Veto LLD |  |
| Alpha Counter | 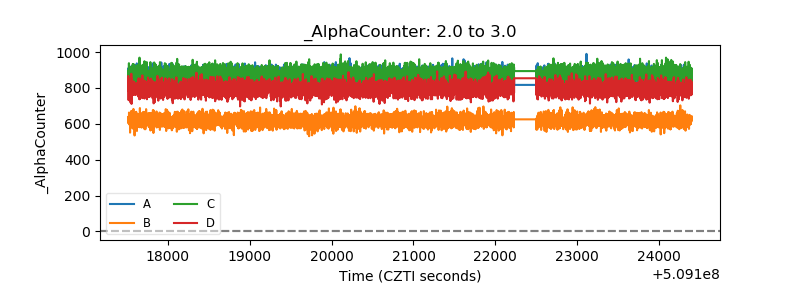 |
| _CPM_Rate | 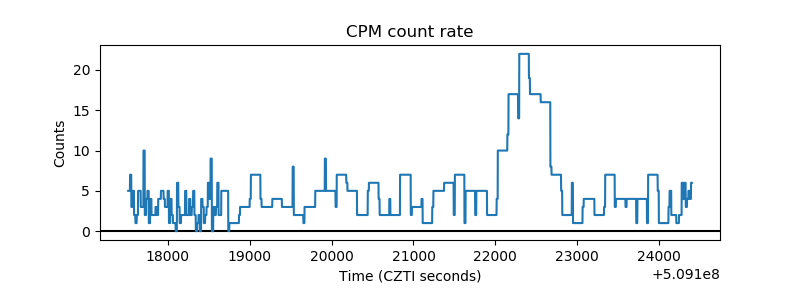 |
| CZT Counter |  |
| +2.5 Volts monitor |  |
| +5 Volts monitor |  |
| _ROLL_ROT |  |
| _Roll_DEC |  |
| _Roll_RA |  |
| Veto Counter |  |