| Param | Original file | Final file |
|---|---|---|
| Filename | modeM0/AS1A14_083T04_9000006550_56235cztM0_level2.fits | modeM0/AS1A14_083T04_9000006550_56235cztM0_level2_quad_clean.evt |
| Size (bytes) | 916,623,360 | 77,394,240 |
| Size | 874.2 MB | 73.8 MB |
| Events in quadrant A | 14,892,658 | 226,874 |
| Events in quadrant B | 4,543,815 | 663,890 |
| Events in quadrant C | 4,612,966 | 590,070 |
| Events in quadrant D | 9,348,000 | 382,032 |
| Mode SS | |||
|---|---|---|---|
| Quadrant | BADHDUFLAG | Total packets | Discarded packets |
| A | 0 | 138 | 0 |
| B | 0 | 138 | 0 |
| C | 0 | 138 | 0 |
| D | 0 | 138 | 0 |
| Mode M0 | |||
|---|---|---|---|
| Quadrant | BADHDUFLAG | Total packets | Discarded packets |
| A | 0 | 48872 | 3 |
| B | 0 | 18191 | 0 |
| C | 0 | 18870 | 0 |
| D | 0 | 32586 | 0 |
| Quadrant | Total seconds | Saturated seconds | Saturation percentage |
|---|---|---|---|
| A | 6889 | 4788 | 69.502105% |
| B | 6890 | 367 | 5.326560% |
| C | 6890 | 366 | 5.312046% |
| D | 6890 | 2461 | 35.718433% |
Noise dominated data is calculated using 1-second bins in cleaned event files. If a bin has >2000 counts, and if more than 50% of those come from <1% of pixels, then it is considered to be noise-dominated and hence unusable.
| Quadrant | # 1 sec bins | Bins with >0 counts | Bins with >2000 counts | High rate bins dominated by noise | Noise dominated (total time) | Noise dominated (detector-on time) | Marked lightcurve |
|---|---|---|---|---|---|---|---|
| A | 6889 | 6889 | 4590 | 4590 | 66.63% | 66.63% |  |
| B | 6890 | 6890 | 179 | 179 | 2.60% | 2.60% |  |
| C | 6890 | 6890 | 301 | 301 | 4.37% | 4.37% | 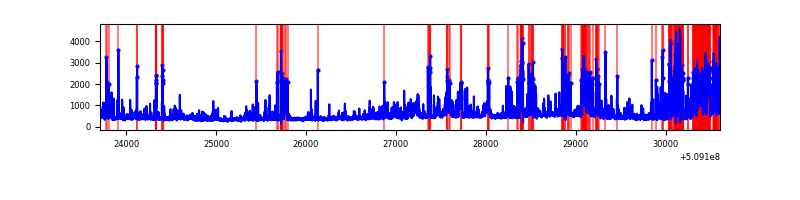 |
| D | 6890 | 6890 | 2169 | 2169 | 31.48% | 31.48% |  |
Top three noisy pixels from each quadrant. If the there are fewer than three noisy pixels in the level2.evt file, extra rows are filled as -1
| Pixel properties | Quadrant properties | ||||||
|---|---|---|---|---|---|---|---|
| Quadrant | DetID | PixID | Counts | Sigma | Mean | Median | Sigma |
| A | 8 | 176 | 4682493 | 36883.79 | 504 | 492 | 126.9 |
| A | 15 | 32 | 3540737 | 27889.28 | 504 | 492 | 126.9 |
| A | 12 | 115 | 3060609 | 24106.94 | 504 | 492 | 126.9 |
| B | 5 | 185 | 490404 | 3273.02 | 703 | 677 | 149.6 |
| B | 4 | 171 | 209037 | 1392.54 | 703 | 677 | 149.6 |
| B | 1 | 207 | 188387 | 1254.53 | 703 | 677 | 149.6 |
| C | 13 | 3 | 796803 | 4247.42 | 681 | 673 | 187.4 |
| C | 5 | 250 | 561670 | 2992.97 | 681 | 673 | 187.4 |
| C | 12 | 252 | 329325 | 1753.39 | 681 | 673 | 187.4 |
| D | 8 | 129 | 5161917 | 32278.74 | 558 | 533 | 159.9 |
| D | 6 | 239 | 1191785 | 7449.96 | 558 | 533 | 159.9 |
| D | 13 | 153 | 149000 | 928.5 | 558 | 533 | 159.9 |
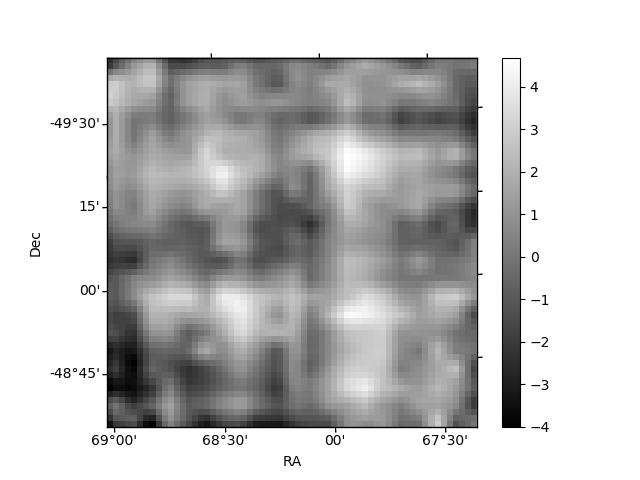
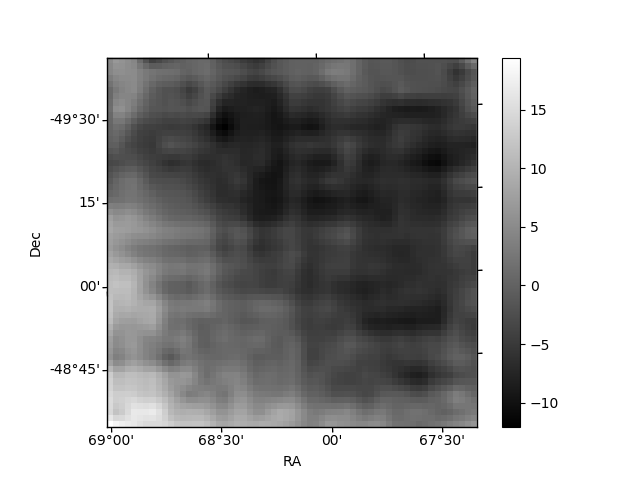
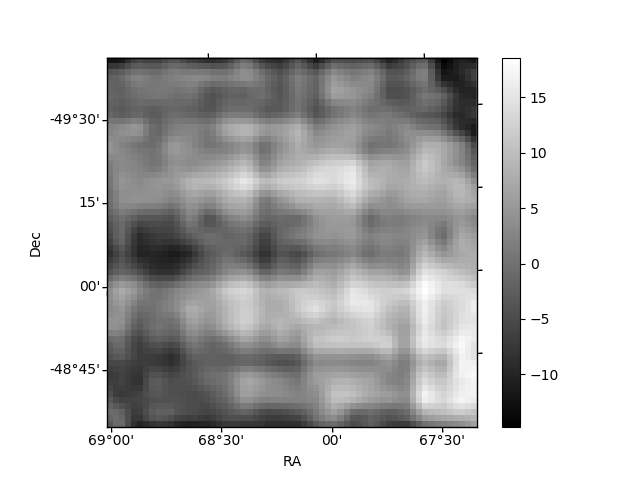
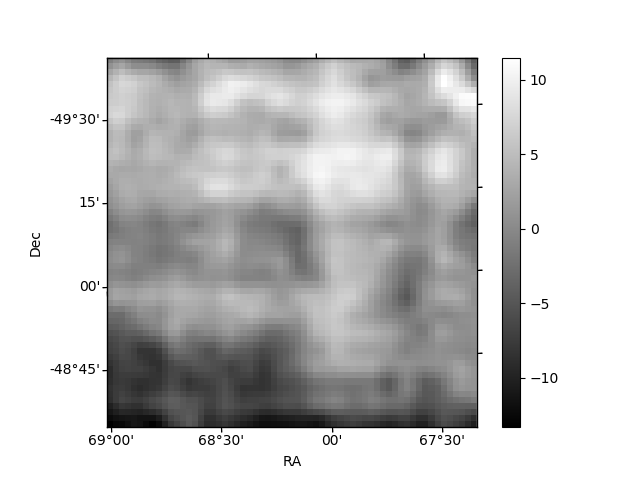
Histogram calculated using DETX and DETY for each event in the final _common_clean file
| Quadrant A | 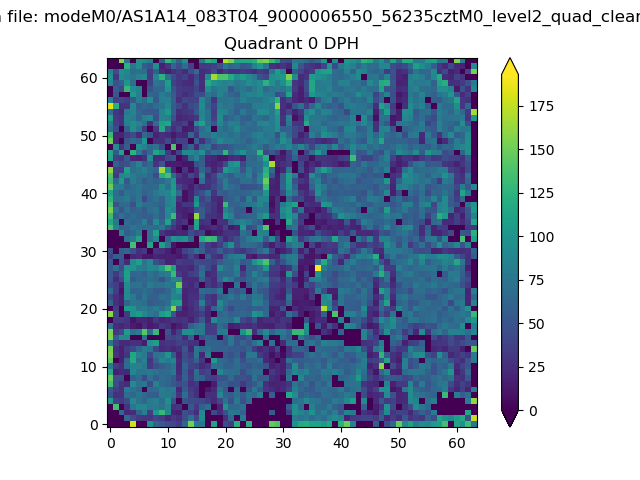 |
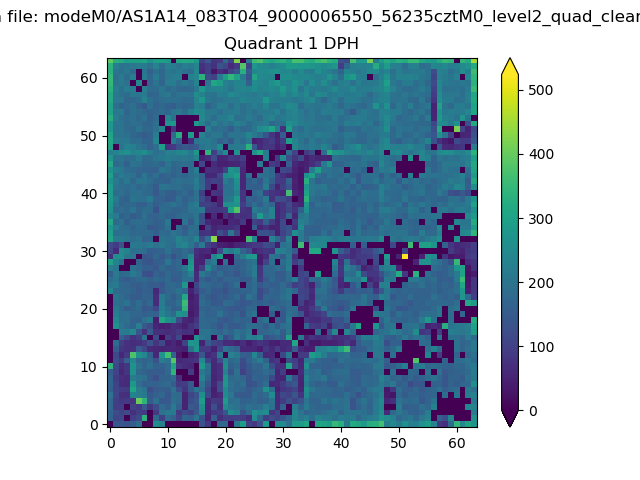 |
Quadrant B |
|---|---|---|---|
| Quadrant D | 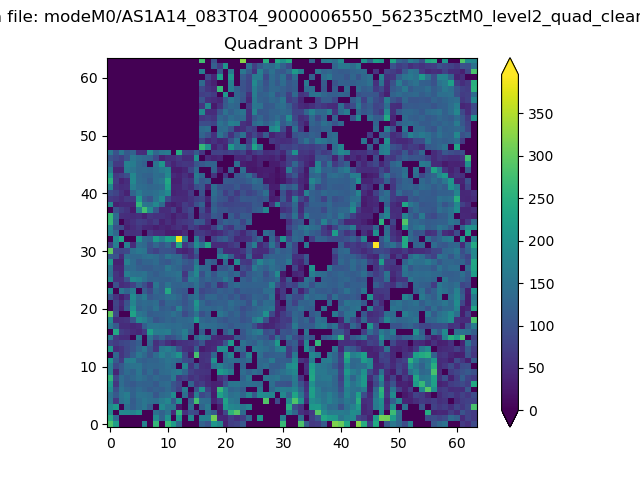 |
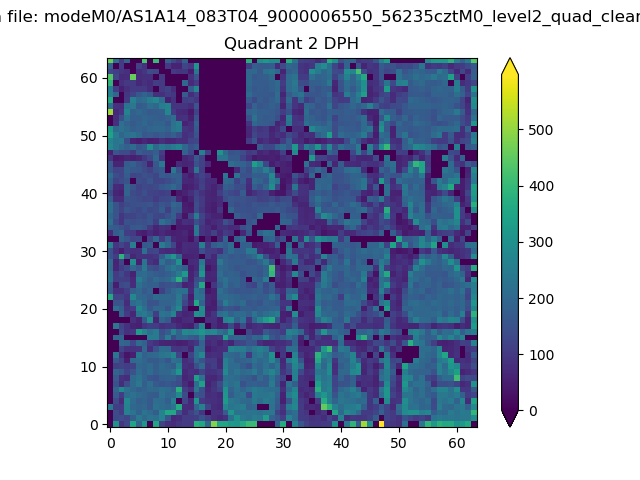 |
Quadrant C |
| Plot type | Count rate plots | Images |
|---|---|---|
| Comparison with Poisson distribution Blue bars denote a histogram of data divided into 1 sec bins. Red curve is a Poisson curve with rate = median count rate of data. |
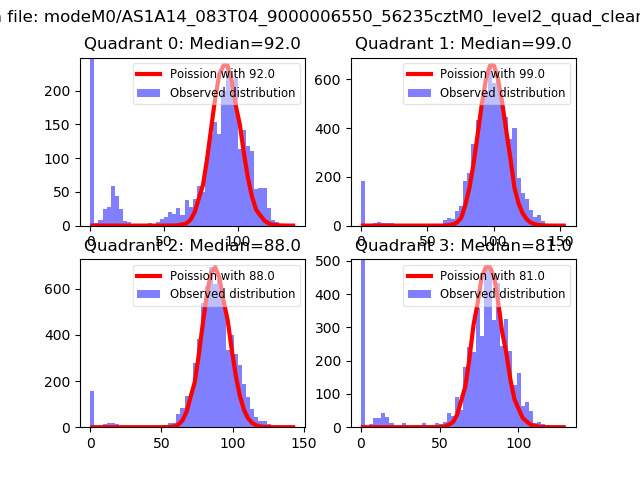 |
 |
| Quadrant-wise count rates Data is divided into 100 sec bins |
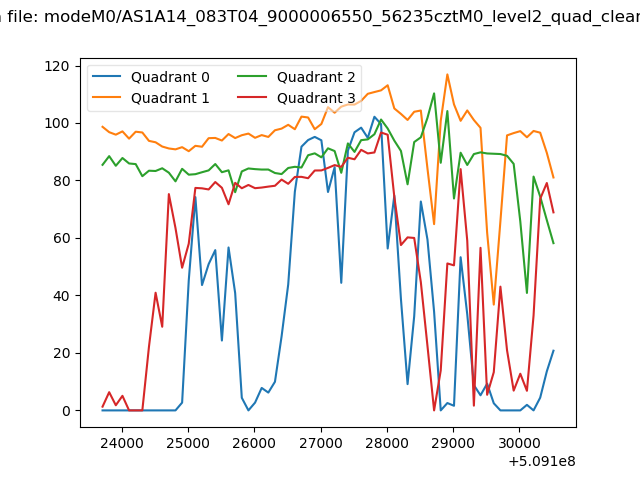 |
|
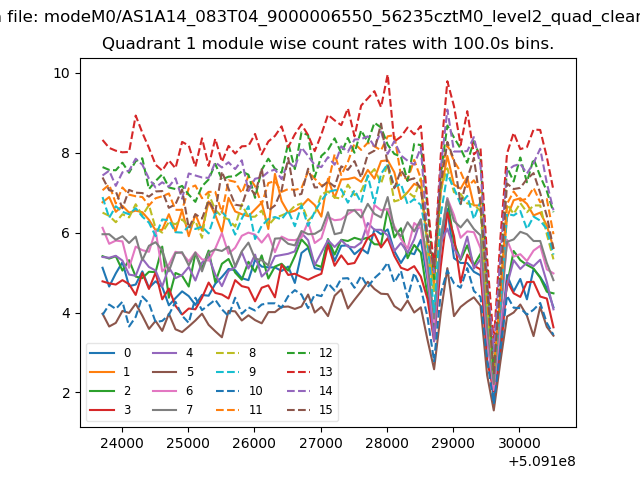
| Module-wise count rates for Quadrant A Data is divided into 100 sec bins |
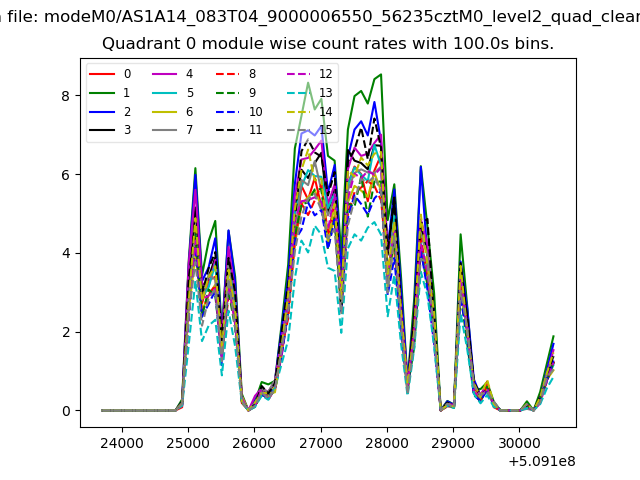 |
 |
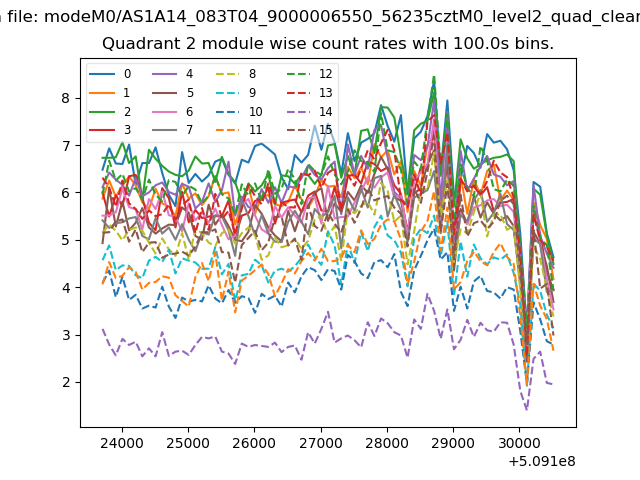
| Module-wise count rates for Quadrant B Data is divided into 100 sec bins |
 |
 |
| Module-wise count rates for Quadrant C Data is divided into 100 sec bins |
 |
 |
| Module-wise count rates for Quadrant D Data is divided into 100 sec bins |
 |
 |
| Parameter | Plot |
|---|---|
| CZT HV Monitor | 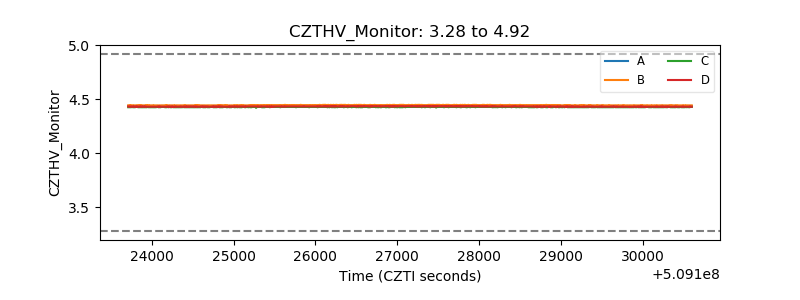 |
| D_VDD | 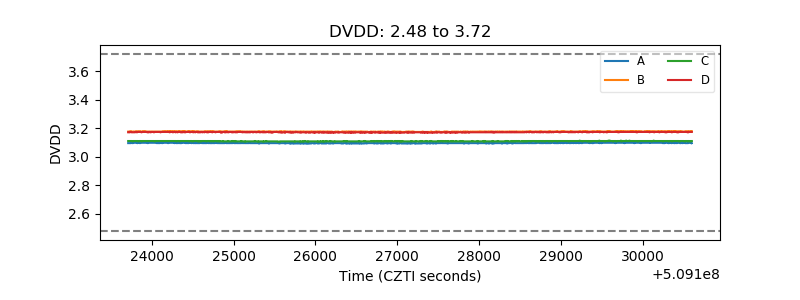 |
| Temperature 1 | 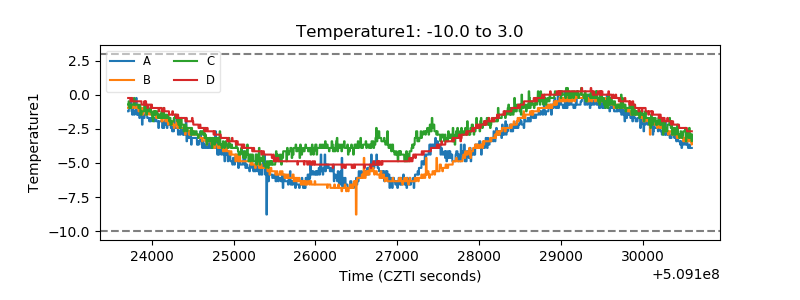 |
| Veto HV Monitor |  |
| Veto LLD | 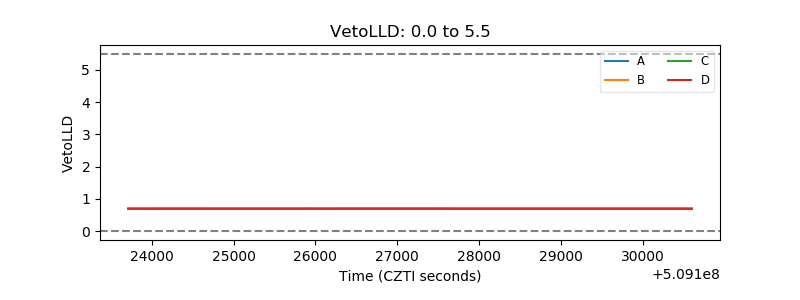 |
| Alpha Counter | 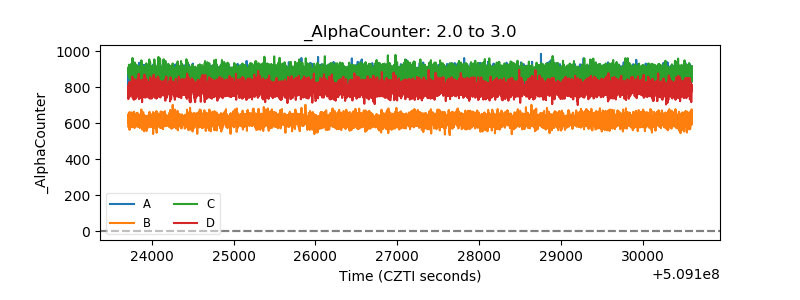 |
| _CPM_Rate | 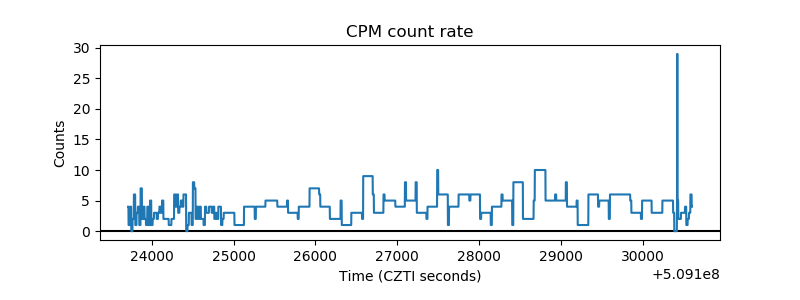 |
| CZT Counter | 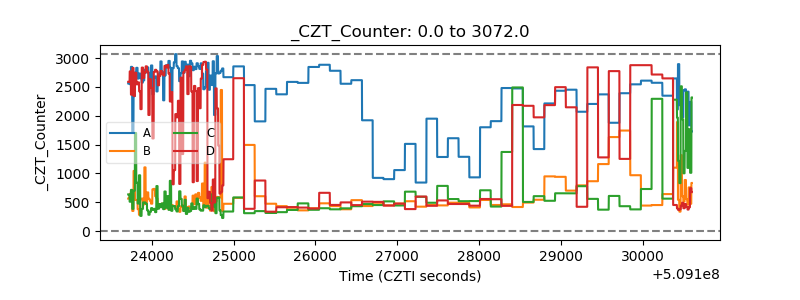 |
| +2.5 Volts monitor |  |
| +5 Volts monitor | 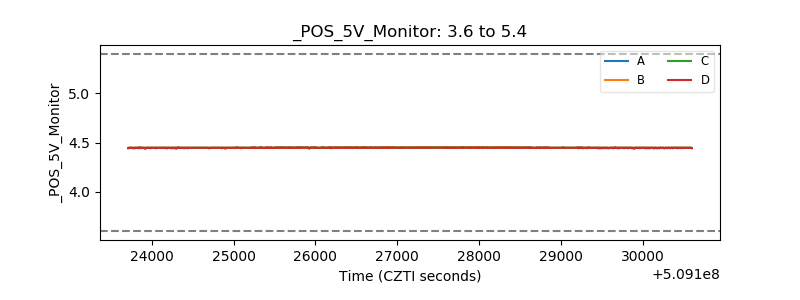 |
| _ROLL_ROT |  |
| _Roll_DEC |  |
| _Roll_RA |  |
| Veto Counter |  |