| Param | Original file | Final file |
|---|---|---|
| Filename | modeM0/AS1A14_083T04_9000006550_56236cztM0_level2.fits | modeM0/AS1A14_083T04_9000006550_56236cztM0_level2_quad_clean.evt |
| Size (bytes) | 909,221,760 | 89,081,280 |
| Size | 867.1 MB | 85.0 MB |
| Events in quadrant A | 13,022,036 | 402,189 |
| Events in quadrant B | 5,280,695 | 721,803 |
| Events in quadrant C | 5,878,865 | 546,748 |
| Events in quadrant D | 8,891,553 | 501,708 |
| Mode SS | |||
|---|---|---|---|
| Quadrant | BADHDUFLAG | Total packets | Discarded packets |
| A | 0 | 150 | 0 |
| B | 0 | 150 | 0 |
| C | 0 | 150 | 0 |
| D | 0 | 150 | 0 |
| Mode M0 | |||
|---|---|---|---|
| Quadrant | BADHDUFLAG | Total packets | Discarded packets |
| A | 0 | 43939 | 0 |
| B | 0 | 20854 | 0 |
| C | 0 | 22863 | 0 |
| D | 0 | 31648 | 2 |
| Quadrant | Total seconds | Saturated seconds | Saturation percentage |
|---|---|---|---|
| A | 7540 | 3461 | 45.901857% |
| B | 7540 | 426 | 5.649867% |
| C | 7540 | 1401 | 18.580902% |
| D | 7540 | 1656 | 21.962865% |
Noise dominated data is calculated using 1-second bins in cleaned event files. If a bin has >2000 counts, and if more than 50% of those come from <1% of pixels, then it is considered to be noise-dominated and hence unusable.
| Quadrant | # 1 sec bins | Bins with >0 counts | Bins with >2000 counts | High rate bins dominated by noise | Noise dominated (total time) | Noise dominated (detector-on time) | Marked lightcurve |
|---|---|---|---|---|---|---|---|
| A | 7540 | 7540 | 3323 | 3323 | 44.07% | 44.07% | 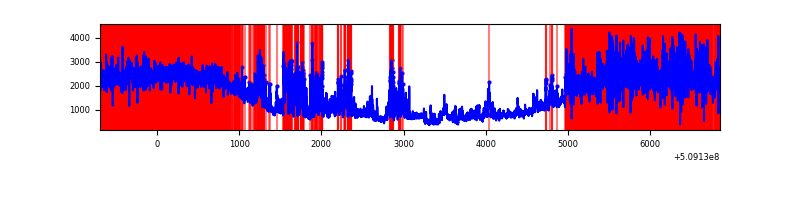 |
| B | 7540 | 7540 | 265 | 265 | 3.51% | 3.51% |  |
| C | 7540 | 7540 | 495 | 495 | 6.56% | 6.56% |  |
| D | 7540 | 7540 | 1606 | 1606 | 21.30% | 21.30% |  |
Top three noisy pixels from each quadrant. If the there are fewer than three noisy pixels in the level2.evt file, extra rows are filled as -1
| Pixel properties | Quadrant properties | ||||||
|---|---|---|---|---|---|---|---|
| Quadrant | DetID | PixID | Counts | Sigma | Mean | Median | Sigma |
| A | 8 | 176 | 5635029 | 34544.31 | 644 | 628 | 163.1 |
| A | 15 | 32 | 3845804 | 23574.63 | 644 | 628 | 163.1 |
| A | 7 | 64 | 682177 | 4178.55 | 644 | 628 | 163.1 |
| B | 4 | 171 | 908883 | 5539.11 | 765 | 739 | 164.0 |
| B | 5 | 185 | 396615 | 2414.6 | 765 | 739 | 164.0 |
| B | 10 | 247 | 213160 | 1295.64 | 765 | 739 | 164.0 |
| C | 13 | 3 | 2472953 | 13936.17 | 638 | 631 | 177.4 |
| C | 12 | 252 | 393842 | 2216.48 | 638 | 631 | 177.4 |
| C | 12 | 254 | 121624 | 682.02 | 638 | 631 | 177.4 |
| D | 8 | 129 | 4705104 | 24850.19 | 662 | 633 | 189.3 |
| D | 11 | 129 | 434210 | 2290.26 | 662 | 633 | 189.3 |
| D | 2 | 249 | 275145 | 1450.04 | 662 | 633 | 189.3 |
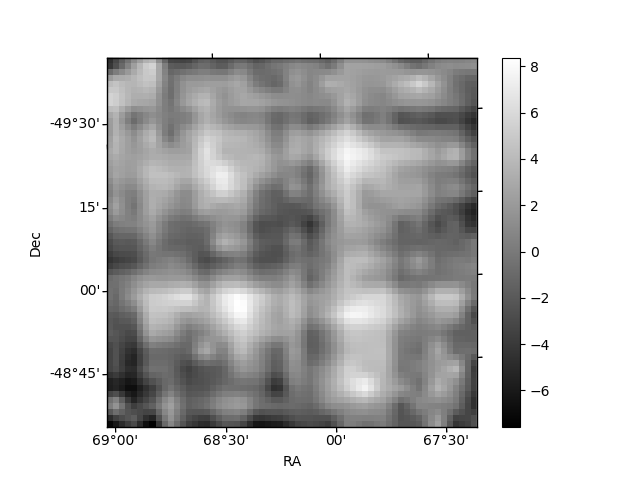
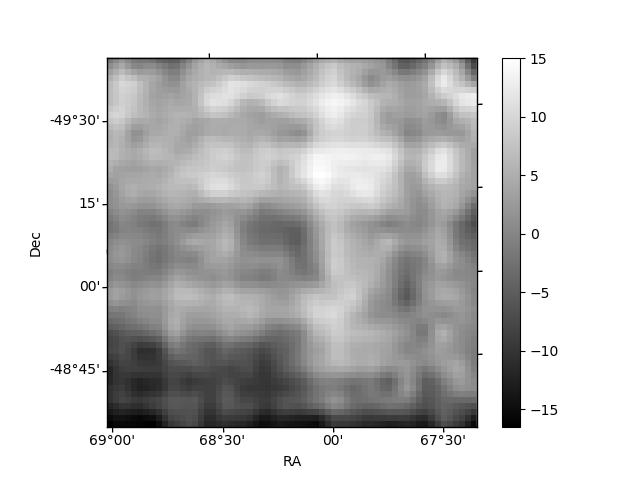
Histogram calculated using DETX and DETY for each event in the final _common_clean file
| Quadrant A | 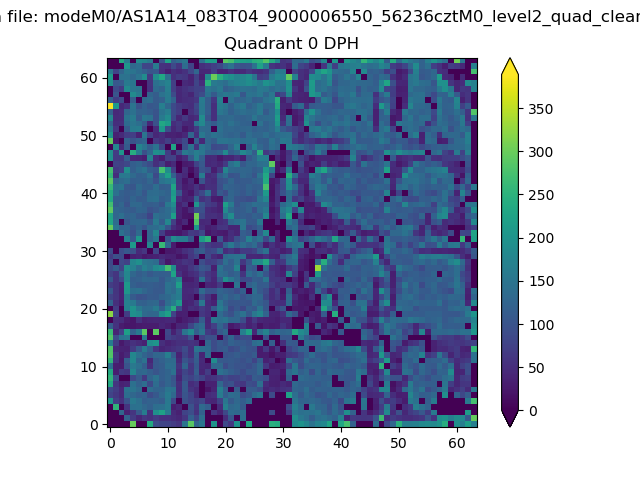 |
 |
Quadrant B |
|---|---|---|---|
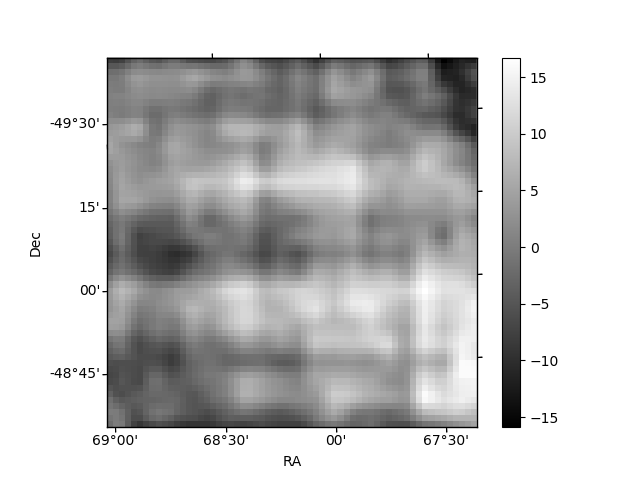
| Quadrant D | 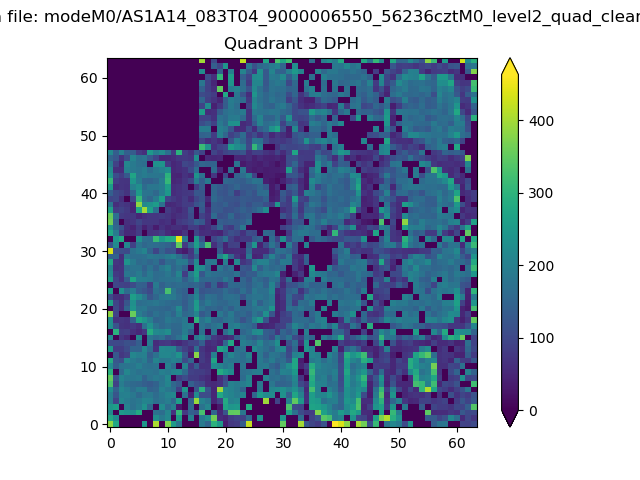 |
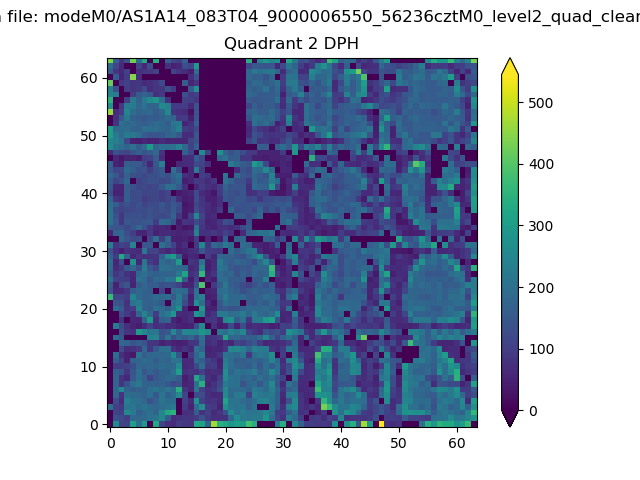 |
Quadrant C |
| Plot type | Count rate plots | Images |
|---|---|---|
| Comparison with Poisson distribution Blue bars denote a histogram of data divided into 1 sec bins. Red curve is a Poisson curve with rate = median count rate of data. |
 |
 |
| Quadrant-wise count rates Data is divided into 100 sec bins |
 |
|
| Module-wise count rates for Quadrant A Data is divided into 100 sec bins |
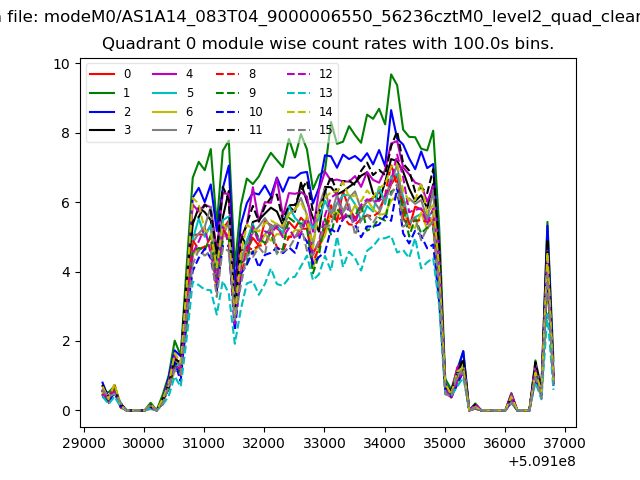 |
 |
| Module-wise count rates for Quadrant B Data is divided into 100 sec bins |
 |
 |
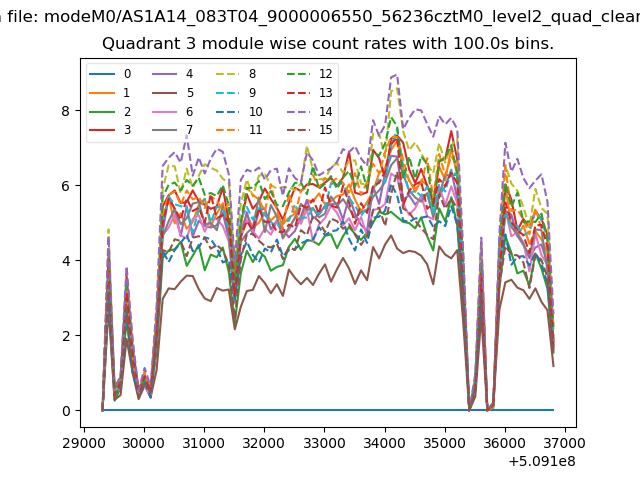
| Module-wise count rates for Quadrant C Data is divided into 100 sec bins |
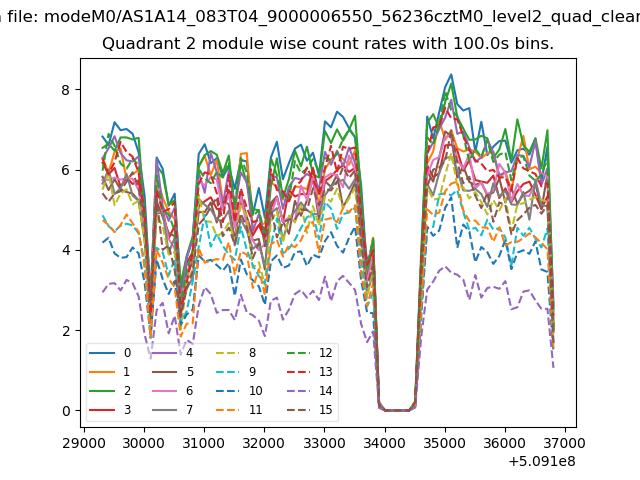 |
 |
| Module-wise count rates for Quadrant D Data is divided into 100 sec bins |
 |
 |
| Parameter | Plot |
|---|---|
| CZT HV Monitor | 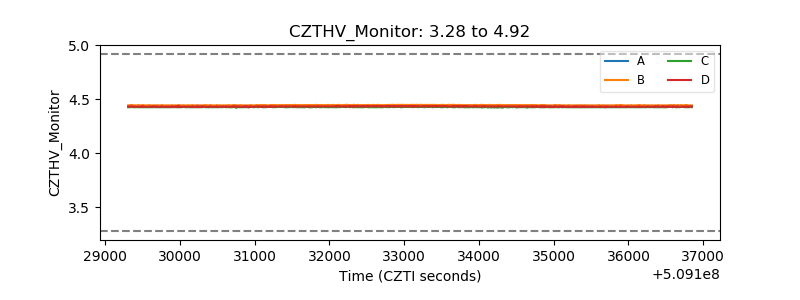 |
| D_VDD |  |
| Temperature 1 | 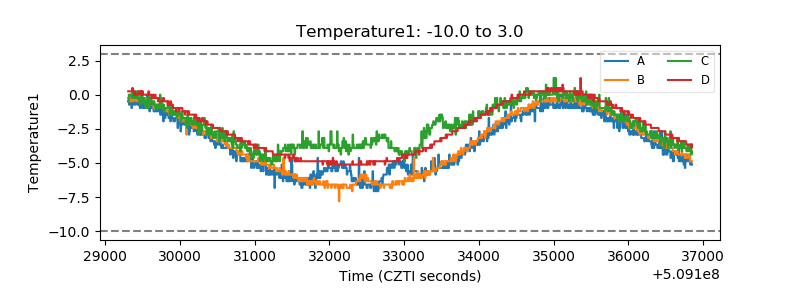 |
| Veto HV Monitor | 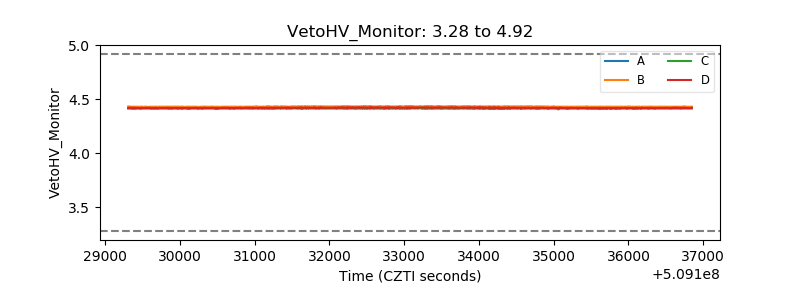 |
| Veto LLD |  |
| Alpha Counter |  |
| _CPM_Rate |  |
| CZT Counter | 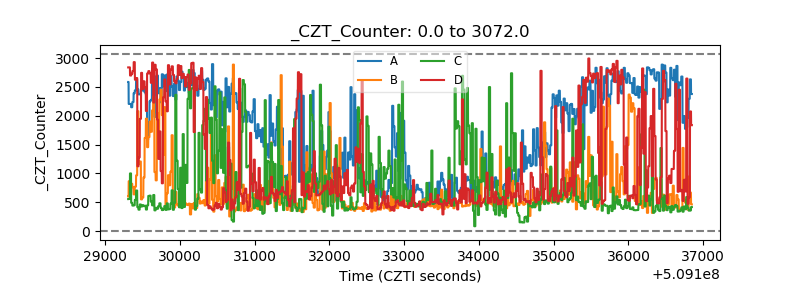 |
| +2.5 Volts monitor | 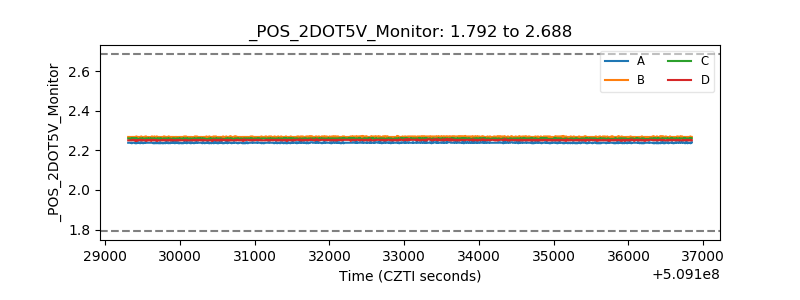 |
| +5 Volts monitor | 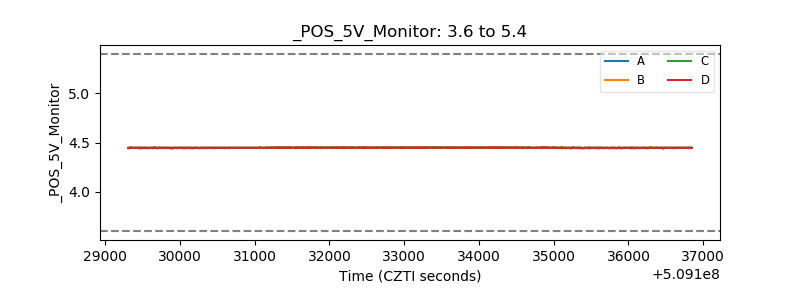 |
| _ROLL_ROT | 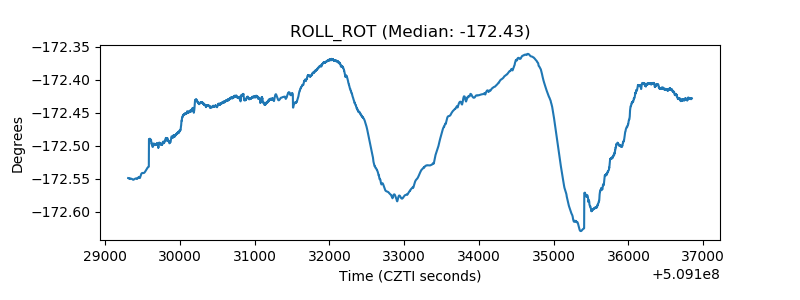 |
| _Roll_DEC | 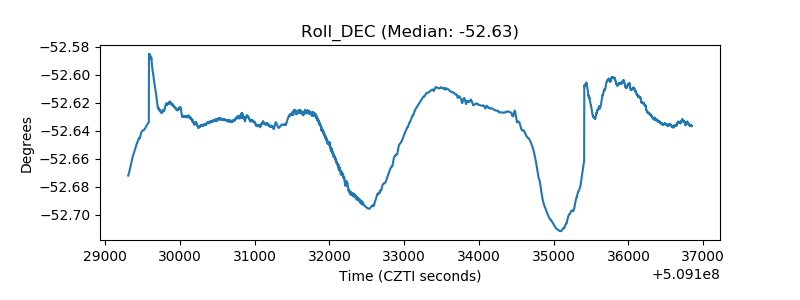 |
| _Roll_RA |  |
| Veto Counter | 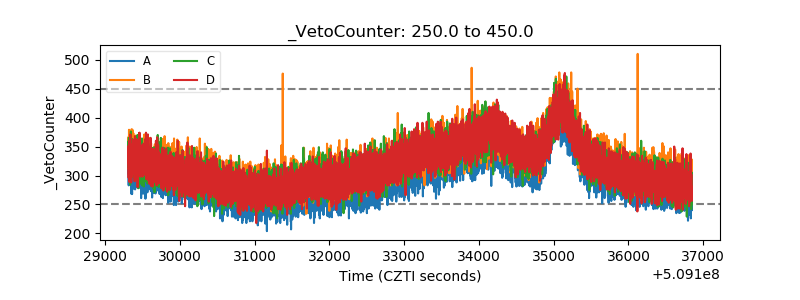 |