| Param | Original file | Final file |
|---|---|---|
| Filename | modeM0/AS1A14_083T04_9000006550_56239cztM0_level2.fits | modeM0/AS1A14_083T04_9000006550_56239cztM0_level2_quad_clean.evt |
| Size (bytes) | 1,764,325,440 | 172,964,160 |
| Size | 1.6 GB | 165.0 MB |
| Events in quadrant A | 26,714,432 | 747,746 |
| Events in quadrant B | 9,780,769 | 1,280,790 |
| Events in quadrant C | 9,373,359 | 1,146,946 |
| Events in quadrant D | 18,134,820 | 891,985 |
| Mode SS | |||
|---|---|---|---|
| Quadrant | BADHDUFLAG | Total packets | Discarded packets |
| A | 0 | 340 | 0 |
| B | 0 | 340 | 0 |
| C | 0 | 340 | 0 |
| D | 0 | 340 | 0 |
| Mode M9 | |||
|---|---|---|---|
| Quadrant | BADHDUFLAG | Total packets | Discarded packets |
| A | 0 | 4 | 0 |
| B | 0 | 4 | 0 |
| C | 0 | 4 | 0 |
| D | 0 | 4 | 0 |
| Mode M0 | |||
|---|---|---|---|
| Quadrant | BADHDUFLAG | Total packets | Discarded packets |
| A | 0 | 91326 | 1 |
| B | 0 | 41202 | 2 |
| C | 0 | 40551 | 1 |
| D | 0 | 65783 | 1 |
| Quadrant | Total seconds | Saturated seconds | Saturation percentage |
|---|---|---|---|
| A | 16936 | 6333 | 37.393718% |
| B | 16935 | 477 | 2.816652% |
| C | 16936 | 562 | 3.318375% |
| D | 16936 | 3002 | 17.725555% |
Noise dominated data is calculated using 1-second bins in cleaned event files. If a bin has >2000 counts, and if more than 50% of those come from <1% of pixels, then it is considered to be noise-dominated and hence unusable.
| Quadrant | # 1 sec bins | Bins with >0 counts | Bins with >2000 counts | High rate bins dominated by noise | Noise dominated (total time) | Noise dominated (detector-on time) | Marked lightcurve |
|---|---|---|---|---|---|---|---|
| A | 17620 | 17155 | 5745 | 5745 | 32.60% | 33.49% |  |
| B | 17619 | 17220 | 232 | 232 | 1.32% | 1.35% |  |
| C | 17620 | 17218 | 403 | 403 | 2.29% | 2.34% |  |
| D | 17620 | 17149 | 2831 | 2831 | 16.07% | 16.51% | 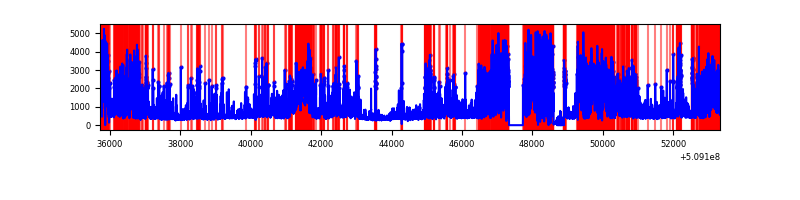 |
Top three noisy pixels from each quadrant. If the there are fewer than three noisy pixels in the level2.evt file, extra rows are filled as -1
| Pixel properties | Quadrant properties | ||||||
|---|---|---|---|---|---|---|---|
| Quadrant | DetID | PixID | Counts | Sigma | Mean | Median | Sigma |
| A | 15 | 32 | 11041962 | 30256.95 | 1463 | 1432 | 364.9 |
| A | 8 | 176 | 7320662 | 20058.6 | 1463 | 1432 | 364.9 |
| A | 12 | 115 | 1378650 | 3774.31 | 1463 | 1432 | 364.9 |
| B | 4 | 171 | 862315 | 2314.31 | 1747 | 1681 | 371.9 |
| B | 5 | 185 | 468709 | 1255.87 | 1747 | 1681 | 371.9 |
| B | 10 | 247 | 278399 | 744.12 | 1747 | 1681 | 371.9 |
| C | 12 | 252 | 745526 | 1612.45 | 1688 | 1675 | 461.3 |
| C | 5 | 250 | 716759 | 1550.09 | 1688 | 1675 | 461.3 |
| C | 15 | 148 | 246904 | 531.58 | 1688 | 1675 | 461.3 |
| D | 8 | 129 | 7824022 | 17579.58 | 1552 | 1481 | 445.0 |
| D | 2 | 249 | 1406707 | 3157.96 | 1552 | 1481 | 445.0 |
| D | 15 | 115 | 845002 | 1895.64 | 1552 | 1481 | 445.0 |
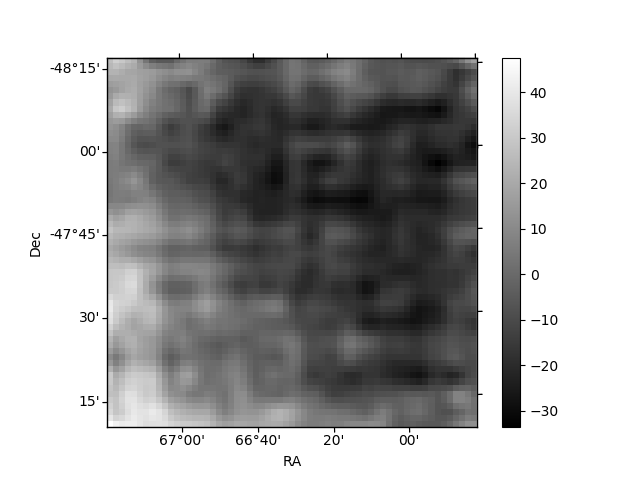
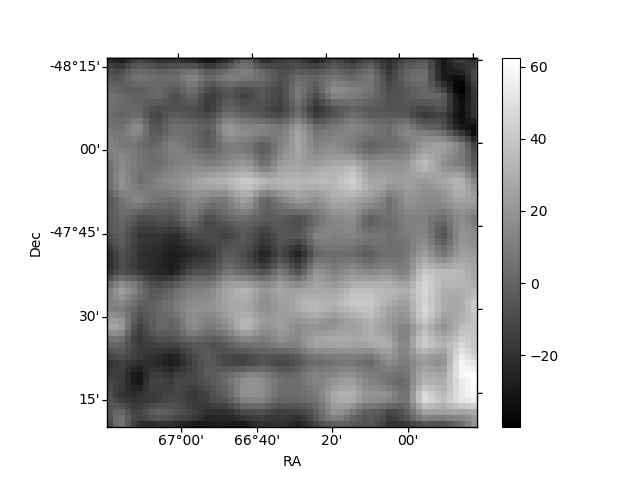
Histogram calculated using DETX and DETY for each event in the final _common_clean file
| Quadrant A |  |
 |
Quadrant B |
|---|---|---|---|
| Quadrant D | 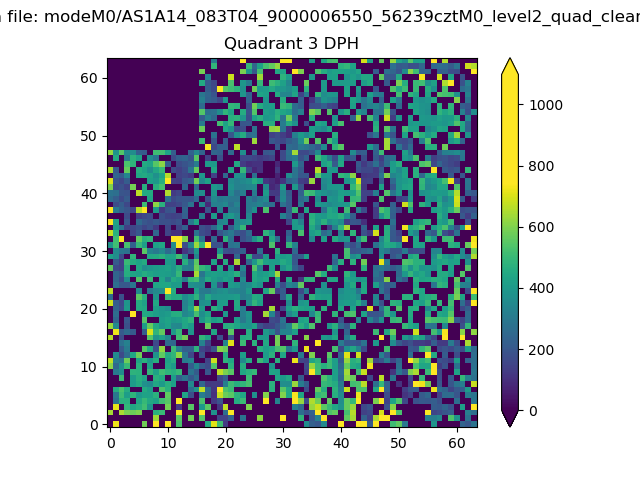 |
 |
Quadrant C |
| Plot type | Count rate plots | Images |
|---|---|---|
| Comparison with Poisson distribution Blue bars denote a histogram of data divided into 1 sec bins. Red curve is a Poisson curve with rate = median count rate of data. |
 |
 |
| Quadrant-wise count rates Data is divided into 100 sec bins |
 |
|
| Module-wise count rates for Quadrant A Data is divided into 100 sec bins |
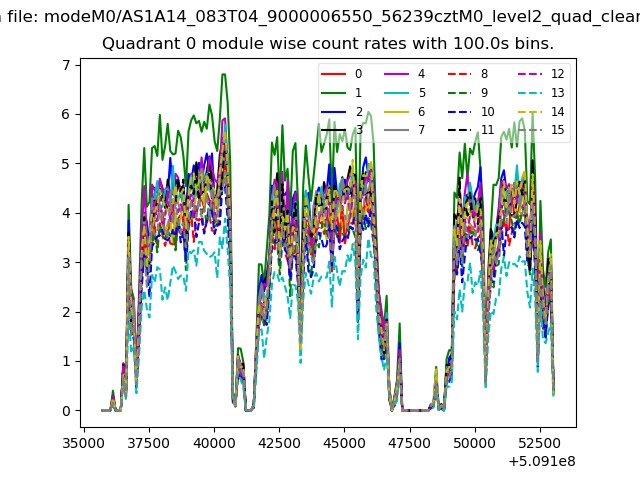 |
 |
| Module-wise count rates for Quadrant B Data is divided into 100 sec bins |
 |
 |
| Module-wise count rates for Quadrant C Data is divided into 100 sec bins |
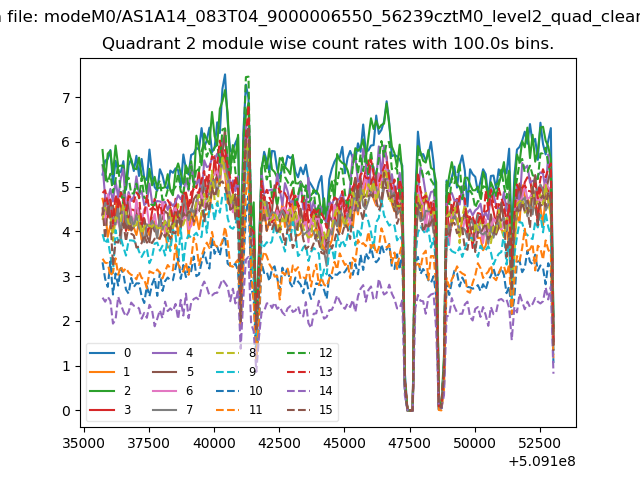 |
 |
| Module-wise count rates for Quadrant D Data is divided into 100 sec bins |
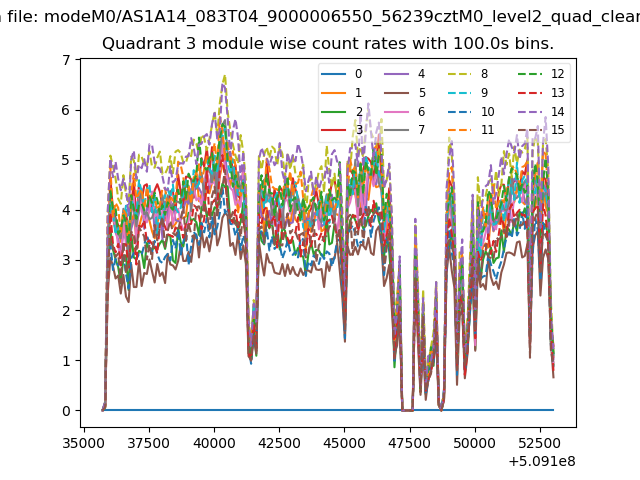 |
 |
| Parameter | Plot |
|---|---|
| CZT HV Monitor | 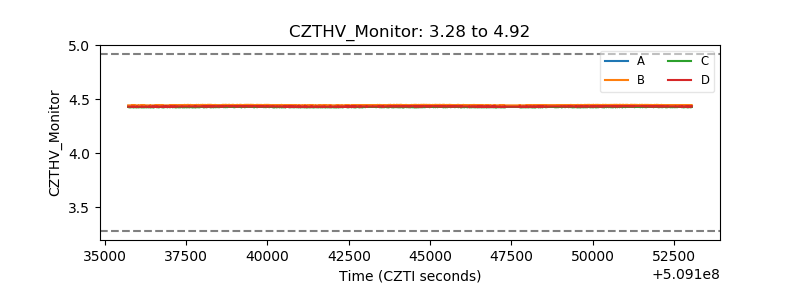 |
| D_VDD |  |
| Temperature 1 | 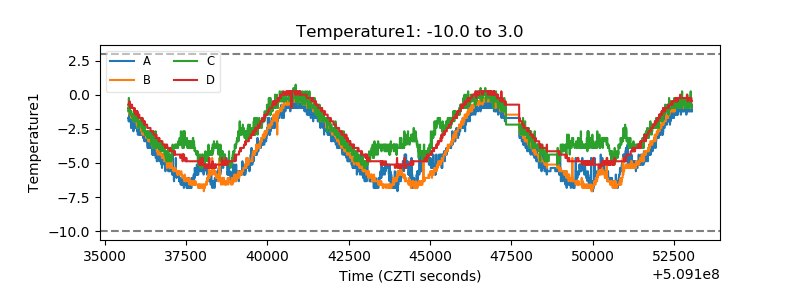 |
| Veto HV Monitor |  |
| Veto LLD |  |
| Alpha Counter | 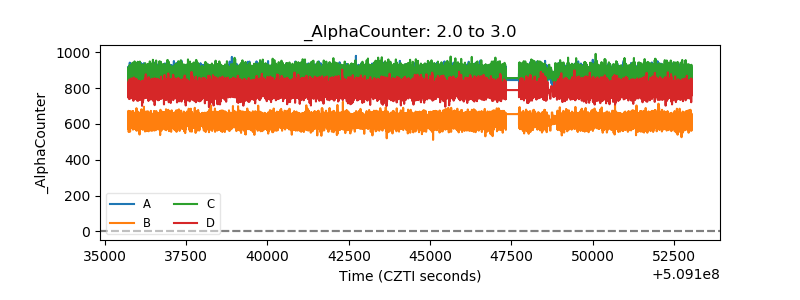 |
| _CPM_Rate |  |
| CZT Counter | 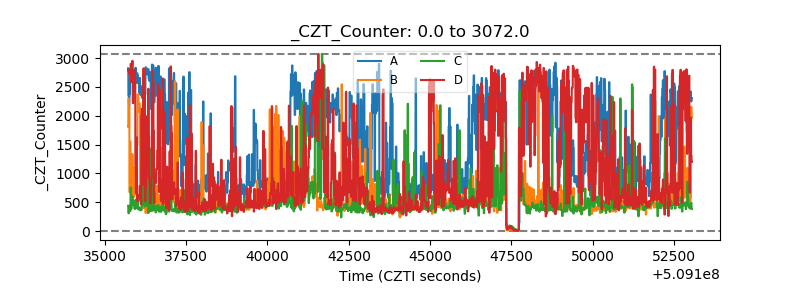 |
| +2.5 Volts monitor | 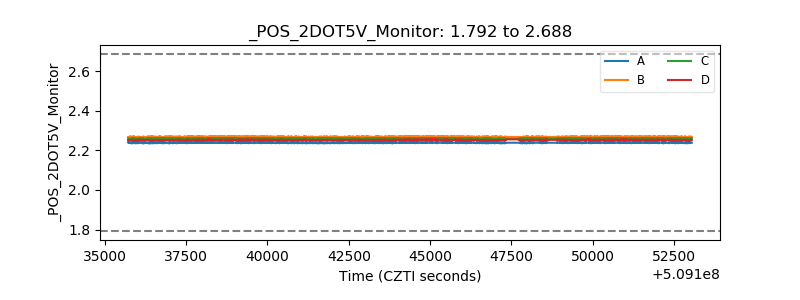 |
| +5 Volts monitor |  |
| _ROLL_ROT | 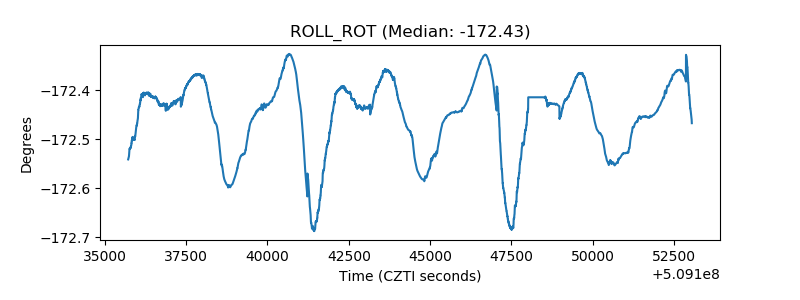 |
| _Roll_DEC | 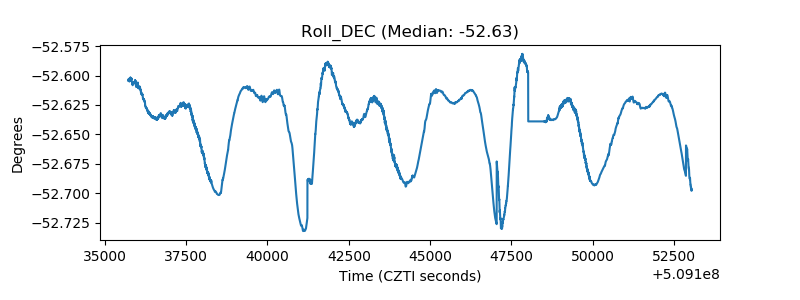 |
| _Roll_RA |  |
| Veto Counter | 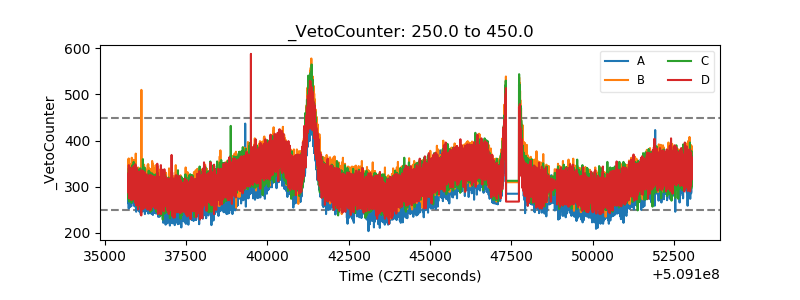 |