| Param | Original file | Final file |
|---|---|---|
| Filename | modeM0/AS1A14_083T04_9000006550_56240cztM0_level2.fits | modeM0/AS1A14_083T04_9000006550_56240cztM0_level2_quad_clean.evt |
| Size (bytes) | 937,696,320 | 80,760,960 |
| Size | 894.3 MB | 77.0 MB |
| Events in quadrant A | 14,986,277 | 305,694 |
| Events in quadrant B | 4,562,207 | 656,025 |
| Events in quadrant C | 4,045,906 | 562,910 |
| Events in quadrant D | 10,520,357 | 384,587 |
| Mode SS | |||
|---|---|---|---|
| Quadrant | BADHDUFLAG | Total packets | Discarded packets |
| A | 0 | 158 | 0 |
| B | 0 | 158 | 0 |
| C | 0 | 158 | 0 |
| D | 0 | 158 | 0 |
| Mode M9 | |||
|---|---|---|---|
| Quadrant | BADHDUFLAG | Total packets | Discarded packets |
| A | 0 | 14 | 0 |
| B | 0 | 14 | 0 |
| C | 0 | 14 | 0 |
| D | 0 | 14 | 0 |
| Mode M0 | |||
|---|---|---|---|
| Quadrant | BADHDUFLAG | Total packets | Discarded packets |
| A | 0 | 49891 | 2 |
| B | 0 | 19147 | 2 |
| C | 0 | 17891 | 2 |
| D | 0 | 36628 | 2 |
| Quadrant | Total seconds | Saturated seconds | Saturation percentage |
|---|---|---|---|
| A | 7698 | 4299 | 55.845674% |
| B | 7699 | 310 | 4.026497% |
| C | 7699 | 239 | 3.104299% |
| D | 7699 | 2299 | 29.861021% |
Noise dominated data is calculated using 1-second bins in cleaned event files. If a bin has >2000 counts, and if more than 50% of those come from <1% of pixels, then it is considered to be noise-dominated and hence unusable.
| Quadrant | # 1 sec bins | Bins with >0 counts | Bins with >2000 counts | High rate bins dominated by noise | Noise dominated (total time) | Noise dominated (detector-on time) | Marked lightcurve |
|---|---|---|---|---|---|---|---|
| A | 9395 | 7939 | 3987 | 3987 | 42.44% | 50.22% |  |
| B | 9396 | 7983 | 160 | 160 | 1.70% | 2.00% | 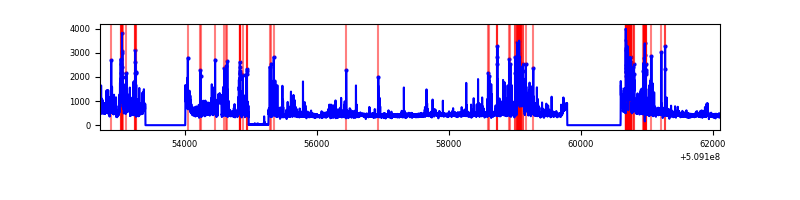 |
| C | 9396 | 7983 | 140 | 140 | 1.49% | 1.75% |  |
| D | 9396 | 7937 | 2148 | 2148 | 22.86% | 27.06% |  |
Top three noisy pixels from each quadrant. If the there are fewer than three noisy pixels in the level2.evt file, extra rows are filled as -1
| Pixel properties | Quadrant properties | ||||||
|---|---|---|---|---|---|---|---|
| Quadrant | DetID | PixID | Counts | Sigma | Mean | Median | Sigma |
| A | 8 | 176 | 3289952 | 21525.4 | 608 | 593 | 152.8 |
| A | 7 | 64 | 3108731 | 20339.5 | 608 | 593 | 152.8 |
| A | 15 | 32 | 2469994 | 16159.64 | 608 | 593 | 152.8 |
| B | 4 | 171 | 288597 | 1674.15 | 800 | 771 | 171.9 |
| B | 8 | 128 | 234123 | 1357.3 | 800 | 771 | 171.9 |
| B | 4 | 206 | 219658 | 1273.17 | 800 | 771 | 171.9 |
| C | 5 | 250 | 334509 | 1561.92 | 778 | 770 | 213.7 |
| C | 15 | 230 | 334032 | 1559.69 | 778 | 770 | 213.7 |
| C | 6 | 223 | 158500 | 738.19 | 778 | 770 | 213.7 |
| D | 8 | 129 | 6324554 | 32859.53 | 676 | 643 | 192.5 |
| D | 2 | 249 | 562066 | 2917.2 | 676 | 643 | 192.5 |
| D | 15 | 115 | 218223 | 1130.56 | 676 | 643 | 192.5 |
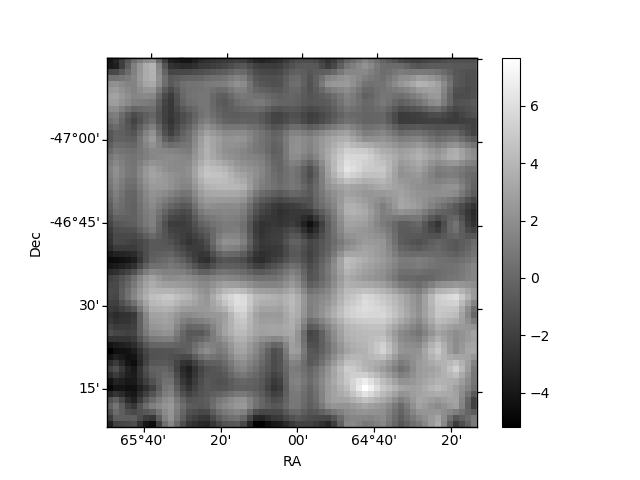
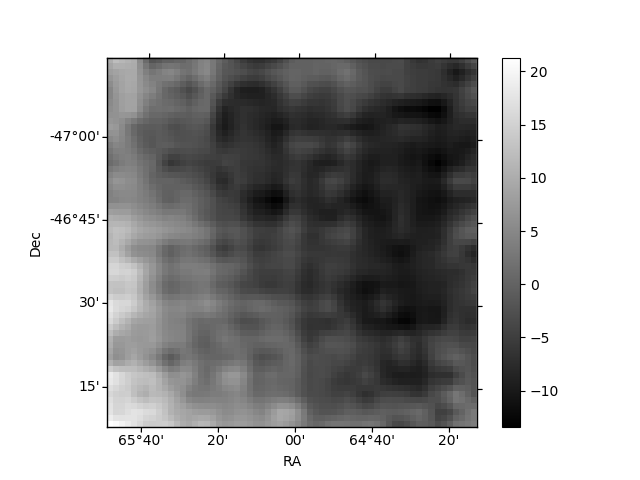
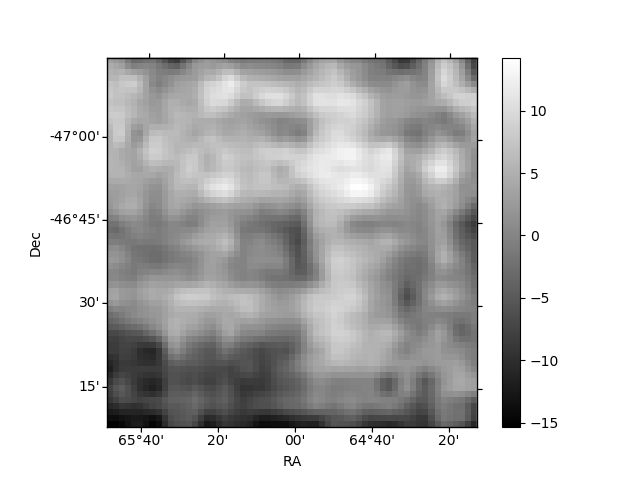
Histogram calculated using DETX and DETY for each event in the final _common_clean file
| Quadrant A | 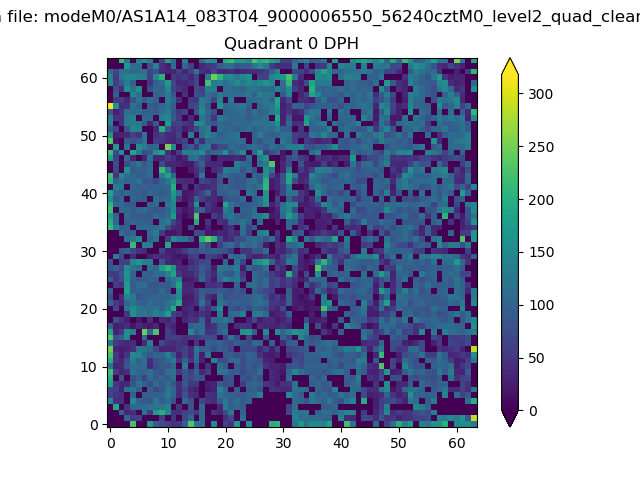 |
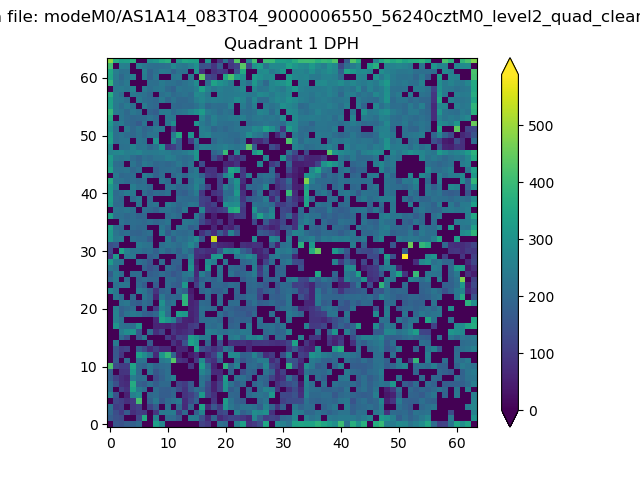 |
Quadrant B |
|---|---|---|---|
| Quadrant D | 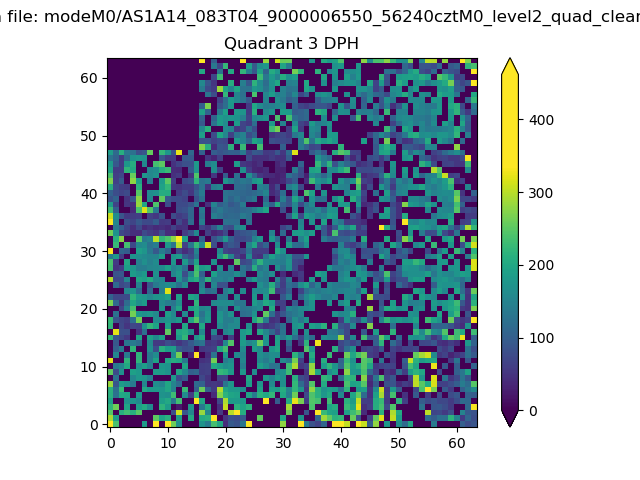 |
 |
Quadrant C |
| Plot type | Count rate plots | Images |
|---|---|---|
| Comparison with Poisson distribution Blue bars denote a histogram of data divided into 1 sec bins. Red curve is a Poisson curve with rate = median count rate of data. |
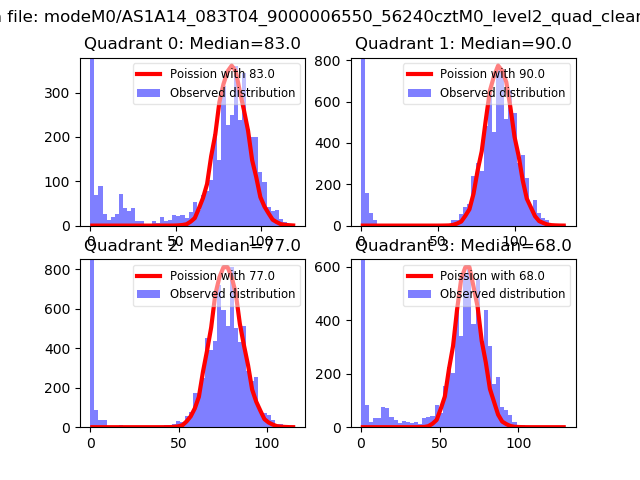 |
 |
| Quadrant-wise count rates Data is divided into 100 sec bins |
 |
|
| Module-wise count rates for Quadrant A Data is divided into 100 sec bins |
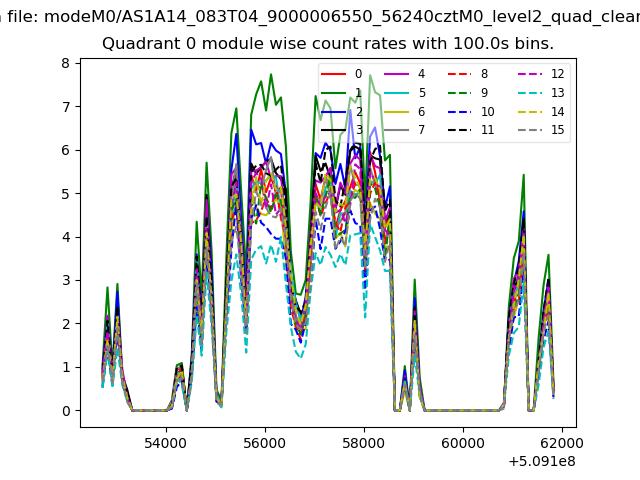 |
 |
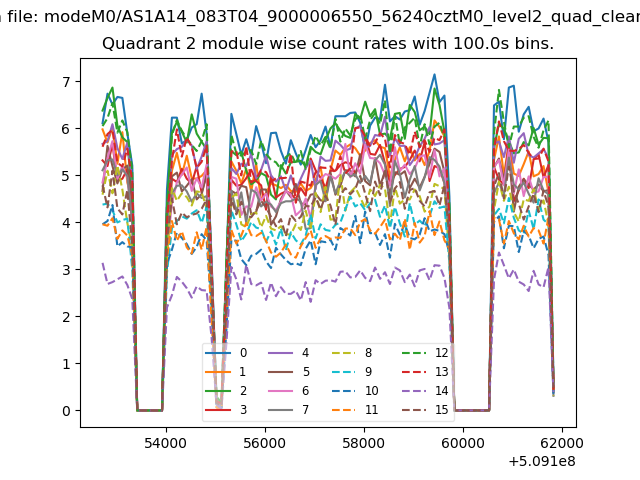
| Module-wise count rates for Quadrant B Data is divided into 100 sec bins |
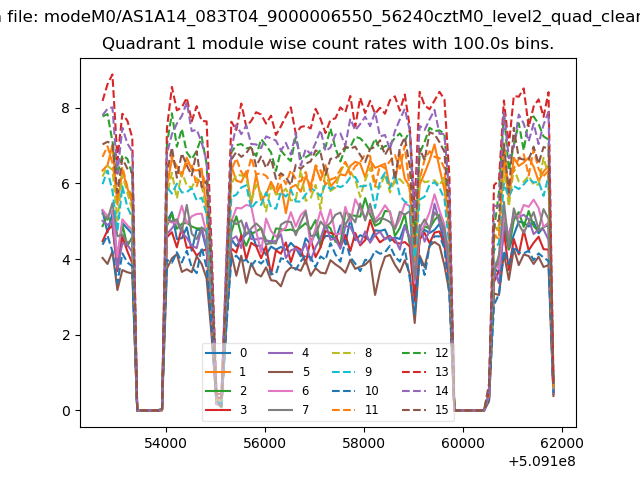 |
 |
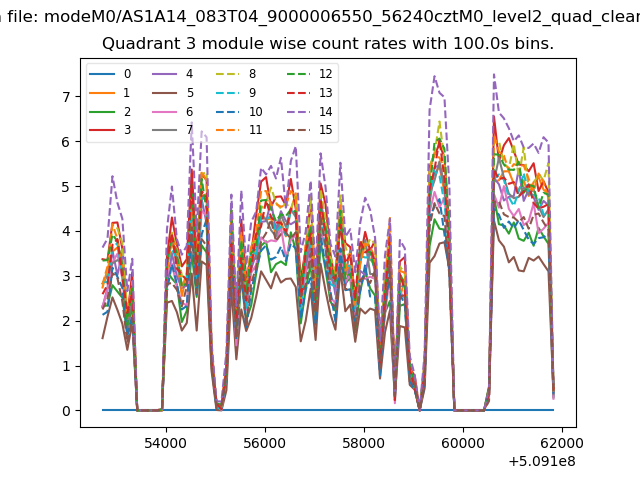
| Module-wise count rates for Quadrant C Data is divided into 100 sec bins |
 |
 |
| Module-wise count rates for Quadrant D Data is divided into 100 sec bins |
 |
 |
| Parameter | Plot |
|---|---|
| CZT HV Monitor | 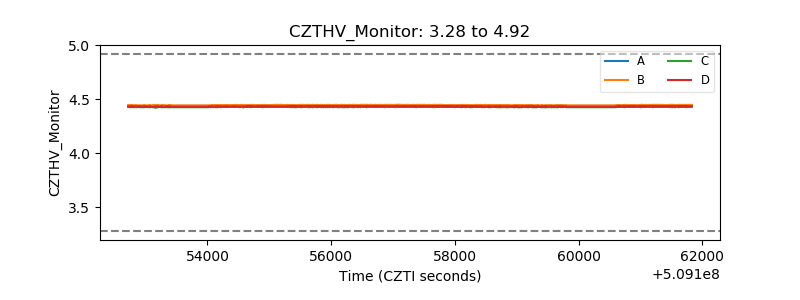 |
| D_VDD | 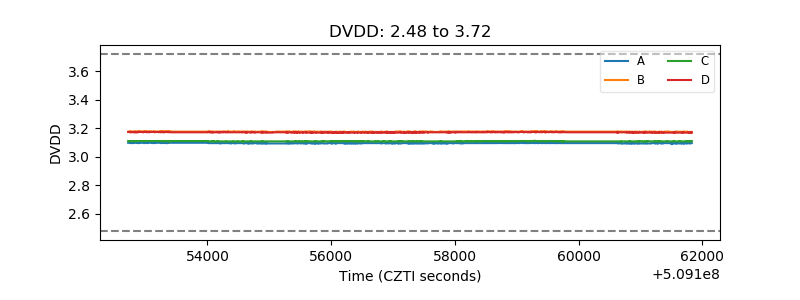 |
| Temperature 1 |  |
| Veto HV Monitor |  |
| Veto LLD |  |
| Alpha Counter | 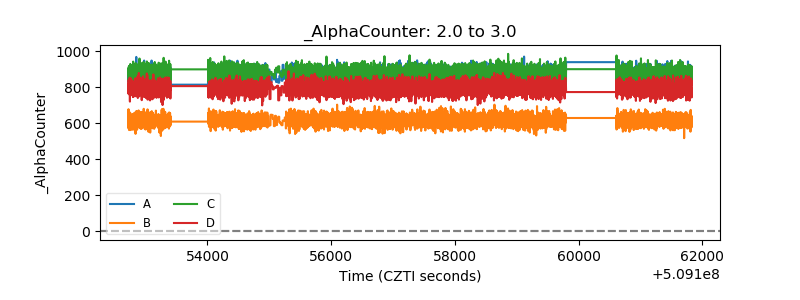 |
| _CPM_Rate | 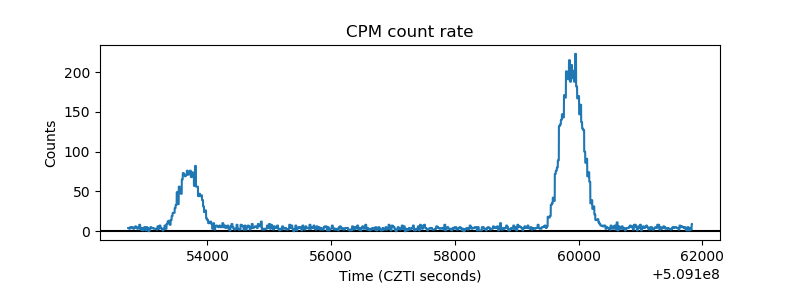 |
| CZT Counter |  |
| +2.5 Volts monitor |  |
| +5 Volts monitor |  |
| _ROLL_ROT |  |
| _Roll_DEC |  |
| _Roll_RA | 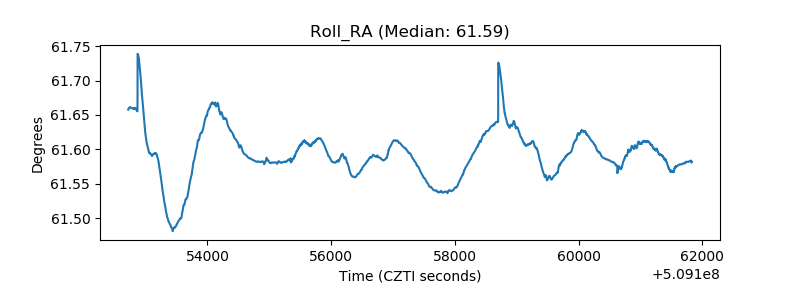 |
| Veto Counter |  |