| Param | Original file | Final file |
|---|---|---|
| Filename | modeM0/AS1A14_083T04_9000006550_56241cztM0_level2.fits | modeM0/AS1A14_083T04_9000006550_56241cztM0_level2_quad_clean.evt |
| Size (bytes) | 829,825,920 | 84,332,160 |
| Size | 791.4 MB | 80.4 MB |
| Events in quadrant A | 15,182,049 | 230,107 |
| Events in quadrant B | 4,741,854 | 688,102 |
| Events in quadrant C | 4,890,253 | 589,918 |
| Events in quadrant D | 5,352,533 | 550,816 |
| Mode SS | |||
|---|---|---|---|
| Quadrant | BADHDUFLAG | Total packets | Discarded packets |
| A | 0 | 144 | 0 |
| B | 0 | 144 | 0 |
| C | 0 | 144 | 0 |
| D | 0 | 144 | 0 |
| Mode M9 | |||
|---|---|---|---|
| Quadrant | BADHDUFLAG | Total packets | Discarded packets |
| A | 0 | 18 | 0 |
| B | 0 | 18 | 0 |
| C | 0 | 18 | 0 |
| D | 0 | 18 | 0 |
| Mode M0 | |||
|---|---|---|---|
| Quadrant | BADHDUFLAG | Total packets | Discarded packets |
| A | 0 | 49991 | 2 |
| B | 0 | 19301 | 2 |
| C | 0 | 19690 | 2 |
| D | 0 | 20837 | 2 |
| Quadrant | Total seconds | Saturated seconds | Saturation percentage |
|---|---|---|---|
| A | 7103 | 4937 | 69.505843% |
| B | 7103 | 497 | 6.997044% |
| C | 7103 | 624 | 8.785020% |
| D | 7103 | 671 | 9.446713% |
Noise dominated data is calculated using 1-second bins in cleaned event files. If a bin has >2000 counts, and if more than 50% of those come from <1% of pixels, then it is considered to be noise-dominated and hence unusable.
| Quadrant | # 1 sec bins | Bins with >0 counts | Bins with >2000 counts | High rate bins dominated by noise | Noise dominated (total time) | Noise dominated (detector-on time) | Marked lightcurve |
|---|---|---|---|---|---|---|---|
| A | 8873 | 7105 | 4542 | 4542 | 51.19% | 63.93% | 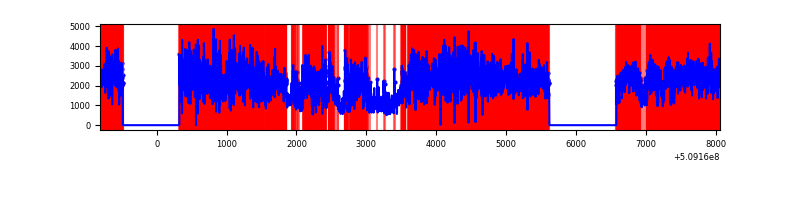 |
| B | 8873 | 7105 | 299 | 299 | 3.37% | 4.21% |  |
| C | 8873 | 7105 | 392 | 392 | 4.42% | 5.52% |  |
| D | 8873 | 7105 | 543 | 543 | 6.12% | 7.64% | 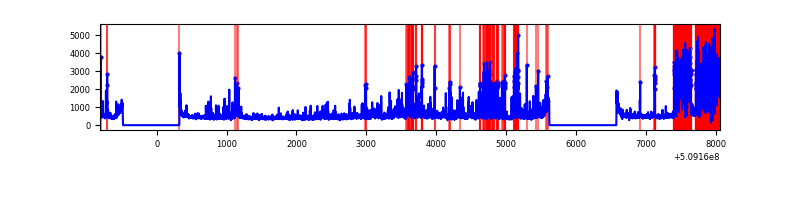 |
Top three noisy pixels from each quadrant. If the there are fewer than three noisy pixels in the level2.evt file, extra rows are filled as -1
| Pixel properties | Quadrant properties | ||||||
|---|---|---|---|---|---|---|---|
| Quadrant | DetID | PixID | Counts | Sigma | Mean | Median | Sigma |
| A | 15 | 32 | 4727565 | 35524.93 | 527 | 514 | 133.1 |
| A | 7 | 64 | 2895045 | 21753.1 | 527 | 514 | 133.1 |
| A | 12 | 115 | 2452971 | 18430.81 | 527 | 514 | 133.1 |
| B | 4 | 206 | 1014812 | 6414.69 | 737 | 708 | 158.1 |
| B | 8 | 128 | 243811 | 1537.74 | 737 | 708 | 158.1 |
| B | 5 | 185 | 193659 | 1220.51 | 737 | 708 | 158.1 |
| C | 5 | 250 | 1184475 | 6142.57 | 706 | 701 | 192.7 |
| C | 15 | 230 | 513876 | 2662.85 | 706 | 701 | 192.7 |
| C | 5 | 233 | 144873 | 748.1 | 706 | 701 | 192.7 |
| D | 8 | 129 | 1723300 | 8661.52 | 699 | 664 | 198.9 |
| D | 2 | 249 | 253664 | 1272.1 | 699 | 664 | 198.9 |
| D | 6 | 239 | 250273 | 1255.05 | 699 | 664 | 198.9 |
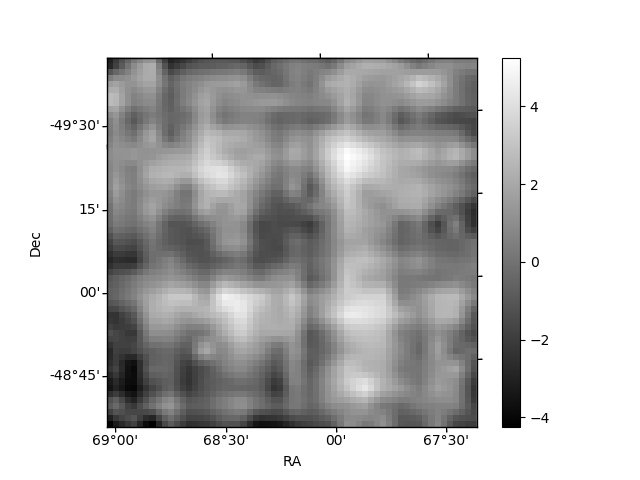
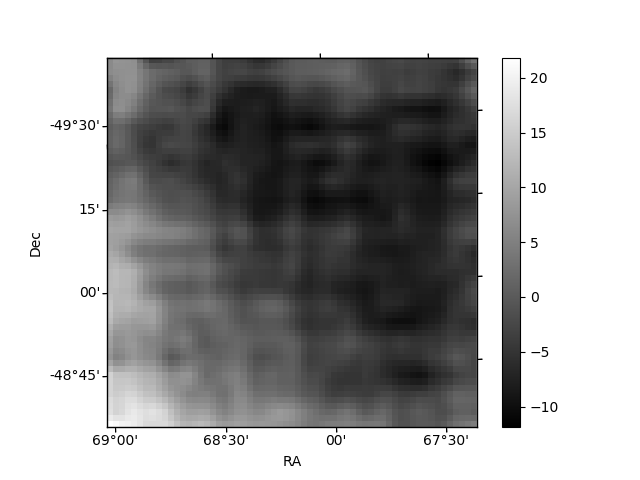
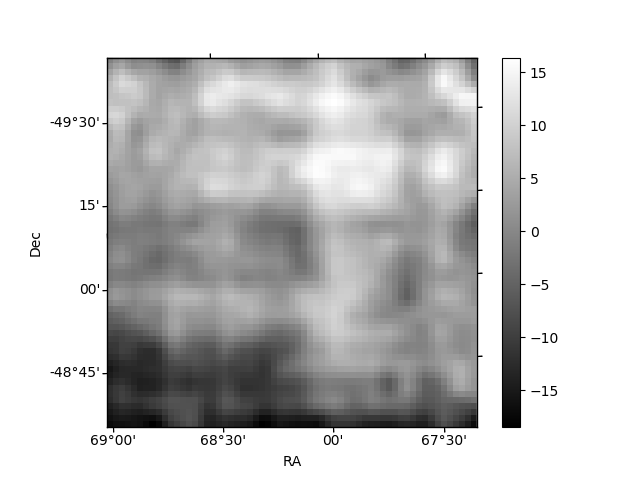
Histogram calculated using DETX and DETY for each event in the final _common_clean file
| Quadrant A | 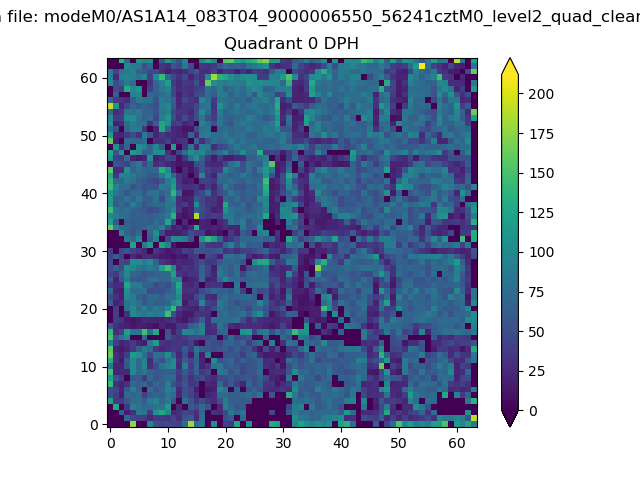 |
 |
Quadrant B |
|---|---|---|---|
| Quadrant D | 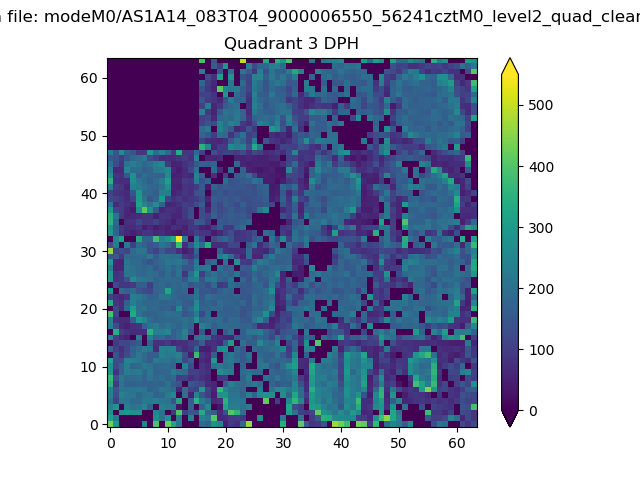 |
 |
Quadrant C |
| Plot type | Count rate plots | Images |
|---|---|---|
| Comparison with Poisson distribution Blue bars denote a histogram of data divided into 1 sec bins. Red curve is a Poisson curve with rate = median count rate of data. |
 |
 |
| Quadrant-wise count rates Data is divided into 100 sec bins |
 |
|
| Module-wise count rates for Quadrant A Data is divided into 100 sec bins |
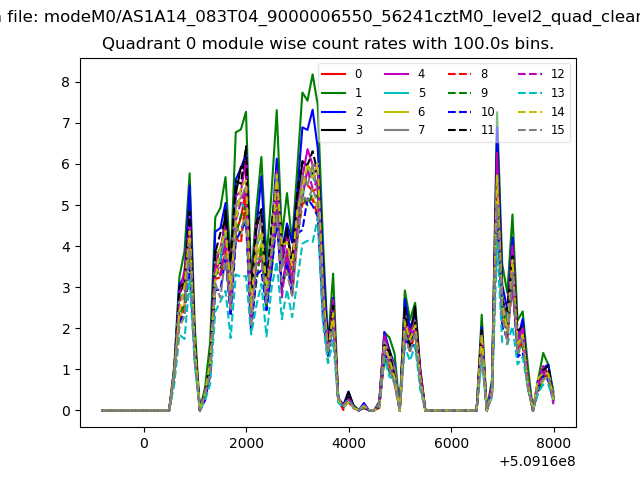 |
 |
| Module-wise count rates for Quadrant B Data is divided into 100 sec bins |
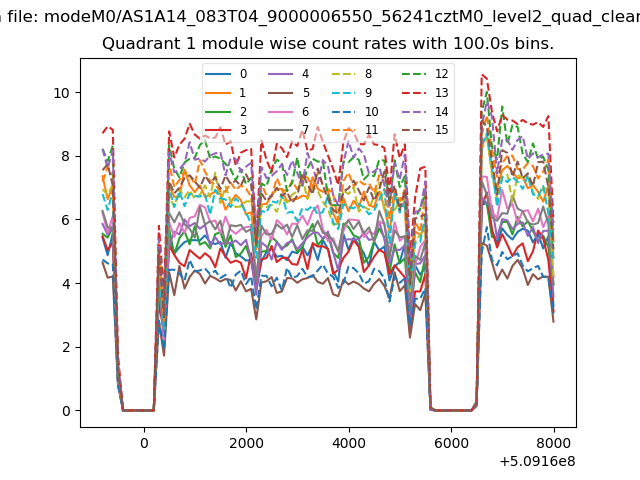 |
 |
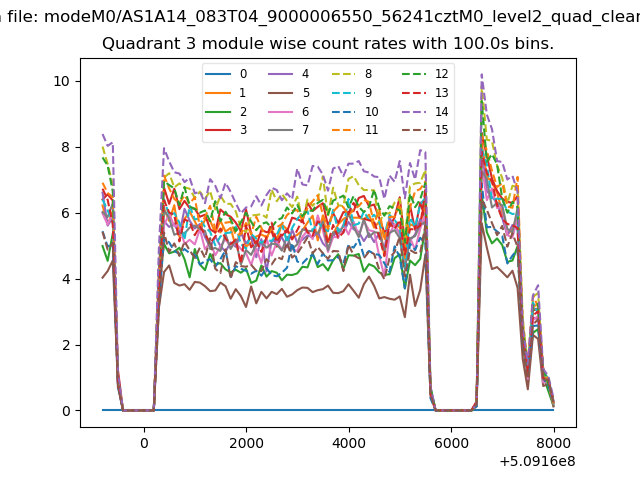
| Module-wise count rates for Quadrant C Data is divided into 100 sec bins |
 |
 |
| Module-wise count rates for Quadrant D Data is divided into 100 sec bins |
 |
 |
| Parameter | Plot |
|---|---|
| CZT HV Monitor | 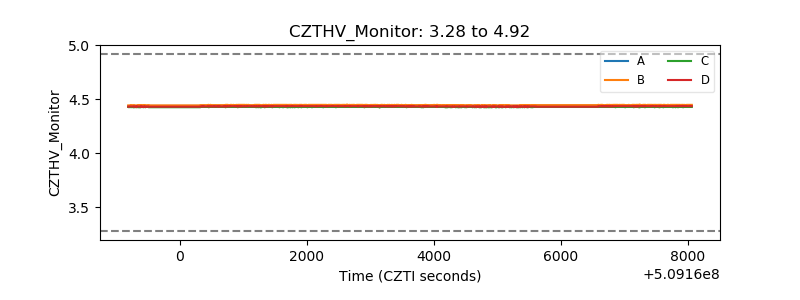 |
| D_VDD |  |
| Temperature 1 | 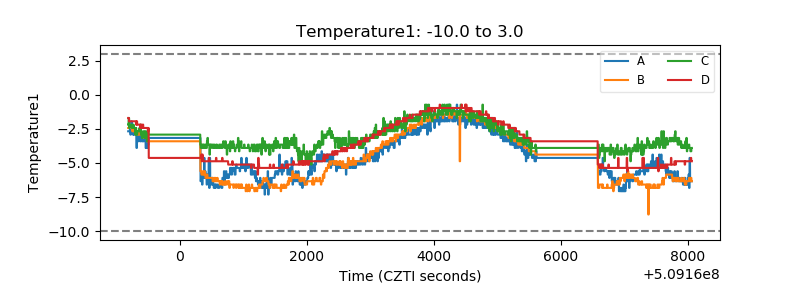 |
| Veto HV Monitor | 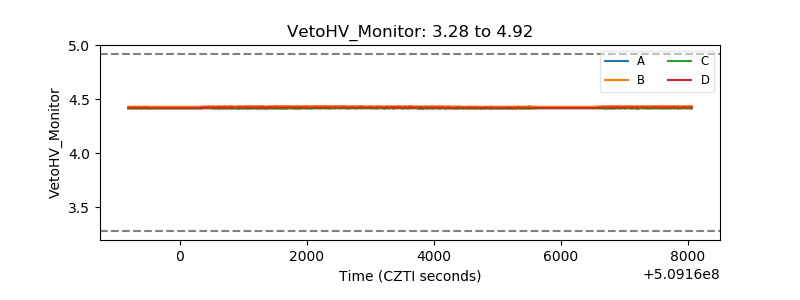 |
| Veto LLD |  |
| Alpha Counter |  |
| _CPM_Rate |  |
| CZT Counter | 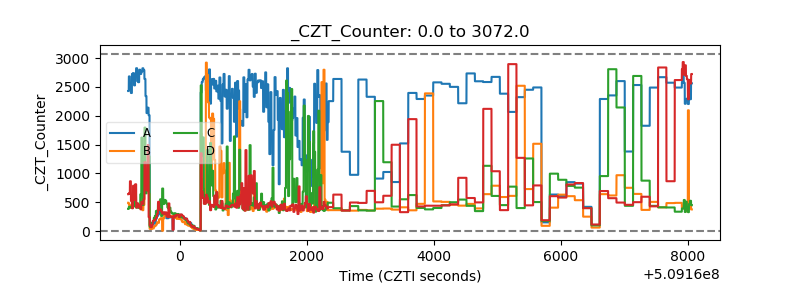 |
| +2.5 Volts monitor | 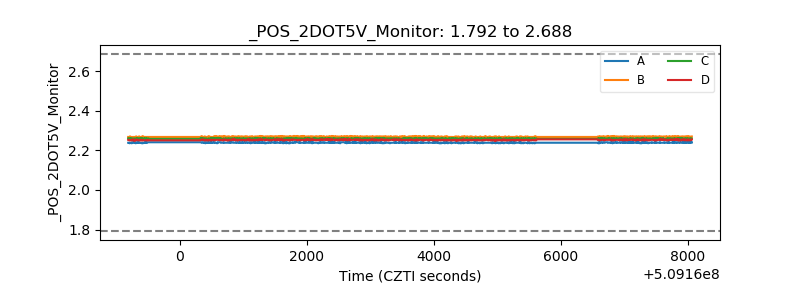 |
| +5 Volts monitor | 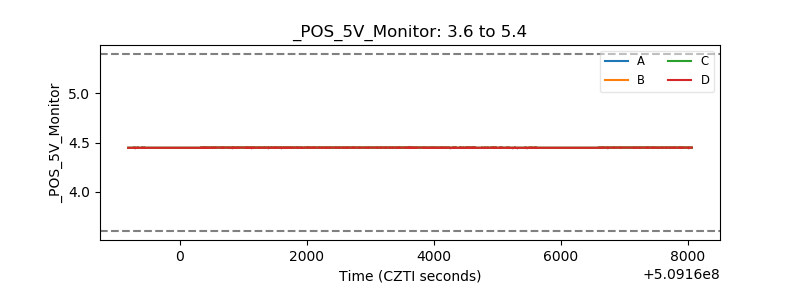 |
| _ROLL_ROT | 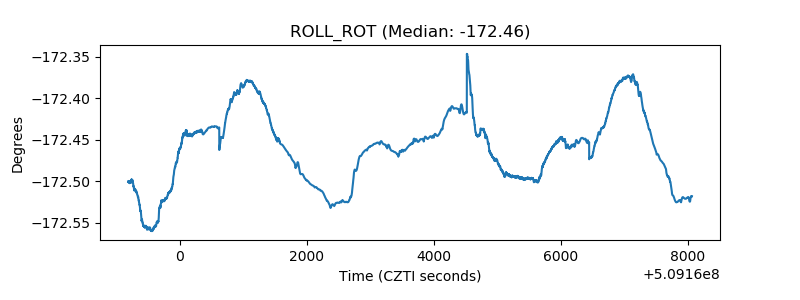 |
| _Roll_DEC | 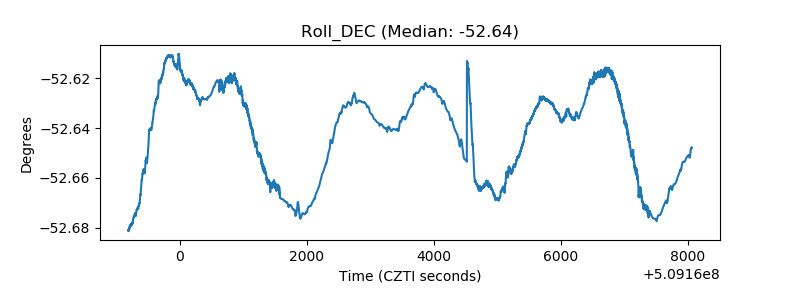 |
| _Roll_RA |  |
| Veto Counter | 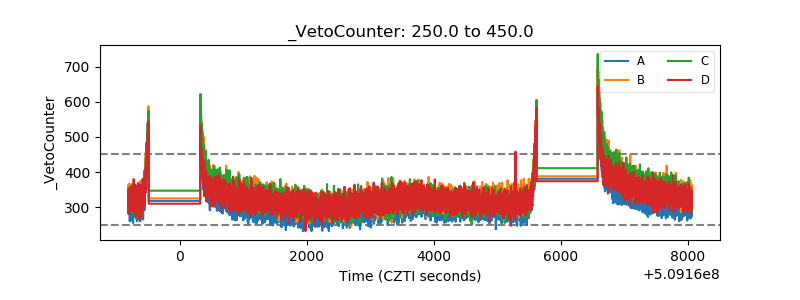 |