| Param | Original file | Final file |
|---|---|---|
| Filename | modeM0/AS1A14_049T01_9000006552_56247cztM0_level2.fits | modeM0/AS1A14_049T01_9000006552_56247cztM0_level2_quad_clean.evt |
| Size (bytes) | 794,793,600 | 75,225,600 |
| Size | 758.0 MB | 71.7 MB |
| Events in quadrant A | 13,487,701 | 215,880 |
| Events in quadrant B | 4,011,094 | 635,026 |
| Events in quadrant C | 3,433,869 | 573,763 |
| Events in quadrant D | 8,003,015 | 416,015 |
| Mode SS | |||
|---|---|---|---|
| Quadrant | BADHDUFLAG | Total packets | Discarded packets |
| A | 0 | 128 | 0 |
| B | 0 | 128 | 0 |
| C | 0 | 128 | 0 |
| D | 0 | 128 | 0 |
| Mode M9 | |||
|---|---|---|---|
| Quadrant | BADHDUFLAG | Total packets | Discarded packets |
| A | 0 | 10 | 0 |
| B | 0 | 10 | 0 |
| C | 0 | 10 | 0 |
| D | 0 | 10 | 0 |
| Mode M0 | |||
|---|---|---|---|
| Quadrant | BADHDUFLAG | Total packets | Discarded packets |
| A | 0 | 44355 | 1 |
| B | 0 | 16226 | 1 |
| C | 0 | 14884 | 1 |
| D | 0 | 28111 | 1 |
| Quadrant | Total seconds | Saturated seconds | Saturation percentage |
|---|---|---|---|
| A | 6254 | 4361 | 69.731372% |
| B | 6254 | 309 | 4.940838% |
| C | 6255 | 239 | 3.820943% |
| D | 6255 | 1628 | 26.027178% |
Noise dominated data is calculated using 1-second bins in cleaned event files. If a bin has >2000 counts, and if more than 50% of those come from <1% of pixels, then it is considered to be noise-dominated and hence unusable.
| Quadrant | # 1 sec bins | Bins with >0 counts | Bins with >2000 counts | High rate bins dominated by noise | Noise dominated (total time) | Noise dominated (detector-on time) | Marked lightcurve |
|---|---|---|---|---|---|---|---|
| A | 7239 | 6255 | 3820 | 3820 | 52.77% | 61.07% | 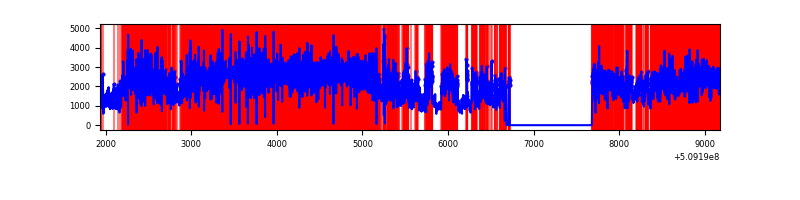 |
| B | 7239 | 6256 | 125 | 125 | 1.73% | 2.00% | 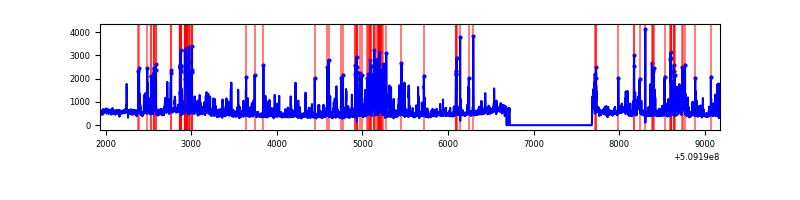 |
| C | 7240 | 6257 | 136 | 136 | 1.88% | 2.17% | 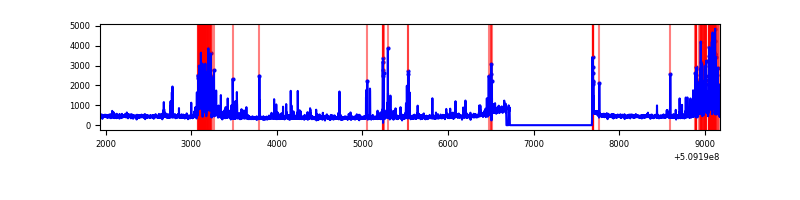 |
| D | 7240 | 6257 | 1370 | 1370 | 18.92% | 21.90% | 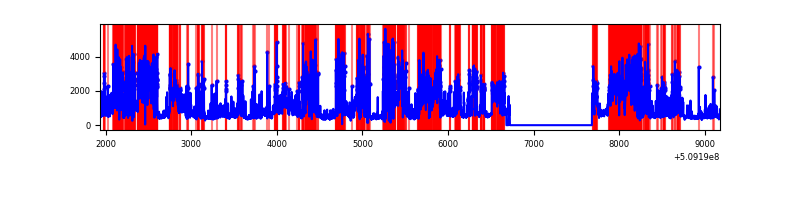 |
Top three noisy pixels from each quadrant. If the there are fewer than three noisy pixels in the level2.evt file, extra rows are filled as -1
| Pixel properties | Quadrant properties | ||||||
|---|---|---|---|---|---|---|---|
| Quadrant | DetID | PixID | Counts | Sigma | Mean | Median | Sigma |
| A | 15 | 32 | 5159362 | 44208.8 | 466 | 454 | 116.7 |
| A | 8 | 176 | 3175365 | 27207.11 | 466 | 454 | 116.7 |
| A | 12 | 115 | 1473438 | 12622.6 | 466 | 454 | 116.7 |
| B | 1 | 207 | 323683 | 2261.44 | 667 | 643 | 142.8 |
| B | 4 | 171 | 235010 | 1640.68 | 667 | 643 | 142.8 |
| B | 5 | 172 | 131981 | 919.43 | 667 | 643 | 142.8 |
| C | 5 | 250 | 330536 | 1833.8 | 656 | 648 | 179.9 |
| C | 13 | 3 | 316170 | 1753.94 | 656 | 648 | 179.9 |
| C | 6 | 223 | 67451 | 371.35 | 656 | 648 | 179.9 |
| D | 8 | 129 | 4469234 | 26664.24 | 581 | 553 | 167.6 |
| D | 2 | 249 | 479592 | 2858.38 | 581 | 553 | 167.6 |
| D | 11 | 129 | 328394 | 1956.2 | 581 | 553 | 167.6 |
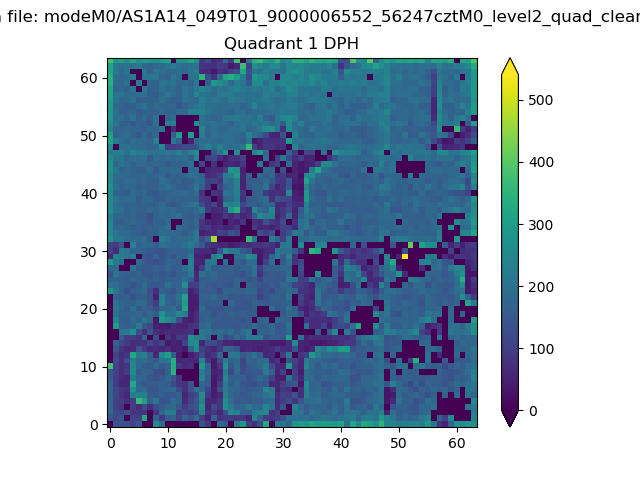
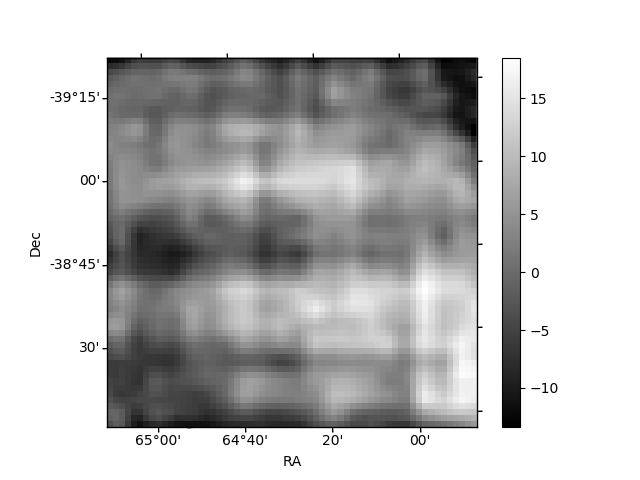
Histogram calculated using DETX and DETY for each event in the final _common_clean file
| Quadrant A |  |
 |
Quadrant B |
|---|---|---|---|
| Quadrant D |  |
 |
Quadrant C |
| Plot type | Count rate plots | Images |
|---|---|---|
| Comparison with Poisson distribution Blue bars denote a histogram of data divided into 1 sec bins. Red curve is a Poisson curve with rate = median count rate of data. |
 |
 |
| Quadrant-wise count rates Data is divided into 100 sec bins |
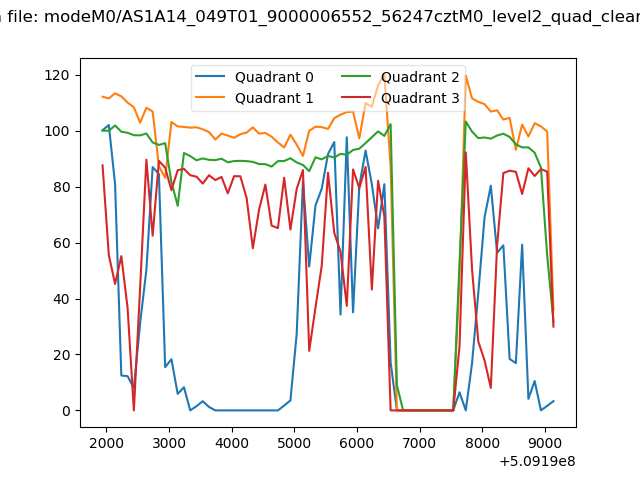 |
|
| Module-wise count rates for Quadrant A Data is divided into 100 sec bins |
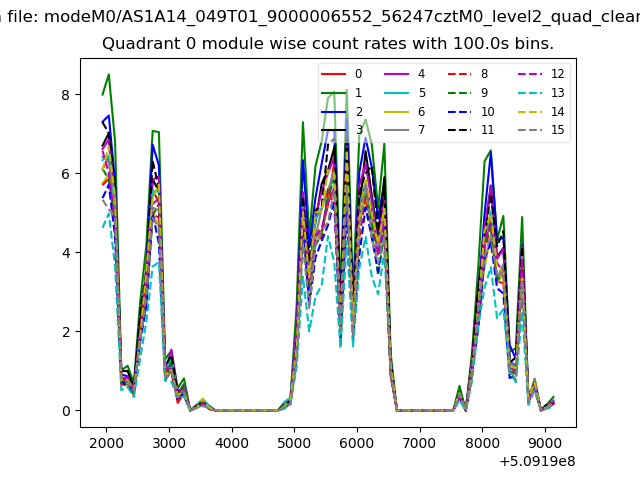 |
 |
| Module-wise count rates for Quadrant B Data is divided into 100 sec bins |
 |
 |
| Module-wise count rates for Quadrant C Data is divided into 100 sec bins |
 |
 |
| Module-wise count rates for Quadrant D Data is divided into 100 sec bins |
 |
 |
| Parameter | Plot |
|---|---|
| CZT HV Monitor | 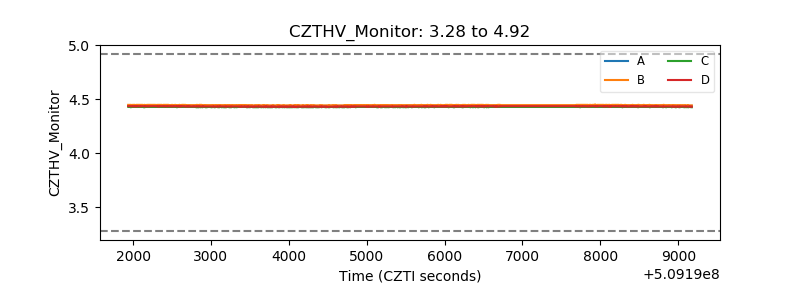 |
| D_VDD |  |
| Temperature 1 | 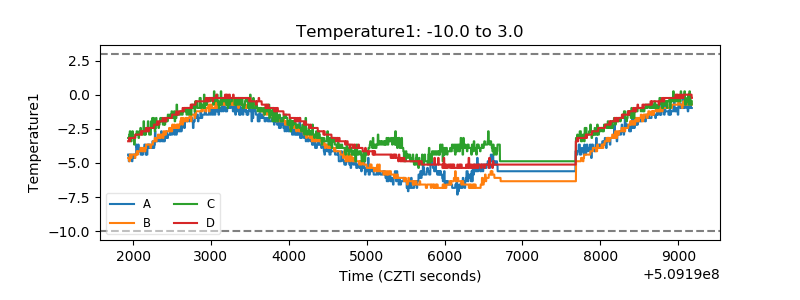 |
| Veto HV Monitor |  |
| Veto LLD | 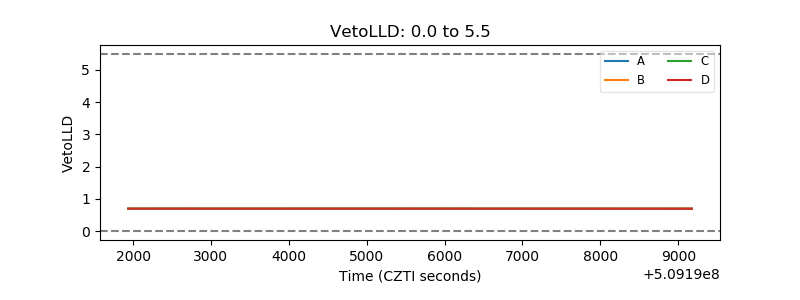 |
| Alpha Counter | 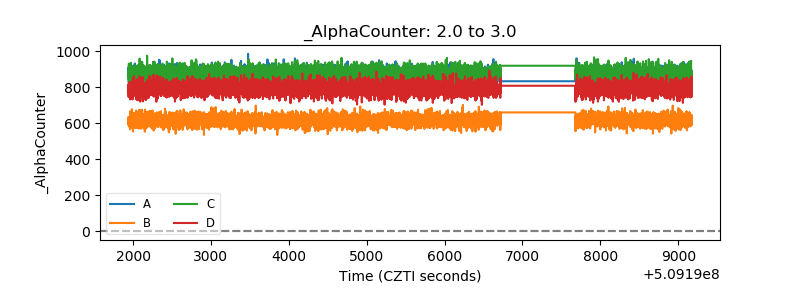 |
| _CPM_Rate |  |
| CZT Counter | 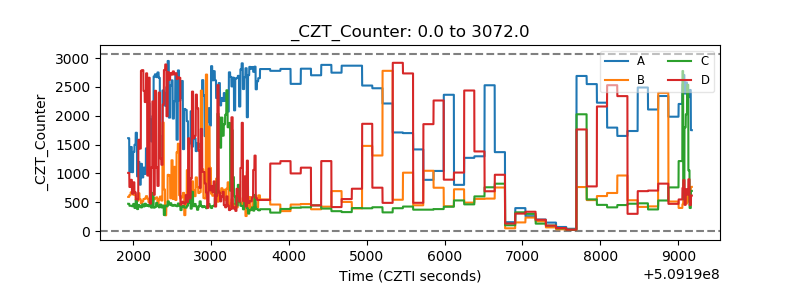 |
| +2.5 Volts monitor | 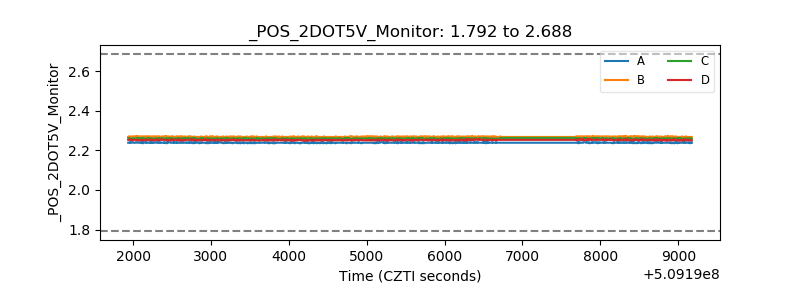 |
| +5 Volts monitor |  |
| _ROLL_ROT |  |
| _Roll_DEC |  |
| _Roll_RA | 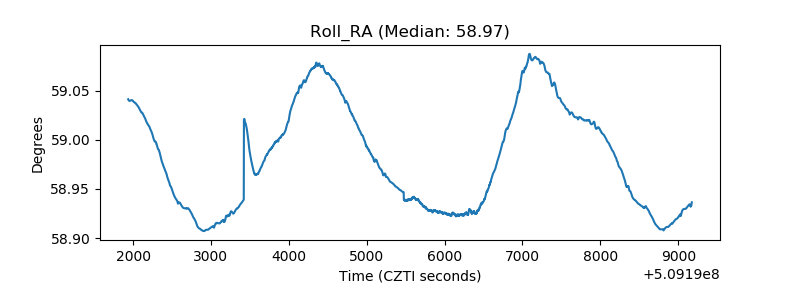 |
| Veto Counter |  |