| Param | Original file | Final file |
|---|---|---|
| Filename | modeM0/AS1A14_049T01_9000006552_56249cztM0_level2.fits | modeM0/AS1A14_049T01_9000006552_56249cztM0_level2_quad_clean.evt |
| Size (bytes) | 906,117,120 | 90,800,640 |
| Size | 864.1 MB | 86.6 MB |
| Events in quadrant A | 13,445,768 | 410,919 |
| Events in quadrant B | 4,281,518 | 740,096 |
| Events in quadrant C | 5,351,037 | 645,453 |
| Events in quadrant D | 9,900,298 | 445,156 |
| Mode SS | |||
|---|---|---|---|
| Quadrant | BADHDUFLAG | Total packets | Discarded packets |
| A | 0 | 146 | 0 |
| B | 0 | 146 | 0 |
| C | 0 | 146 | 0 |
| D | 0 | 146 | 0 |
| Mode M0 | |||
|---|---|---|---|
| Quadrant | BADHDUFLAG | Total packets | Discarded packets |
| A | 0 | 44983 | 5 |
| B | 0 | 17878 | 0 |
| C | 0 | 21128 | 0 |
| D | 0 | 34502 | 0 |
| Quadrant | Total seconds | Saturated seconds | Saturation percentage |
|---|---|---|---|
| A | 7286 | 3482 | 47.790283% |
| B | 7286 | 170 | 2.333242% |
| C | 7287 | 374 | 5.132428% |
| D | 7287 | 2270 | 31.151365% |
Noise dominated data is calculated using 1-second bins in cleaned event files. If a bin has >2000 counts, and if more than 50% of those come from <1% of pixels, then it is considered to be noise-dominated and hence unusable.
| Quadrant | # 1 sec bins | Bins with >0 counts | Bins with >2000 counts | High rate bins dominated by noise | Noise dominated (total time) | Noise dominated (detector-on time) | Marked lightcurve |
|---|---|---|---|---|---|---|---|
| A | 7286 | 7286 | 3380 | 3380 | 46.39% | 46.39% |  |
| B | 7286 | 7286 | 74 | 74 | 1.02% | 1.02% |  |
| C | 7287 | 7287 | 296 | 296 | 4.06% | 4.06% | 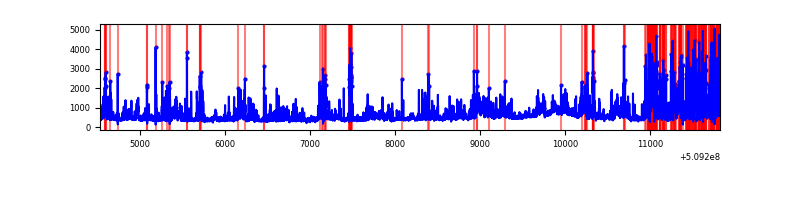 |
| D | 7287 | 7287 | 1976 | 1976 | 27.12% | 27.12% | 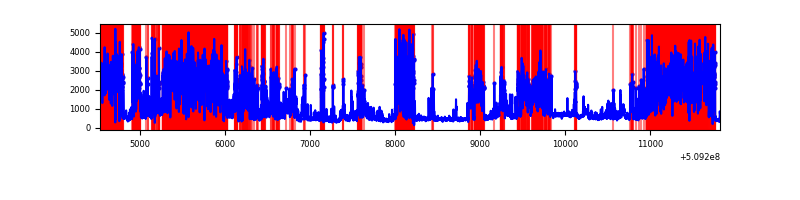 |
Top three noisy pixels from each quadrant. If the there are fewer than three noisy pixels in the level2.evt file, extra rows are filled as -1
| Pixel properties | Quadrant properties | ||||||
|---|---|---|---|---|---|---|---|
| Quadrant | DetID | PixID | Counts | Sigma | Mean | Median | Sigma |
| A | 8 | 176 | 4944934 | 29888.92 | 665 | 648 | 165.4 |
| A | 15 | 32 | 3376073 | 20404.93 | 665 | 648 | 165.4 |
| A | 12 | 115 | 1031702 | 6232.87 | 665 | 648 | 165.4 |
| B | 4 | 171 | 601900 | 3590.4 | 782 | 753 | 167.4 |
| B | 10 | 247 | 126811 | 752.89 | 782 | 753 | 167.4 |
| B | 7 | 252 | 87519 | 518.22 | 782 | 753 | 167.4 |
| C | 12 | 254 | 1545366 | 7591.76 | 748 | 743 | 203.5 |
| C | 13 | 3 | 477163 | 2341.58 | 748 | 743 | 203.5 |
| C | 5 | 250 | 198707 | 972.98 | 748 | 743 | 203.5 |
| D | 8 | 129 | 5641158 | 30059.39 | 653 | 621 | 187.6 |
| D | 2 | 249 | 1043664 | 5558.55 | 653 | 621 | 187.6 |
| D | 14 | 52 | 187907 | 998.08 | 653 | 621 | 187.6 |
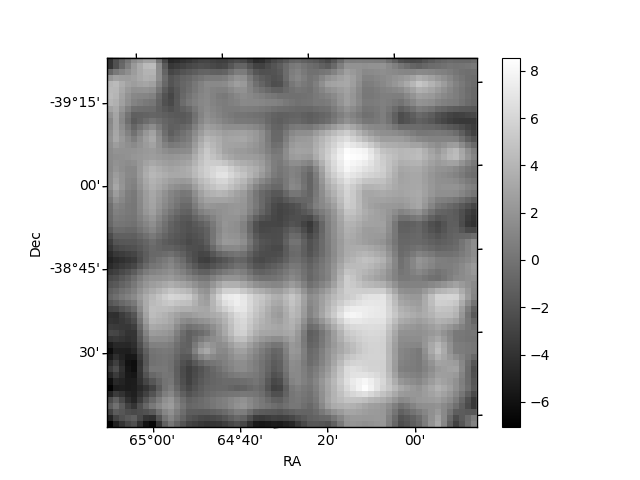
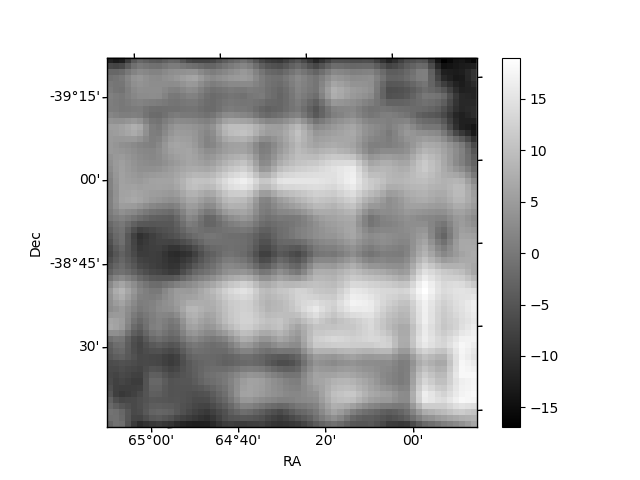
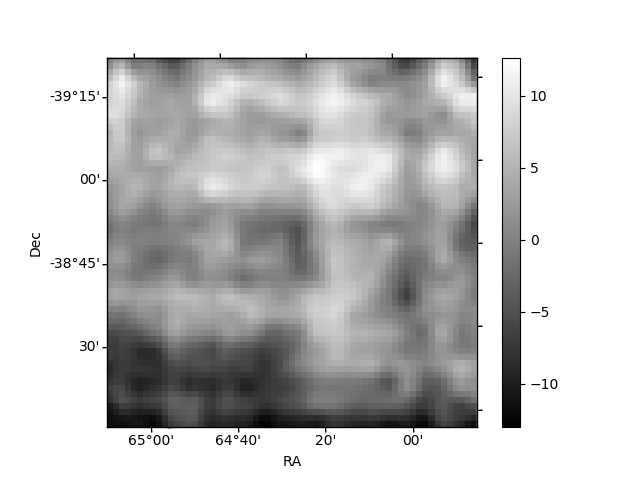
Histogram calculated using DETX and DETY for each event in the final _common_clean file
| Quadrant A |  |
 |
Quadrant B |
|---|---|---|---|
| Quadrant D | 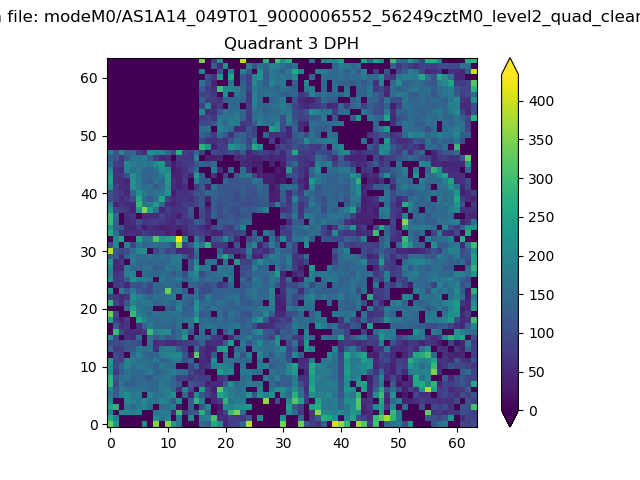 |
 |
Quadrant C |
| Plot type | Count rate plots | Images |
|---|---|---|
| Comparison with Poisson distribution Blue bars denote a histogram of data divided into 1 sec bins. Red curve is a Poisson curve with rate = median count rate of data. |
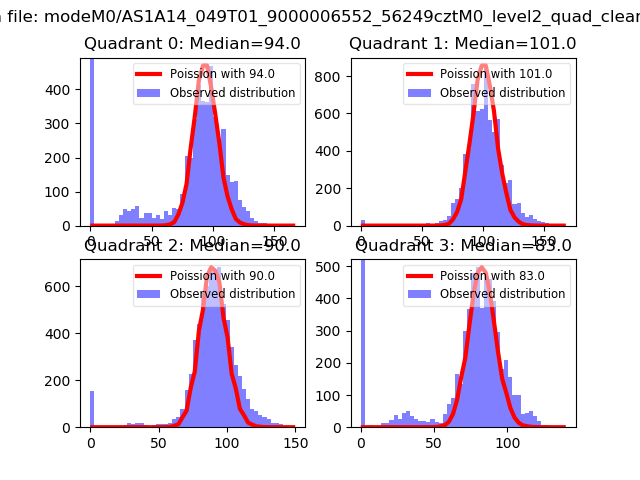 |
 |
| Quadrant-wise count rates Data is divided into 100 sec bins |
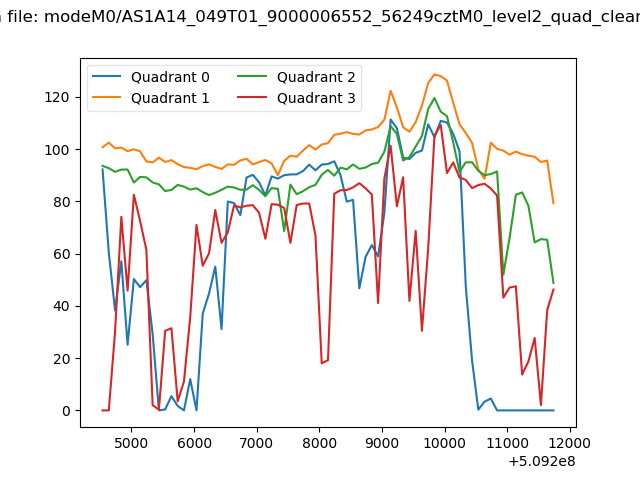 |
|
| Module-wise count rates for Quadrant A Data is divided into 100 sec bins |
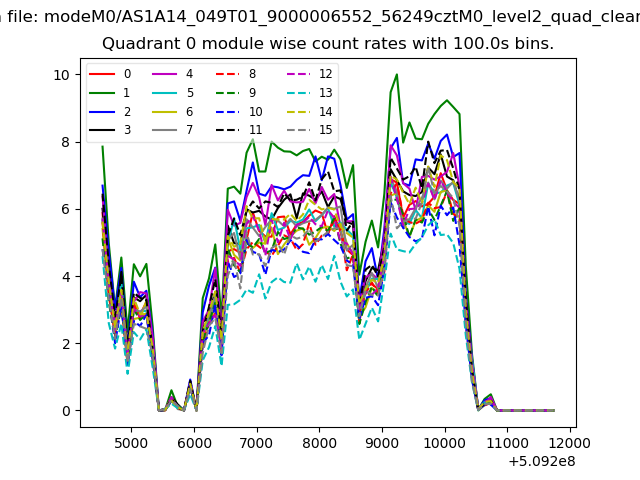 |
 |
| Module-wise count rates for Quadrant B Data is divided into 100 sec bins |
 |
 |
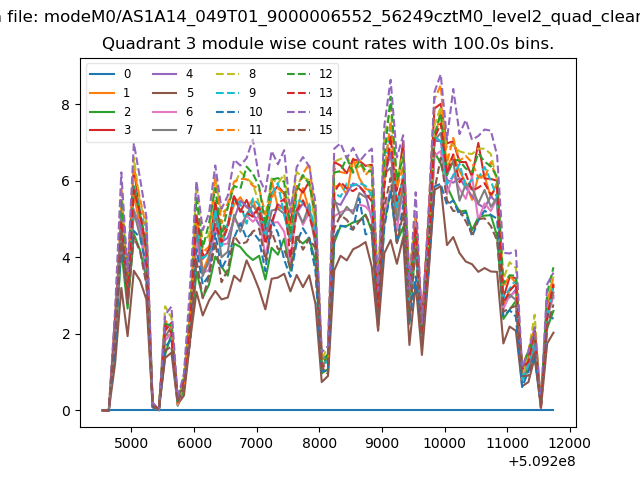
| Module-wise count rates for Quadrant C Data is divided into 100 sec bins |
 |
 |
| Module-wise count rates for Quadrant D Data is divided into 100 sec bins |
 |
 |
| Parameter | Plot |
|---|---|
| CZT HV Monitor | 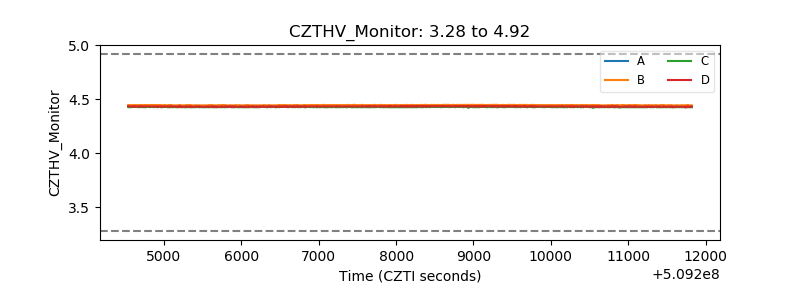 |
| D_VDD |  |
| Temperature 1 | 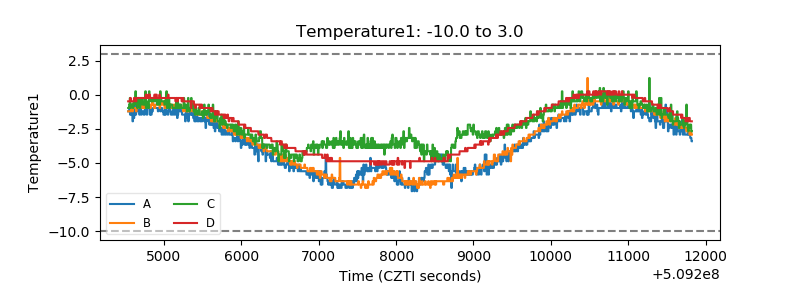 |
| Veto HV Monitor | 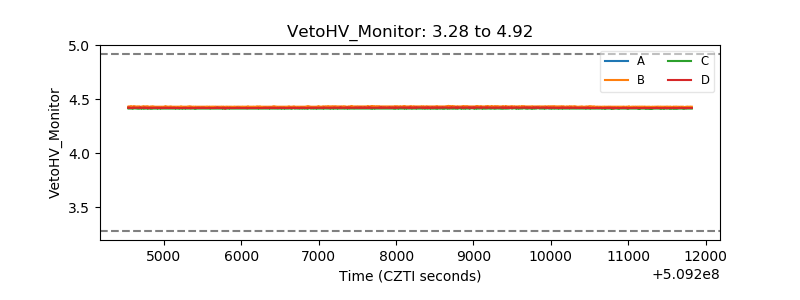 |
| Veto LLD | 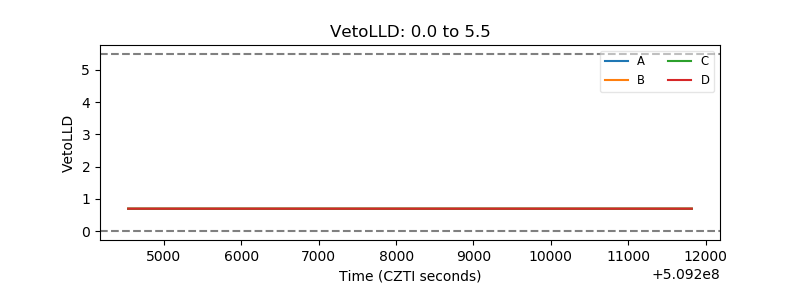 |
| Alpha Counter | 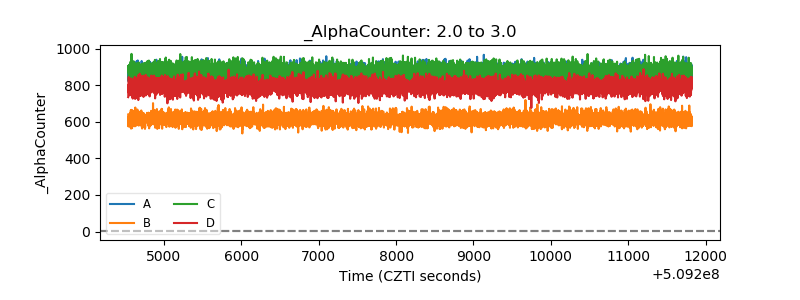 |
| _CPM_Rate | 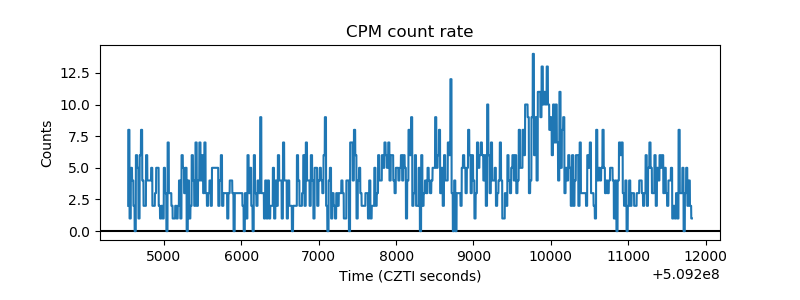 |
| CZT Counter |  |
| +2.5 Volts monitor |  |
| +5 Volts monitor | 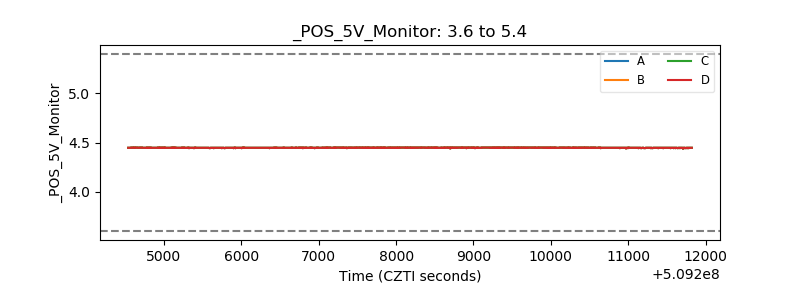 |
| _ROLL_ROT | 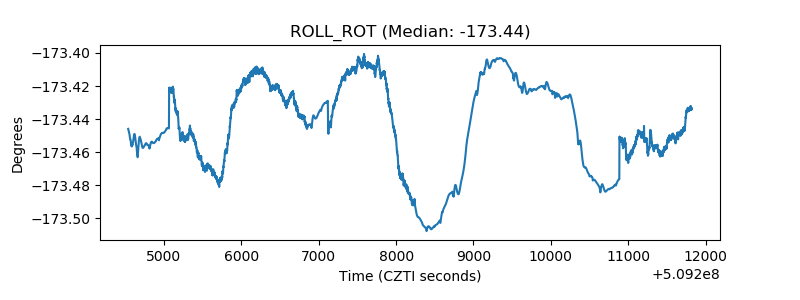 |
| _Roll_DEC | 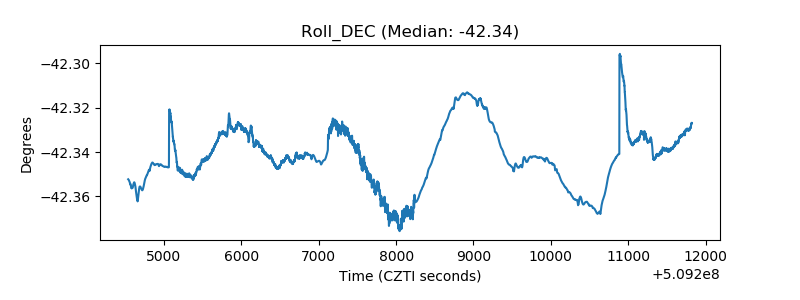 |
| _Roll_RA |  |
| Veto Counter | 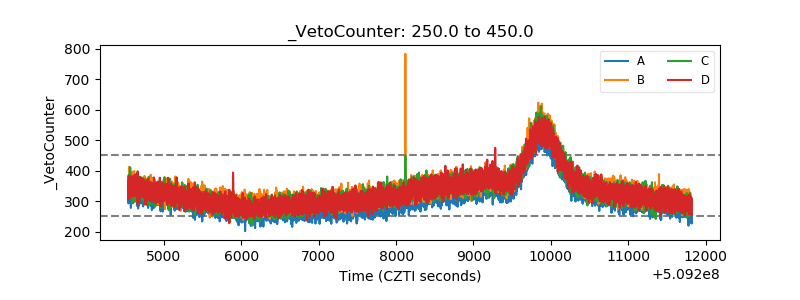 |