| Param | Original file | Final file |
|---|---|---|
| Filename | modeM0/AS1A14_049T01_9000006552_56250cztM0_level2.fits | modeM0/AS1A14_049T01_9000006552_56250cztM0_level2_quad_clean.evt |
| Size (bytes) | 808,770,240 | 84,703,680 |
| Size | 771.3 MB | 80.8 MB |
| Events in quadrant A | 12,382,708 | 322,799 |
| Events in quadrant B | 4,178,972 | 680,370 |
| Events in quadrant C | 5,117,439 | 582,432 |
| Events in quadrant D | 7,724,414 | 497,466 |
| Mode SS | |||
|---|---|---|---|
| Quadrant | BADHDUFLAG | Total packets | Discarded packets |
| A | 0 | 138 | 0 |
| B | 0 | 138 | 0 |
| C | 0 | 138 | 0 |
| D | 0 | 138 | 0 |
| Mode M0 | |||
|---|---|---|---|
| Quadrant | BADHDUFLAG | Total packets | Discarded packets |
| A | 0 | 41760 | 1 |
| B | 0 | 17355 | 0 |
| C | 0 | 20111 | 1 |
| D | 0 | 27681 | 0 |
| Quadrant | Total seconds | Saturated seconds | Saturation percentage |
|---|---|---|---|
| A | 6908 | 3638 | 52.663578% |
| B | 6910 | 233 | 3.371925% |
| C | 6909 | 532 | 7.700101% |
| D | 6909 | 1108 | 16.037053% |
Noise dominated data is calculated using 1-second bins in cleaned event files. If a bin has >2000 counts, and if more than 50% of those come from <1% of pixels, then it is considered to be noise-dominated and hence unusable.
| Quadrant | # 1 sec bins | Bins with >0 counts | Bins with >2000 counts | High rate bins dominated by noise | Noise dominated (total time) | Noise dominated (detector-on time) | Marked lightcurve |
|---|---|---|---|---|---|---|---|
| A | 6908 | 6908 | 3339 | 3339 | 48.34% | 48.34% |  |
| B | 6910 | 6910 | 151 | 151 | 2.19% | 2.19% |  |
| C | 6909 | 6909 | 484 | 484 | 7.01% | 7.01% | 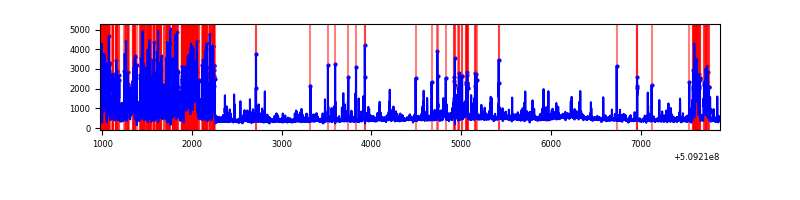 |
| D | 6909 | 6909 | 1119 | 1119 | 16.20% | 16.20% |  |
Top three noisy pixels from each quadrant. If the there are fewer than three noisy pixels in the level2.evt file, extra rows are filled as -1
| Pixel properties | Quadrant properties | ||||||
|---|---|---|---|---|---|---|---|
| Quadrant | DetID | PixID | Counts | Sigma | Mean | Median | Sigma |
| A | 15 | 32 | 5533748 | 40238.46 | 546 | 533 | 137.5 |
| A | 8 | 176 | 3645041 | 26503.47 | 546 | 533 | 137.5 |
| A | 7 | 64 | 392134 | 2847.79 | 546 | 533 | 137.5 |
| B | 4 | 171 | 564270 | 3688.82 | 718 | 693 | 152.8 |
| B | 8 | 128 | 212397 | 1385.68 | 718 | 693 | 152.8 |
| B | 1 | 255 | 121479 | 790.59 | 718 | 693 | 152.8 |
| C | 12 | 254 | 1478324 | 7869.01 | 683 | 681 | 187.8 |
| C | 5 | 250 | 359519 | 1910.95 | 683 | 681 | 187.8 |
| C | 13 | 3 | 260533 | 1383.81 | 683 | 681 | 187.8 |
| D | 8 | 129 | 4202452 | 22440.97 | 656 | 626 | 187.2 |
| D | 2 | 249 | 470507 | 2509.53 | 656 | 626 | 187.2 |
| D | 3 | 12 | 123771 | 657.69 | 656 | 626 | 187.2 |
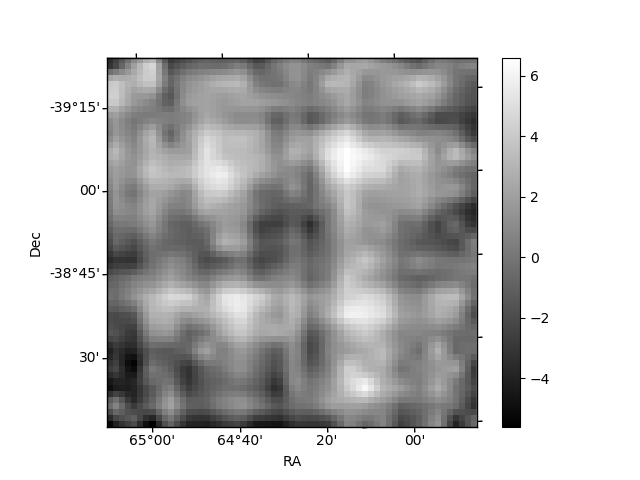
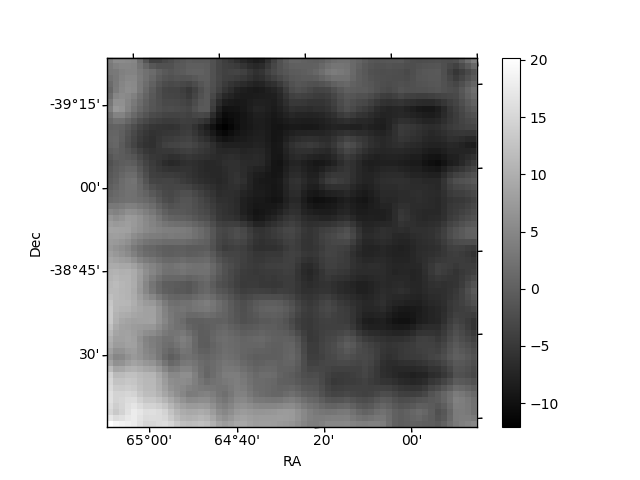
Histogram calculated using DETX and DETY for each event in the final _common_clean file
| Quadrant A | 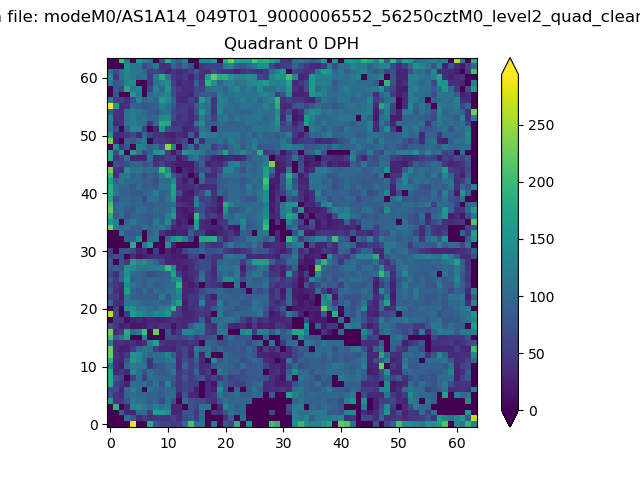 |
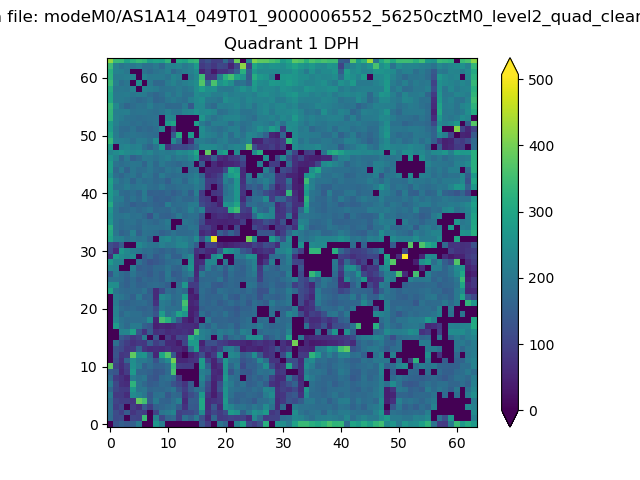 |
Quadrant B |
|---|---|---|---|
| Quadrant D |  |
 |
Quadrant C |
| Plot type | Count rate plots | Images |
|---|---|---|
| Comparison with Poisson distribution Blue bars denote a histogram of data divided into 1 sec bins. Red curve is a Poisson curve with rate = median count rate of data. |
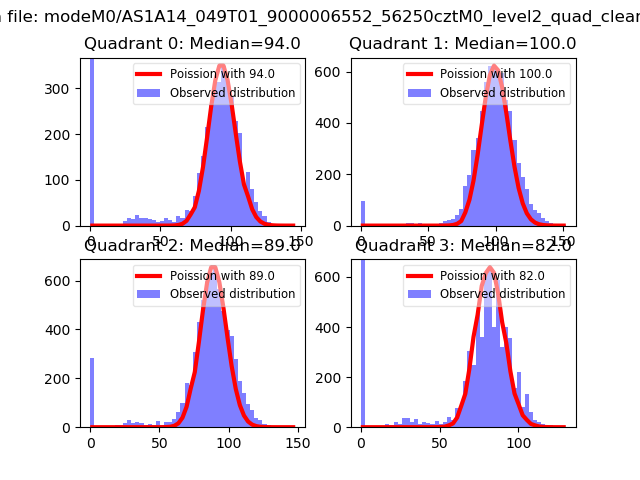 |
 |
| Quadrant-wise count rates Data is divided into 100 sec bins |
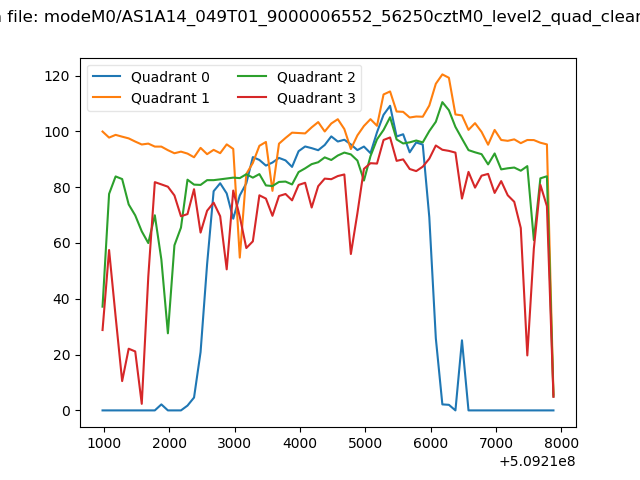 |
|
| Module-wise count rates for Quadrant A Data is divided into 100 sec bins |
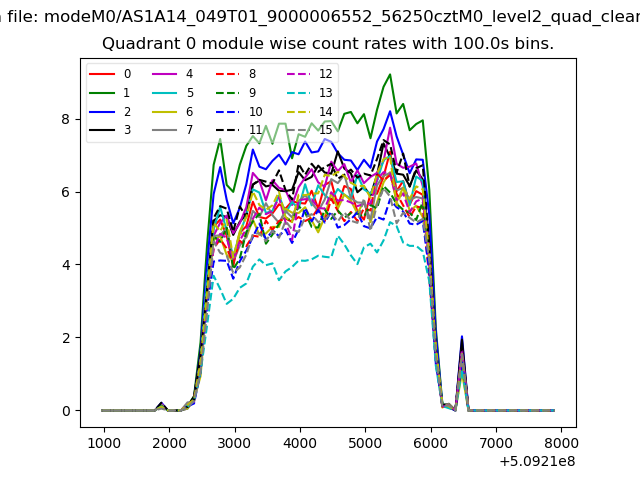 |
 |
| Module-wise count rates for Quadrant B Data is divided into 100 sec bins |
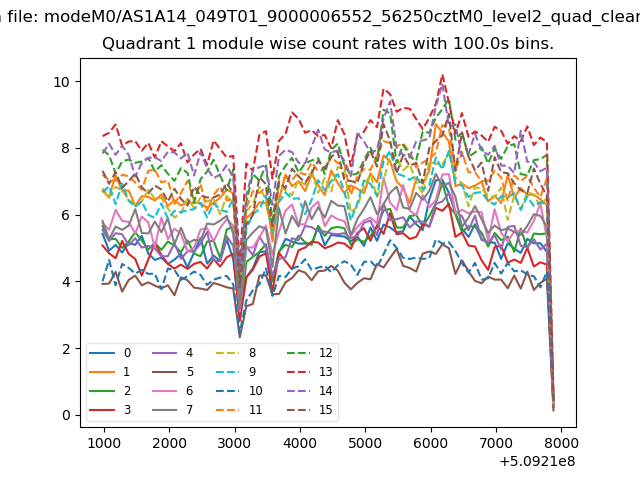 |
 |
| Module-wise count rates for Quadrant C Data is divided into 100 sec bins |
 |
 |
| Module-wise count rates for Quadrant D Data is divided into 100 sec bins |
 |
 |
| Parameter | Plot |
|---|---|
| CZT HV Monitor |  |
| D_VDD |  |
| Temperature 1 | 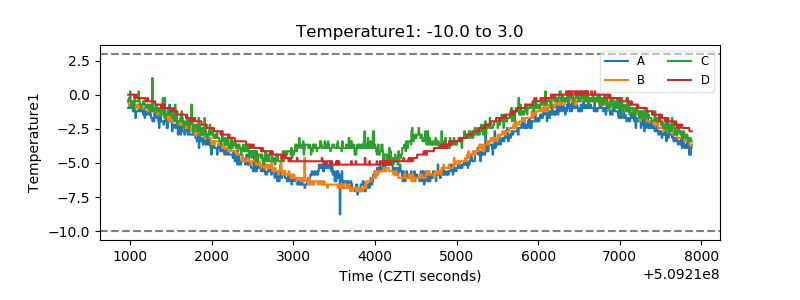 |
| Veto HV Monitor | 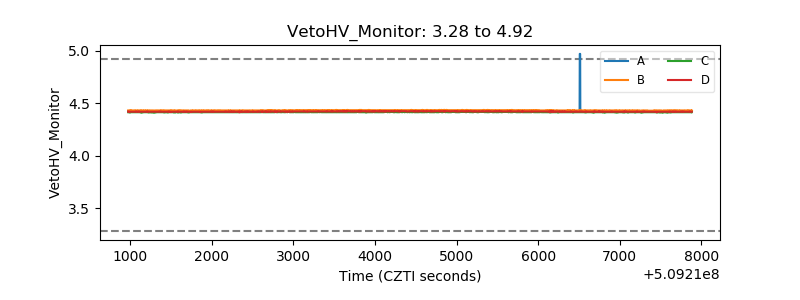 |
| Veto LLD | 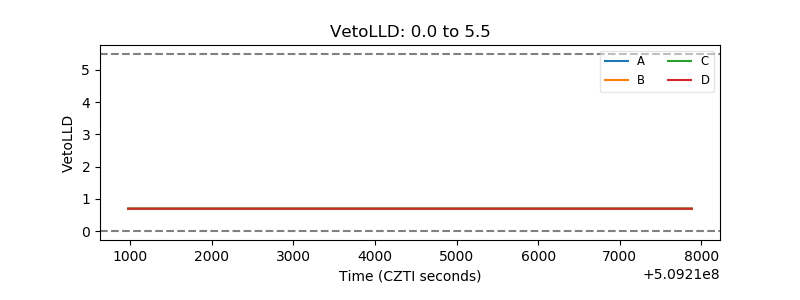 |
| Alpha Counter |  |
| _CPM_Rate | 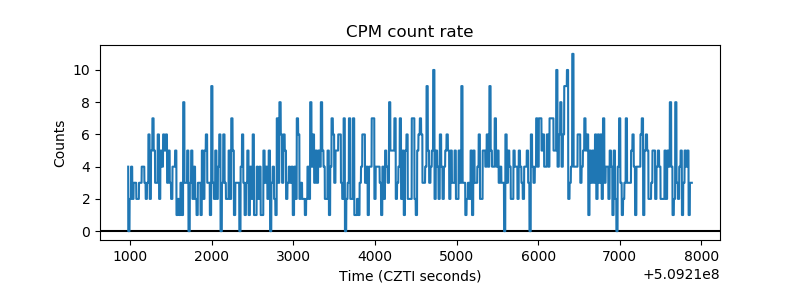 |
| CZT Counter | 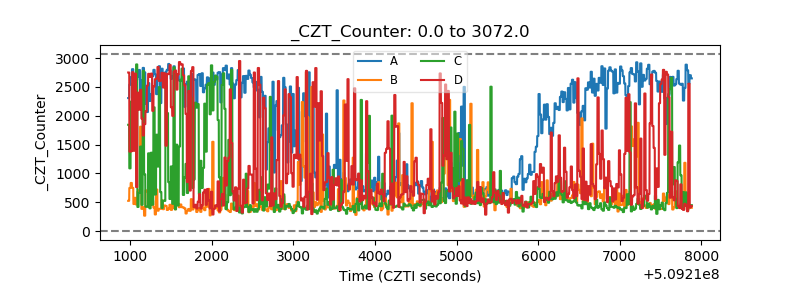 |
| +2.5 Volts monitor |  |
| +5 Volts monitor |  |
| _ROLL_ROT | 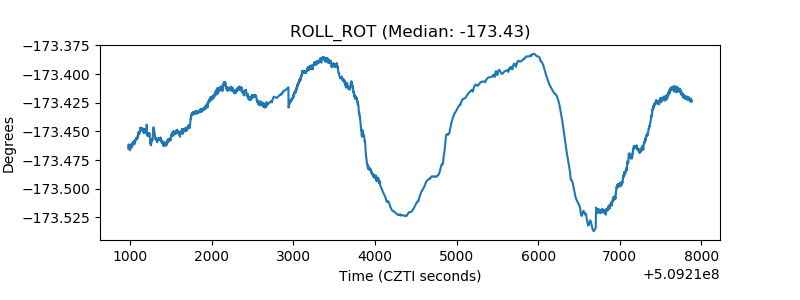 |
| _Roll_DEC | 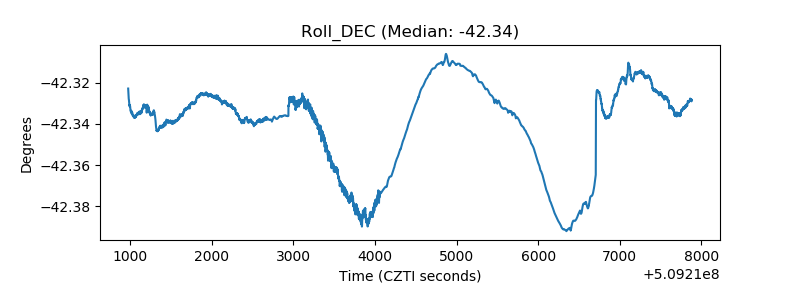 |
| _Roll_RA |  |
| Veto Counter | 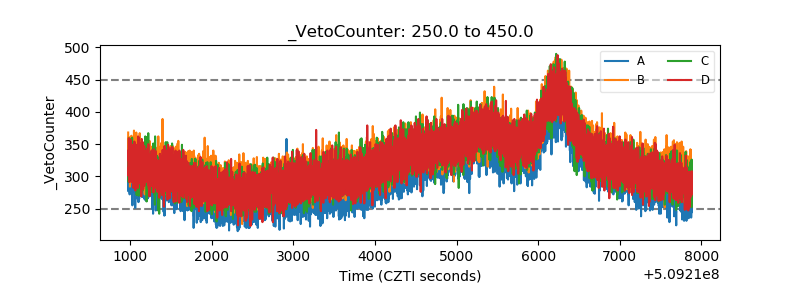 |