| Param | Original file | Final file |
|---|---|---|
| Filename | modeM0/AS1A14_049T01_9000006552_56251cztM0_level2.fits | modeM0/AS1A14_049T01_9000006552_56251cztM0_level2_quad_clean.evt |
| Size (bytes) | 835,479,360 | 83,321,280 |
| Size | 796.8 MB | 79.5 MB |
| Events in quadrant A | 15,325,363 | 249,680 |
| Events in quadrant B | 4,243,749 | 646,576 |
| Events in quadrant C | 5,207,167 | 569,515 |
| Events in quadrant D | 5,564,638 | 530,284 |
| Mode SS | |||
|---|---|---|---|
| Quadrant | BADHDUFLAG | Total packets | Discarded packets |
| A | 0 | 152 | 0 |
| B | 0 | 152 | 0 |
| C | 0 | 152 | 0 |
| D | 0 | 152 | 0 |
| Mode M0 | |||
|---|---|---|---|
| Quadrant | BADHDUFLAG | Total packets | Discarded packets |
| A | 0 | 50778 | 0 |
| B | 0 | 18070 | 0 |
| C | 0 | 21074 | 0 |
| D | 0 | 21870 | 0 |
| Quadrant | Total seconds | Saturated seconds | Saturation percentage |
|---|---|---|---|
| A | 7562 | 4624 | 61.147844% |
| B | 7562 | 121 | 1.600106% |
| C | 7563 | 380 | 5.024461% |
| D | 7562 | 409 | 5.408622% |
Noise dominated data is calculated using 1-second bins in cleaned event files. If a bin has >2000 counts, and if more than 50% of those come from <1% of pixels, then it is considered to be noise-dominated and hence unusable.
| Quadrant | # 1 sec bins | Bins with >0 counts | Bins with >2000 counts | High rate bins dominated by noise | Noise dominated (total time) | Noise dominated (detector-on time) | Marked lightcurve |
|---|---|---|---|---|---|---|---|
| A | 7848 | 7754 | 4032 | 4032 | 51.38% | 52.00% |  |
| B | 7848 | 7848 | 51 | 51 | 0.65% | 0.65% |  |
| C | 7849 | 7845 | 290 | 290 | 3.69% | 3.70% | 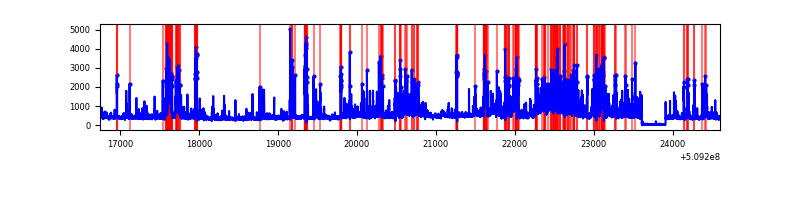 |
| D | 7848 | 7848 | 428 | 428 | 5.45% | 5.45% | 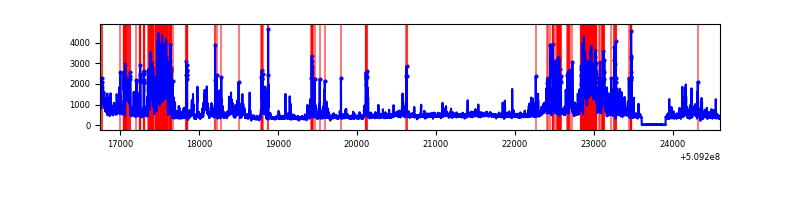 |
Top three noisy pixels from each quadrant. If the there are fewer than three noisy pixels in the level2.evt file, extra rows are filled as -1
| Pixel properties | Quadrant properties | ||||||
|---|---|---|---|---|---|---|---|
| Quadrant | DetID | PixID | Counts | Sigma | Mean | Median | Sigma |
| A | 15 | 32 | 7307023 | 49012.46 | 591 | 575 | 149.1 |
| A | 8 | 176 | 4345869 | 29148.71 | 591 | 575 | 149.1 |
| A | 10 | 251 | 551908 | 3698.4 | 591 | 575 | 149.1 |
| B | 4 | 171 | 243430 | 1446.2 | 785 | 755 | 167.8 |
| B | 7 | 0 | 169302 | 1004.44 | 785 | 755 | 167.8 |
| B | 10 | 247 | 159258 | 944.58 | 785 | 755 | 167.8 |
| C | 12 | 254 | 767090 | 3668.94 | 754 | 746 | 208.9 |
| C | 5 | 250 | 621561 | 2972.21 | 754 | 746 | 208.9 |
| C | 12 | 252 | 336969 | 1609.7 | 754 | 746 | 208.9 |
| D | 8 | 129 | 1586734 | 7432.47 | 747 | 715 | 213.4 |
| D | 2 | 249 | 441083 | 2063.67 | 747 | 715 | 213.4 |
| D | 15 | 115 | 249747 | 1167.02 | 747 | 715 | 213.4 |
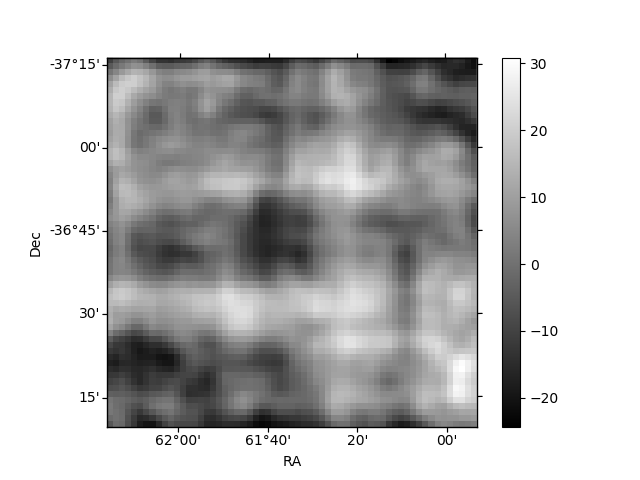
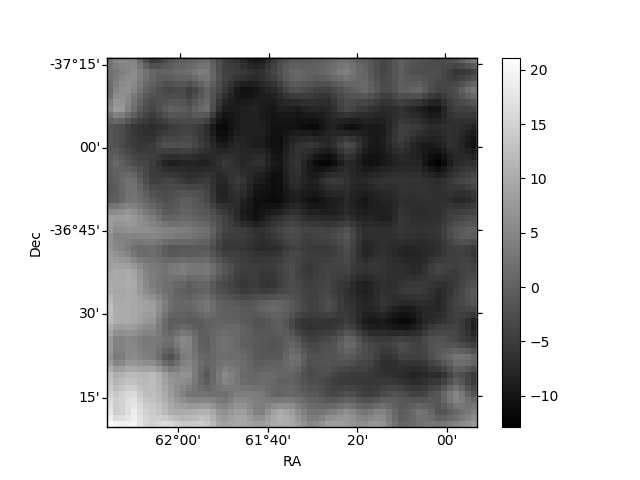
Histogram calculated using DETX and DETY for each event in the final _common_clean file
| Quadrant A |  |
 |
Quadrant B |
|---|---|---|---|
| Quadrant D | 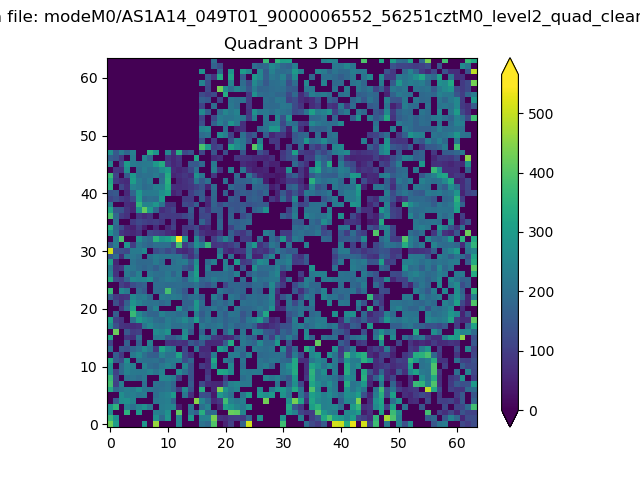 |
 |
Quadrant C |
| Plot type | Count rate plots | Images |
|---|---|---|
| Comparison with Poisson distribution Blue bars denote a histogram of data divided into 1 sec bins. Red curve is a Poisson curve with rate = median count rate of data. |
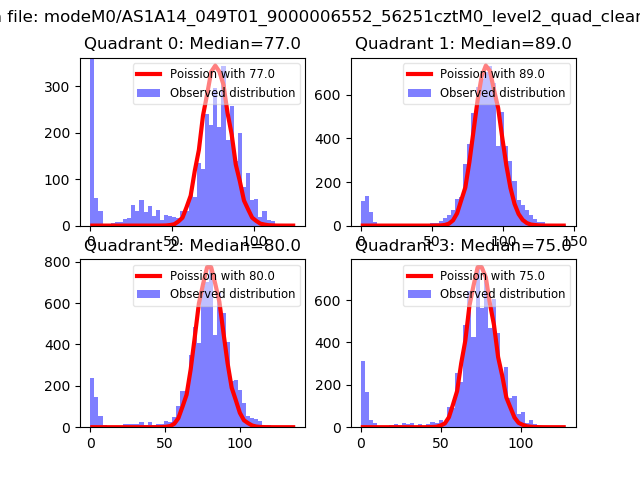 |
 |
| Quadrant-wise count rates Data is divided into 100 sec bins |
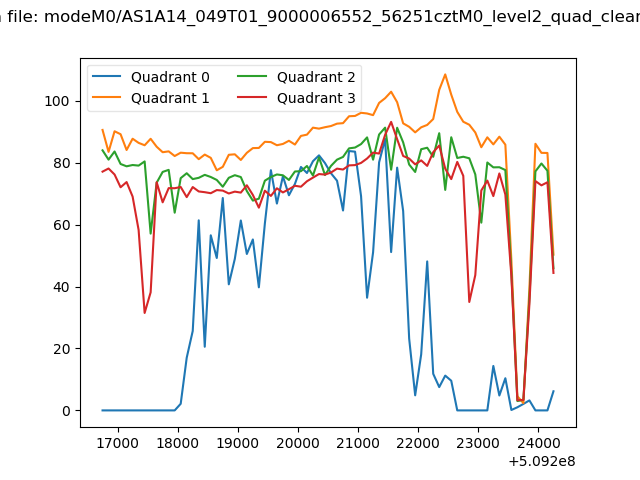 |
|
| Module-wise count rates for Quadrant A Data is divided into 100 sec bins |
 |
 |
| Module-wise count rates for Quadrant B Data is divided into 100 sec bins |
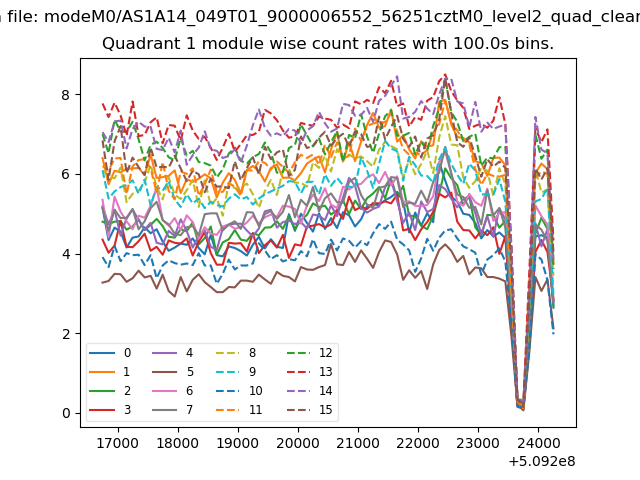 |
 |
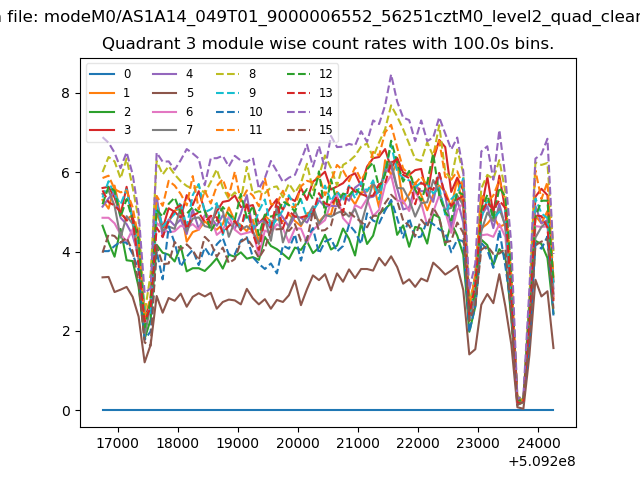
| Module-wise count rates for Quadrant C Data is divided into 100 sec bins |
 |
 |
| Module-wise count rates for Quadrant D Data is divided into 100 sec bins |
 |
 |
| Parameter | Plot |
|---|---|
| CZT HV Monitor | 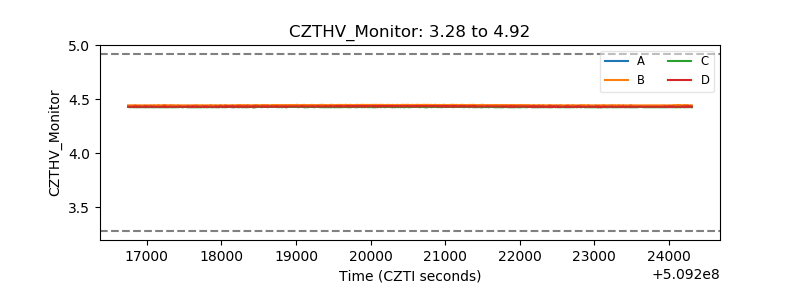 |
| D_VDD |  |
| Temperature 1 | 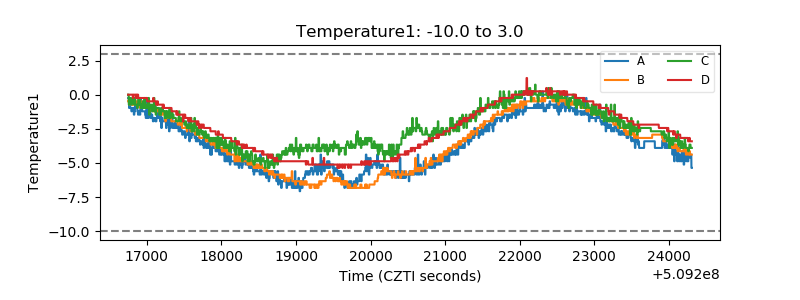 |
| Veto HV Monitor | 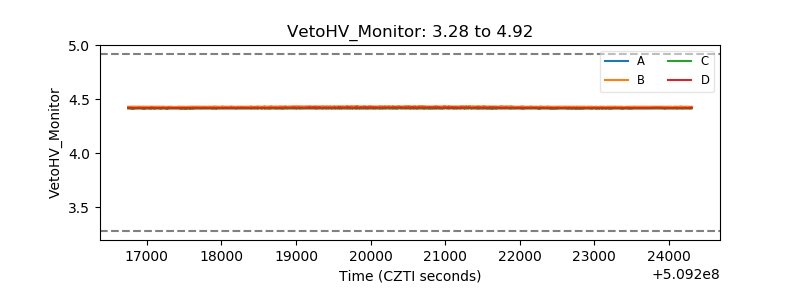 |
| Veto LLD | 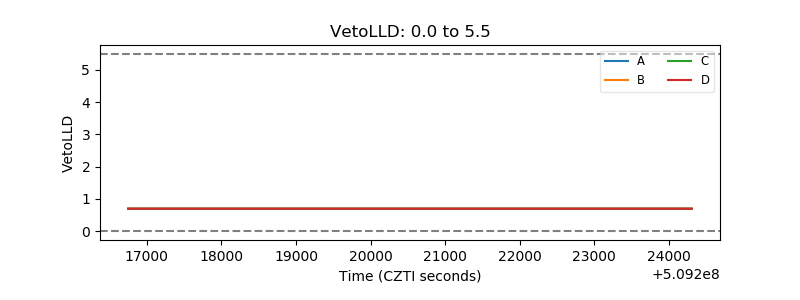 |
| Alpha Counter | 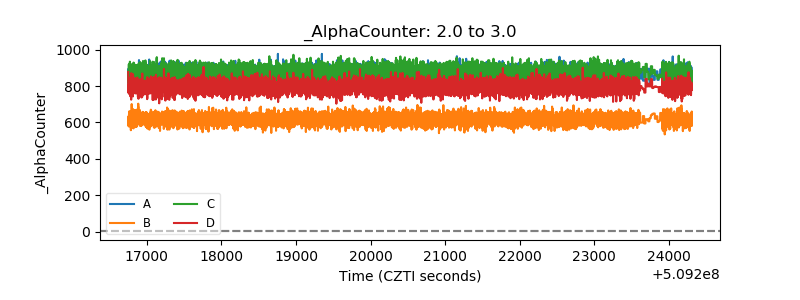 |
| _CPM_Rate | 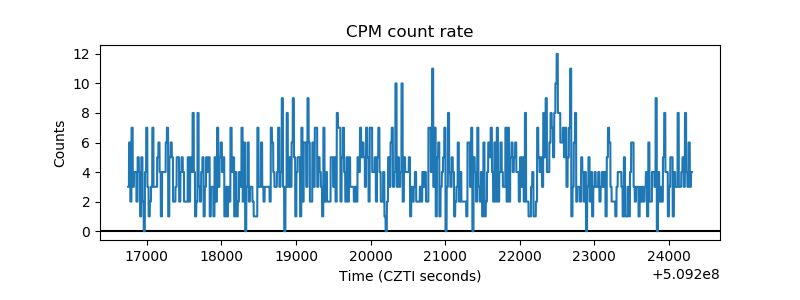 |
| CZT Counter |  |
| +2.5 Volts monitor |  |
| +5 Volts monitor | 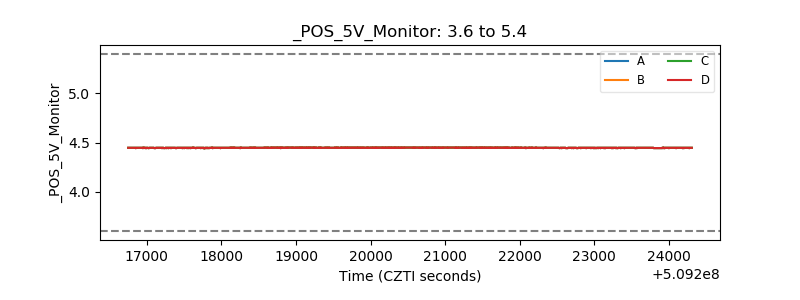 |
| _ROLL_ROT | 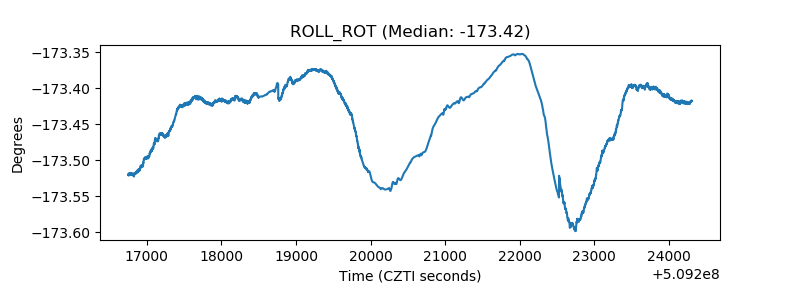 |
| _Roll_DEC | 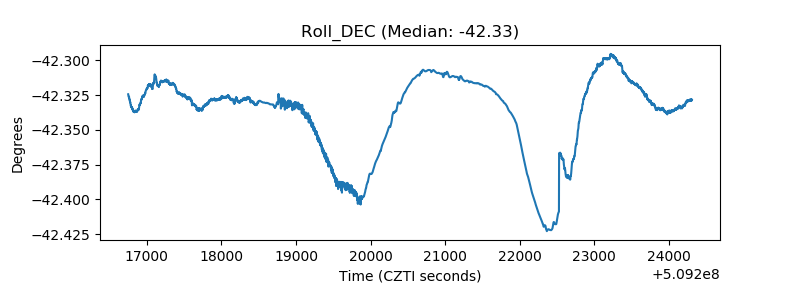 |
| _Roll_RA |  |
| Veto Counter | 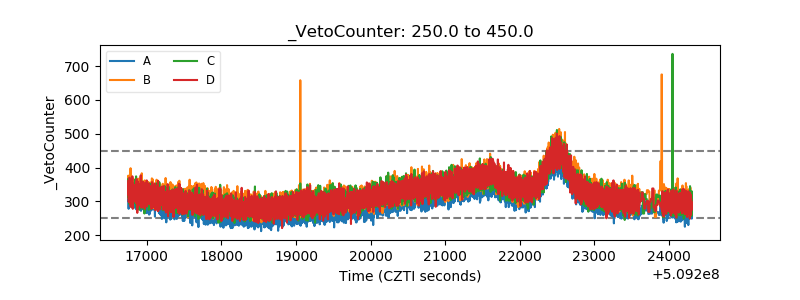 |