| Param | Original file | Final file |
|---|---|---|
| Filename | modeM0/AS1A14_049T01_9000006552_56254cztM0_level2.fits | modeM0/AS1A14_049T01_9000006552_56254cztM0_level2_quad_clean.evt |
| Size (bytes) | 1,933,107,840 | 200,312,640 |
| Size | 1.8 GB | 191.0 MB |
| Events in quadrant A | 34,873,148 | 743,405 |
| Events in quadrant B | 10,543,793 | 1,444,046 |
| Events in quadrant C | 11,314,267 | 1,335,804 |
| Events in quadrant D | 13,355,047 | 1,225,912 |
| Mode SS | |||
|---|---|---|---|
| Quadrant | BADHDUFLAG | Total packets | Discarded packets |
| A | 0 | 390 | 0 |
| B | 0 | 390 | 0 |
| C | 0 | 390 | 0 |
| D | 0 | 390 | 0 |
| Mode M9 | |||
|---|---|---|---|
| Quadrant | BADHDUFLAG | Total packets | Discarded packets |
| A | 0 | 13 | 0 |
| B | 0 | 13 | 0 |
| C | 0 | 13 | 0 |
| D | 0 | 13 | 0 |
| Mode M0 | |||
|---|---|---|---|
| Quadrant | BADHDUFLAG | Total packets | Discarded packets |
| A | 0 | 116872 | 6 |
| B | 0 | 45077 | 4 |
| C | 0 | 47565 | 4 |
| D | 0 | 53424 | 4 |
| Quadrant | Total seconds | Saturated seconds | Saturation percentage |
|---|---|---|---|
| A | 19057 | 9332 | 48.968883% |
| B | 19058 | 452 | 2.371707% |
| C | 19058 | 583 | 3.059083% |
| D | 19058 | 1010 | 5.299612% |
Noise dominated data is calculated using 1-second bins in cleaned event files. If a bin has >2000 counts, and if more than 50% of those come from <1% of pixels, then it is considered to be noise-dominated and hence unusable.
| Quadrant | # 1 sec bins | Bins with >0 counts | Bins with >2000 counts | High rate bins dominated by noise | Noise dominated (total time) | Noise dominated (detector-on time) | Marked lightcurve |
|---|---|---|---|---|---|---|---|
| A | 20731 | 19251 | 8068 | 8068 | 38.92% | 41.91% |  |
| B | 20732 | 19346 | 173 | 173 | 0.83% | 0.89% |  |
| C | 20732 | 19342 | 393 | 393 | 1.90% | 2.03% | 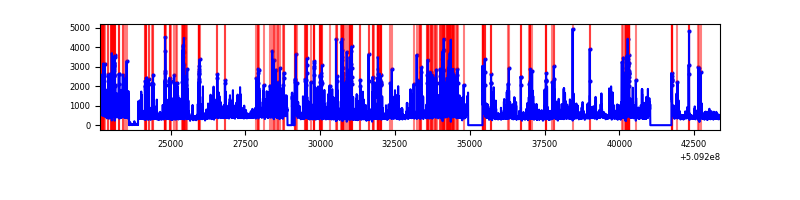 |
| D | 20732 | 19346 | 974 | 974 | 4.70% | 5.03% |  |
Top three noisy pixels from each quadrant. If the there are fewer than three noisy pixels in the level2.evt file, extra rows are filled as -1
| Pixel properties | Quadrant properties | ||||||
|---|---|---|---|---|---|---|---|
| Quadrant | DetID | PixID | Counts | Sigma | Mean | Median | Sigma |
| A | 15 | 32 | 13961750 | 35328.24 | 1582 | 1545 | 395.2 |
| A | 8 | 176 | 8971822 | 22700.54 | 1582 | 1545 | 395.2 |
| A | 10 | 251 | 1608871 | 4067.56 | 1582 | 1545 | 395.2 |
| B | 5 | 185 | 665750 | 1574.97 | 1989 | 1914 | 421.5 |
| B | 4 | 171 | 376293 | 888.23 | 1989 | 1914 | 421.5 |
| B | 10 | 247 | 341868 | 806.55 | 1989 | 1914 | 421.5 |
| C | 12 | 254 | 1416026 | 2687.59 | 1929 | 1916 | 526.2 |
| C | 5 | 250 | 590053 | 1117.78 | 1929 | 1916 | 526.2 |
| C | 6 | 223 | 584563 | 1107.35 | 1929 | 1916 | 526.2 |
| D | 8 | 129 | 3373469 | 6244.22 | 1910 | 1827 | 540.0 |
| D | 2 | 249 | 1104990 | 2043.04 | 1910 | 1827 | 540.0 |
| D | 15 | 115 | 564233 | 1041.57 | 1910 | 1827 | 540.0 |
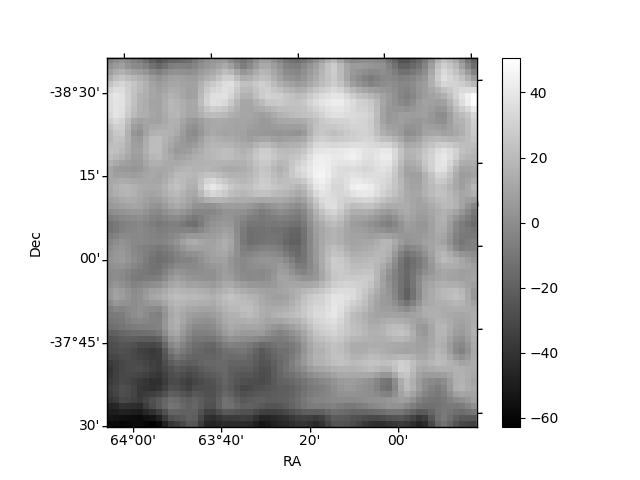
Histogram calculated using DETX and DETY for each event in the final _common_clean file
| Quadrant A |  |
 |
Quadrant B |
|---|---|---|---|
| Quadrant D |  |
 |
Quadrant C |
| Plot type | Count rate plots | Images |
|---|---|---|
| Comparison with Poisson distribution Blue bars denote a histogram of data divided into 1 sec bins. Red curve is a Poisson curve with rate = median count rate of data. |
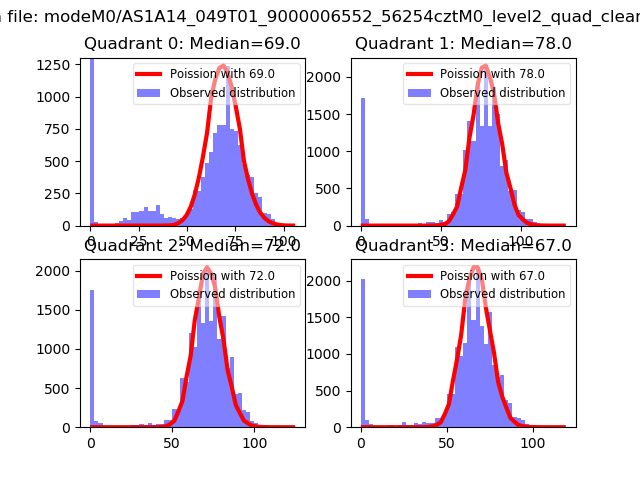 |
 |
| Quadrant-wise count rates Data is divided into 100 sec bins |
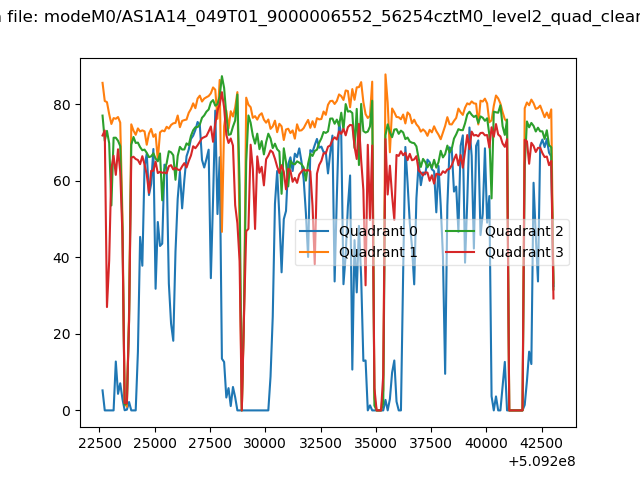 |
|
| Module-wise count rates for Quadrant A Data is divided into 100 sec bins |
 |
 |
| Module-wise count rates for Quadrant B Data is divided into 100 sec bins |
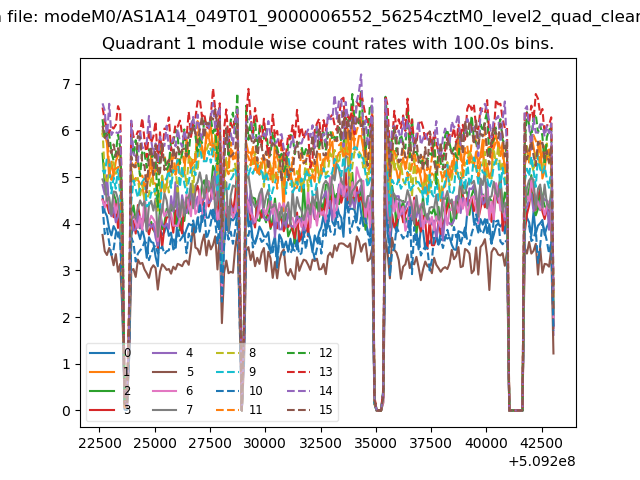 |
 |
| Module-wise count rates for Quadrant C Data is divided into 100 sec bins |
 |
 |
| Module-wise count rates for Quadrant D Data is divided into 100 sec bins |
 |
 |
| Parameter | Plot |
|---|---|
| CZT HV Monitor | 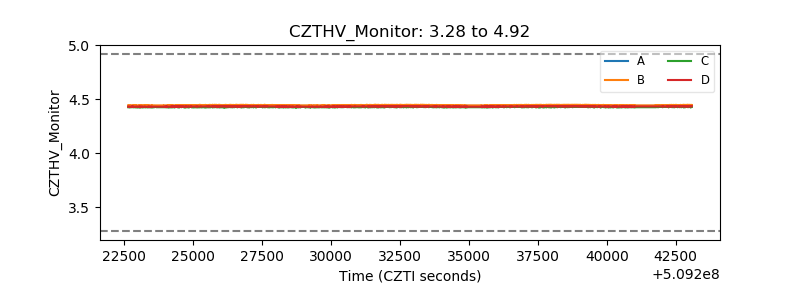 |
| D_VDD |  |
| Temperature 1 |  |
| Veto HV Monitor | 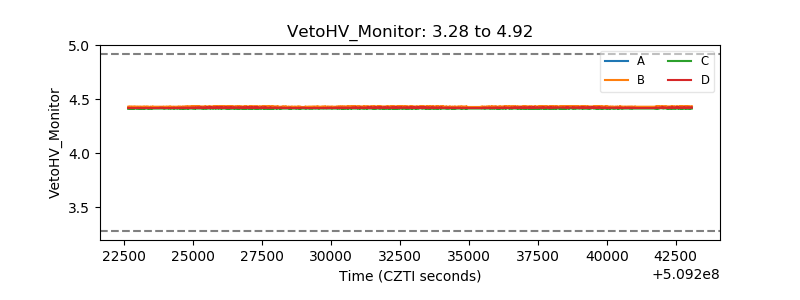 |
| Veto LLD | 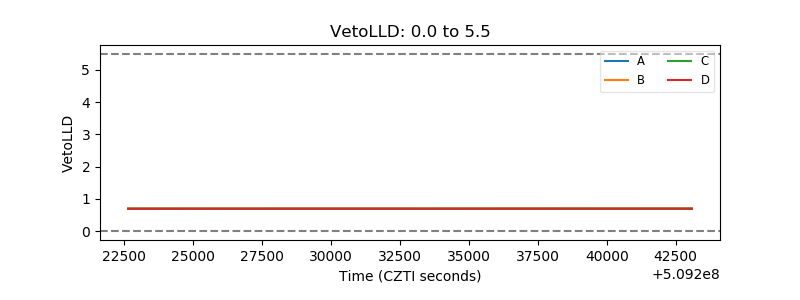 |
| Alpha Counter |  |
| _CPM_Rate | 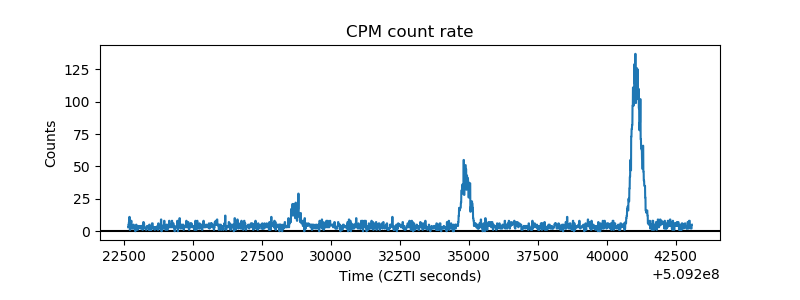 |
| CZT Counter |  |
| +2.5 Volts monitor |  |
| +5 Volts monitor | 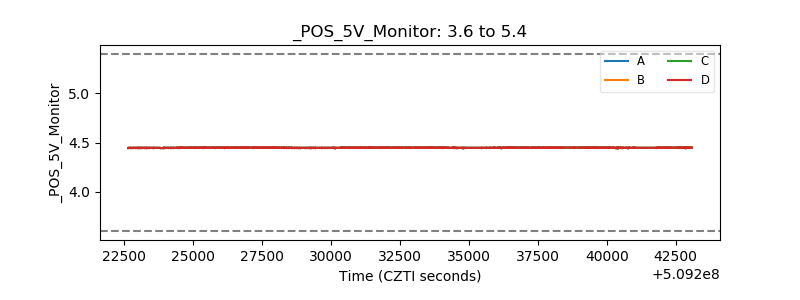 |
| _ROLL_ROT | 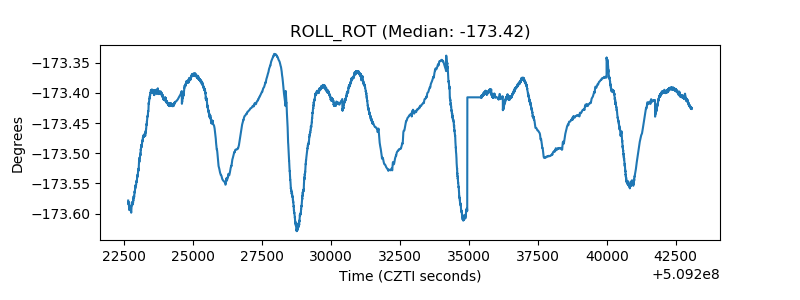 |
| _Roll_DEC | 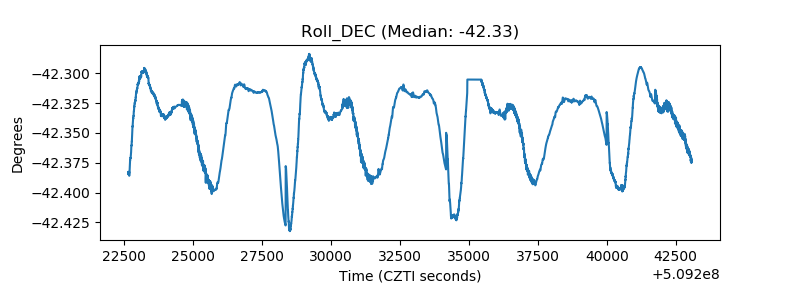 |
| _Roll_RA |  |
| Veto Counter | 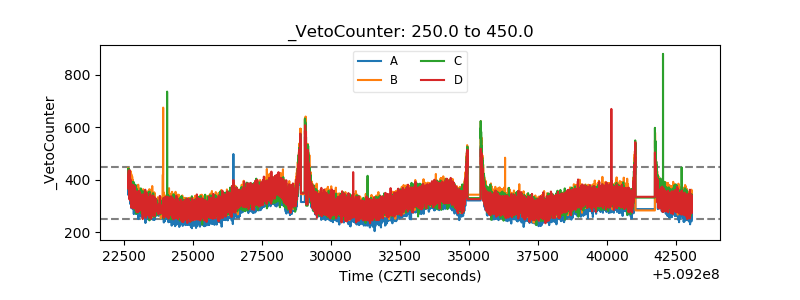 |