| Param | Original file | Final file |
|---|---|---|
| Filename | modeM0/AS1A14_049T01_9000006552_56257cztM0_level2.fits | modeM0/AS1A14_049T01_9000006552_56257cztM0_level2_quad_clean.evt |
| Size (bytes) | 614,900,160 | 92,476,800 |
| Size | 586.4 MB | 88.2 MB |
| Events in quadrant A | 11,025,664 | 476,641 |
| Events in quadrant B | 3,572,662 | 681,829 |
| Events in quadrant C | 3,778,357 | 606,256 |
| Events in quadrant D | 3,862,969 | 566,055 |
| Mode SS | |||
|---|---|---|---|
| Quadrant | BADHDUFLAG | Total packets | Discarded packets |
| A | 0 | 136 | 0 |
| B | 0 | 136 | 0 |
| C | 0 | 136 | 0 |
| D | 0 | 136 | 0 |
| Mode M9 | |||
|---|---|---|---|
| Quadrant | BADHDUFLAG | Total packets | Discarded packets |
| A | 0 | 10 | 0 |
| B | 0 | 11 | 0 |
| C | 0 | 11 | 0 |
| D | 0 | 11 | 0 |
| Mode M0 | |||
|---|---|---|---|
| Quadrant | BADHDUFLAG | Total packets | Discarded packets |
| A | 0 | 37435 | 6 |
| B | 0 | 15286 | 2 |
| C | 0 | 16197 | 2 |
| D | 0 | 16300 | 2 |
| Quadrant | Total seconds | Saturated seconds | Saturation percentage |
|---|---|---|---|
| A | 6732 | 2008 | 29.827689% |
| B | 6732 | 136 | 2.020202% |
| C | 6732 | 185 | 2.748069% |
| D | 6732 | 124 | 1.841949% |
Noise dominated data is calculated using 1-second bins in cleaned event files. If a bin has >2000 counts, and if more than 50% of those come from <1% of pixels, then it is considered to be noise-dominated and hence unusable.
| Quadrant | # 1 sec bins | Bins with >0 counts | Bins with >2000 counts | High rate bins dominated by noise | Noise dominated (total time) | Noise dominated (detector-on time) | Marked lightcurve |
|---|---|---|---|---|---|---|---|
| A | 7732 | 6733 | 1798 | 1798 | 23.25% | 26.70% |  |
| B | 7732 | 6733 | 46 | 46 | 0.59% | 0.68% |  |
| C | 7732 | 6733 | 112 | 112 | 1.45% | 1.66% | 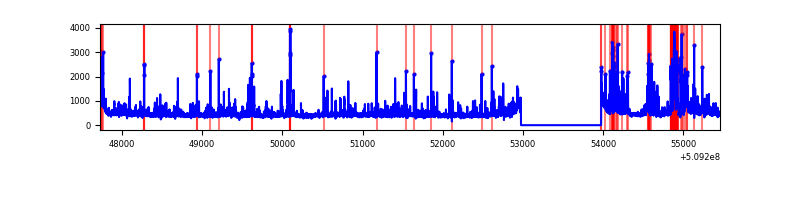 |
| D | 7732 | 6733 | 93 | 93 | 1.20% | 1.38% |  |
Top three noisy pixels from each quadrant. If the there are fewer than three noisy pixels in the level2.evt file, extra rows are filled as -1
| Pixel properties | Quadrant properties | ||||||
|---|---|---|---|---|---|---|---|
| Quadrant | DetID | PixID | Counts | Sigma | Mean | Median | Sigma |
| A | 8 | 176 | 4135090 | 25571.82 | 649 | 631 | 161.7 |
| A | 4 | 95 | 1638164 | 10128.22 | 649 | 631 | 161.7 |
| A | 12 | 115 | 782478 | 4835.76 | 649 | 631 | 161.7 |
| B | 5 | 185 | 299392 | 1942.02 | 719 | 694 | 153.8 |
| B | 10 | 247 | 74836 | 482.04 | 719 | 694 | 153.8 |
| B | 0 | 231 | 73950 | 476.28 | 719 | 694 | 153.8 |
| C | 12 | 254 | 349980 | 1817.1 | 705 | 699 | 192.2 |
| C | 13 | 3 | 272398 | 1413.49 | 705 | 699 | 192.2 |
| C | 12 | 252 | 238242 | 1235.79 | 705 | 699 | 192.2 |
| D | 8 | 129 | 450003 | 2305.03 | 696 | 664 | 194.9 |
| D | 2 | 249 | 260705 | 1333.97 | 696 | 664 | 194.9 |
| D | 11 | 129 | 149432 | 763.15 | 696 | 664 | 194.9 |
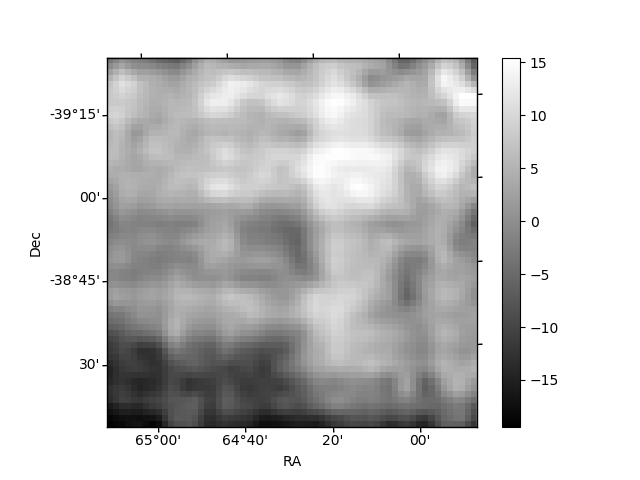
Histogram calculated using DETX and DETY for each event in the final _common_clean file
| Quadrant A |  |
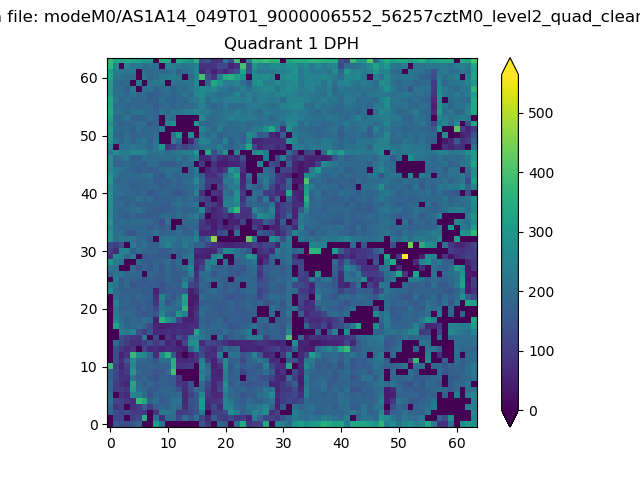 |
Quadrant B |
|---|---|---|---|
| Quadrant D |  |
 |
Quadrant C |
| Plot type | Count rate plots | Images |
|---|---|---|
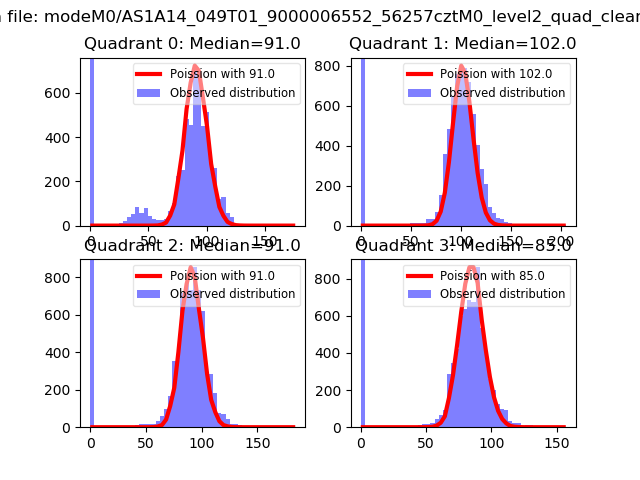
| Comparison with Poisson distribution Blue bars denote a histogram of data divided into 1 sec bins. Red curve is a Poisson curve with rate = median count rate of data. |
 |
 |
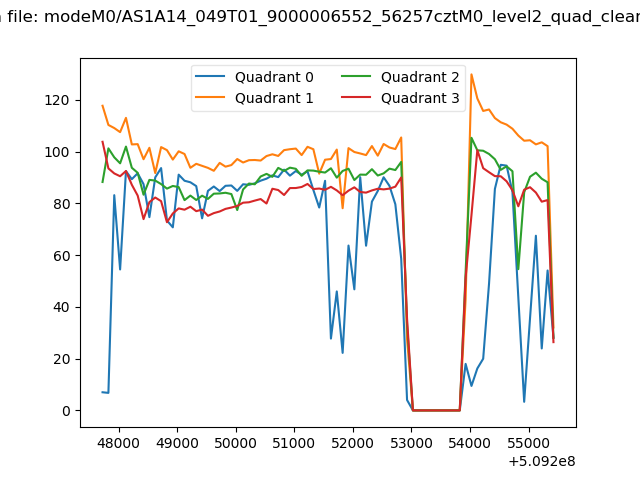
| Quadrant-wise count rates Data is divided into 100 sec bins |
 |
|
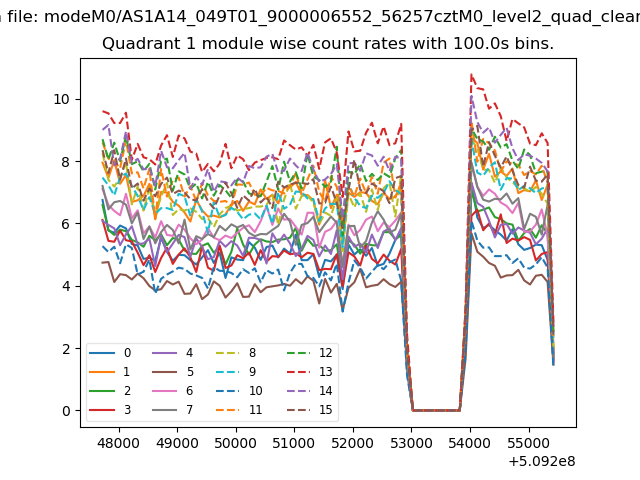
| Module-wise count rates for Quadrant A Data is divided into 100 sec bins |
 |
 |
| Module-wise count rates for Quadrant B Data is divided into 100 sec bins |
 |
 |
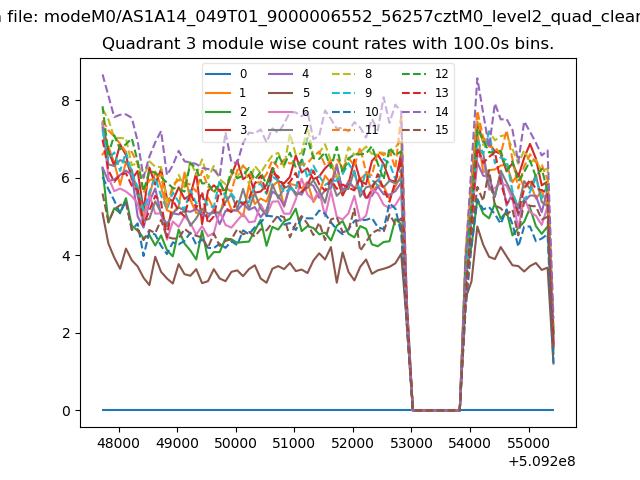
| Module-wise count rates for Quadrant C Data is divided into 100 sec bins |
 |
 |
| Module-wise count rates for Quadrant D Data is divided into 100 sec bins |
 |
 |
| Parameter | Plot |
|---|---|
| CZT HV Monitor | 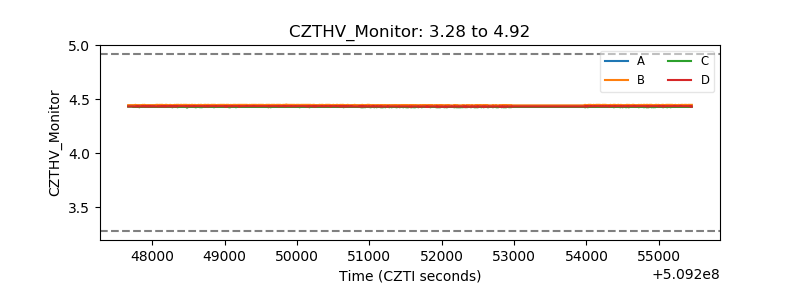 |
| D_VDD |  |
| Temperature 1 |  |
| Veto HV Monitor | 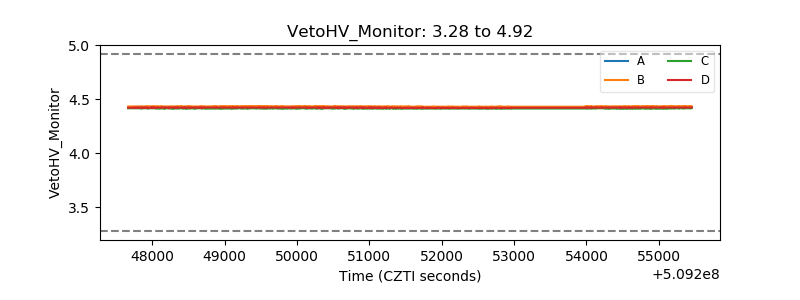 |
| Veto LLD | 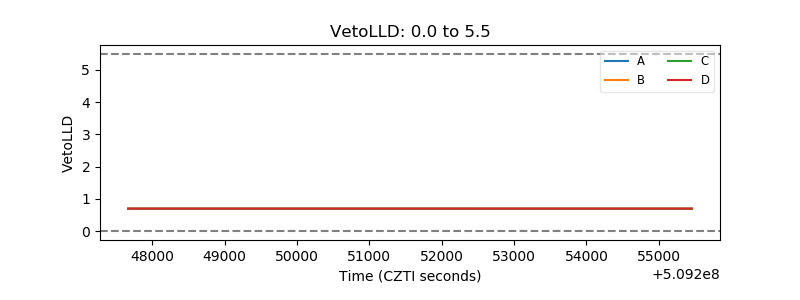 |
| Alpha Counter |  |
| _CPM_Rate | 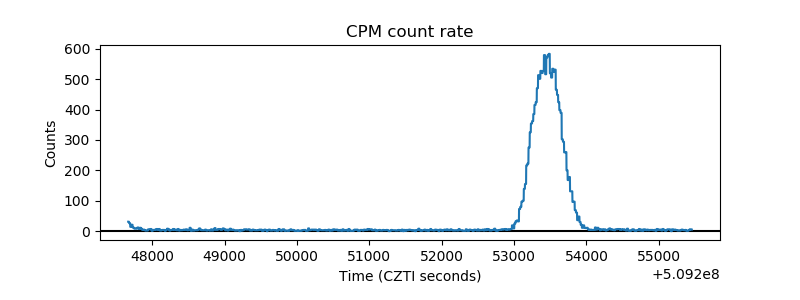 |
| CZT Counter |  |
| +2.5 Volts monitor |  |
| +5 Volts monitor | 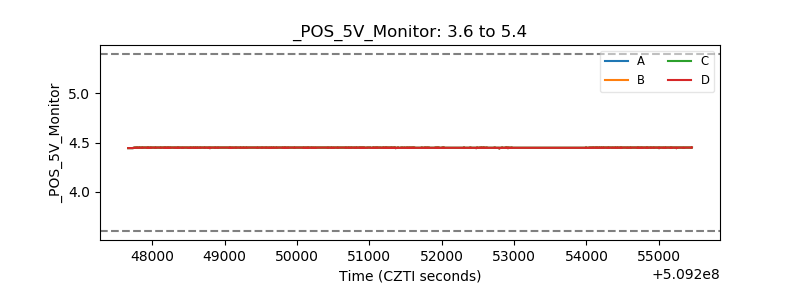 |
| _ROLL_ROT | 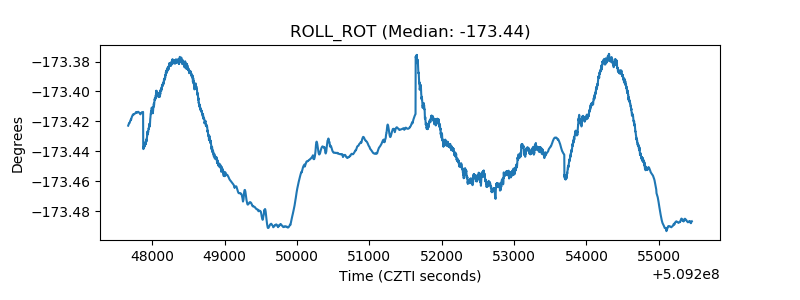 |
| _Roll_DEC | 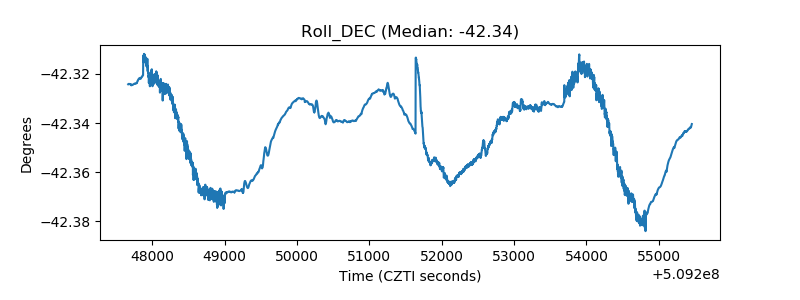 |
| _Roll_RA |  |
| Veto Counter | 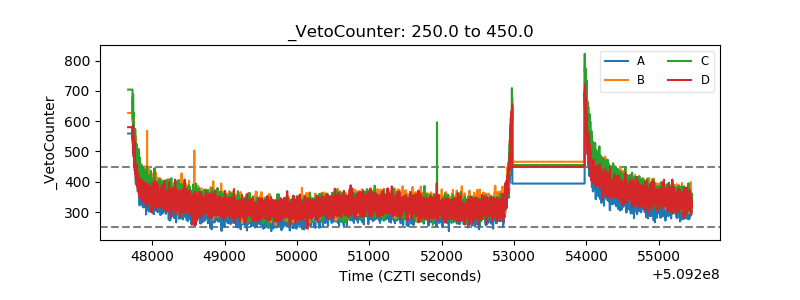 |