| Param | Original file | Final file |
|---|---|---|
| Filename | modeM0/AS1A14_049T01_9000006552_56258cztM0_level2.fits | modeM0/AS1A14_049T01_9000006552_56258cztM0_level2_quad_clean.evt |
| Size (bytes) | 742,314,240 | 86,120,640 |
| Size | 707.9 MB | 82.1 MB |
| Events in quadrant A | 14,359,156 | 245,889 |
| Events in quadrant B | 3,493,447 | 700,450 |
| Events in quadrant C | 4,165,796 | 621,449 |
| Events in quadrant D | 4,939,068 | 572,165 |
| Mode SS | |||
|---|---|---|---|
| Quadrant | BADHDUFLAG | Total packets | Discarded packets |
| A | 0 | 138 | 0 |
| B | 0 | 138 | 0 |
| C | 0 | 138 | 0 |
| D | 0 | 138 | 0 |
| Mode M9 | |||
|---|---|---|---|
| Quadrant | BADHDUFLAG | Total packets | Discarded packets |
| A | 0 | 21 | 0 |
| B | 0 | 21 | 0 |
| C | 0 | 21 | 0 |
| D | 0 | 21 | 0 |
| Mode M0 | |||
|---|---|---|---|
| Quadrant | BADHDUFLAG | Total packets | Discarded packets |
| A | 0 | 47259 | 2 |
| B | 0 | 14926 | 2 |
| C | 0 | 17099 | 2 |
| D | 0 | 19324 | 2 |
| Quadrant | Total seconds | Saturated seconds | Saturation percentage |
|---|---|---|---|
| A | 6708 | 4584 | 68.336315% |
| B | 6708 | 201 | 2.996422% |
| C | 6709 | 258 | 3.845581% |
| D | 6709 | 305 | 4.546132% |
Noise dominated data is calculated using 1-second bins in cleaned event files. If a bin has >2000 counts, and if more than 50% of those come from <1% of pixels, then it is considered to be noise-dominated and hence unusable.
| Quadrant | # 1 sec bins | Bins with >0 counts | Bins with >2000 counts | High rate bins dominated by noise | Noise dominated (total time) | Noise dominated (detector-on time) | Marked lightcurve |
|---|---|---|---|---|---|---|---|
| A | 8808 | 6710 | 3945 | 3945 | 44.79% | 58.79% |  |
| B | 8808 | 6709 | 25 | 25 | 0.28% | 0.37% |  |
| C | 8809 | 6711 | 128 | 128 | 1.45% | 1.91% | 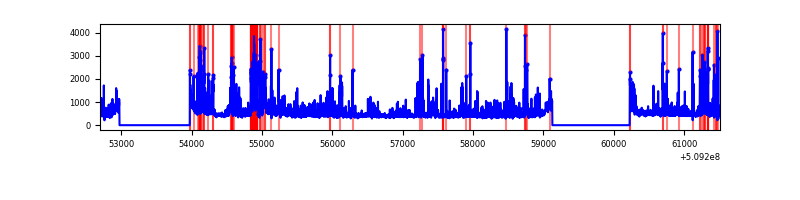 |
| D | 8809 | 6711 | 227 | 227 | 2.58% | 3.38% |  |
Top three noisy pixels from each quadrant. If the there are fewer than three noisy pixels in the level2.evt file, extra rows are filled as -1
| Pixel properties | Quadrant properties | ||||||
|---|---|---|---|---|---|---|---|
| Quadrant | DetID | PixID | Counts | Sigma | Mean | Median | Sigma |
| A | 15 | 32 | 4299811 | 32855.19 | 532 | 519 | 130.9 |
| A | 8 | 176 | 3433937 | 26238.18 | 532 | 519 | 130.9 |
| A | 12 | 115 | 2347599 | 17936.39 | 532 | 519 | 130.9 |
| B | 5 | 185 | 175033 | 1103.96 | 740 | 713 | 157.9 |
| B | 0 | 63 | 130898 | 824.45 | 740 | 713 | 157.9 |
| B | 10 | 247 | 51437 | 321.23 | 740 | 713 | 157.9 |
| C | 12 | 254 | 574423 | 2911.51 | 729 | 723 | 197.0 |
| C | 13 | 3 | 300686 | 1522.31 | 729 | 723 | 197.0 |
| C | 12 | 252 | 234712 | 1187.49 | 729 | 723 | 197.0 |
| D | 8 | 129 | 497108 | 2466.1 | 715 | 683 | 201.3 |
| D | 8 | 160 | 387715 | 1922.67 | 715 | 683 | 201.3 |
| D | 2 | 249 | 373249 | 1850.8 | 715 | 683 | 201.3 |
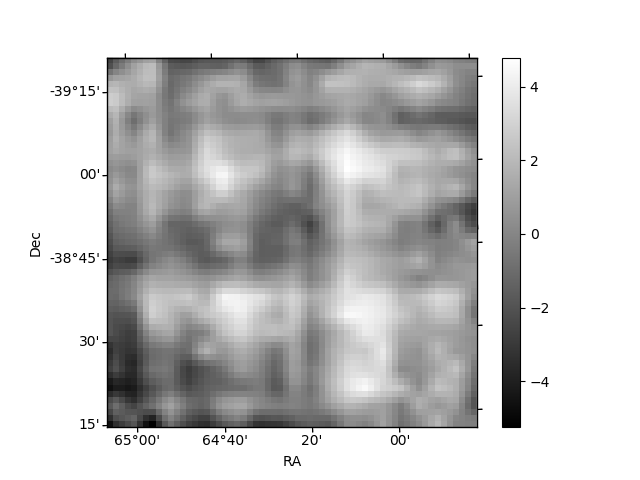
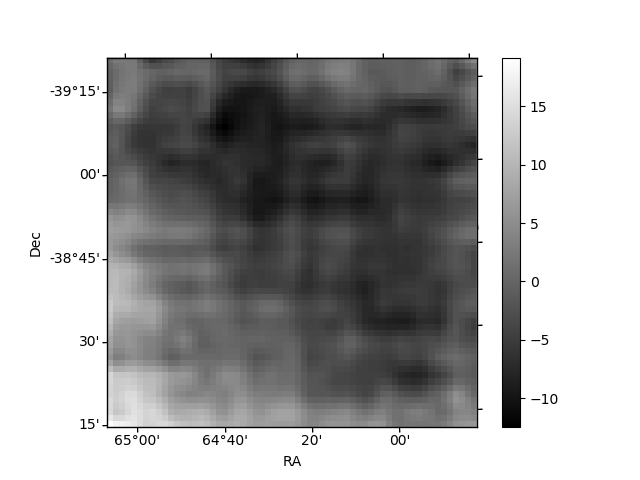
Histogram calculated using DETX and DETY for each event in the final _common_clean file
| Quadrant A | 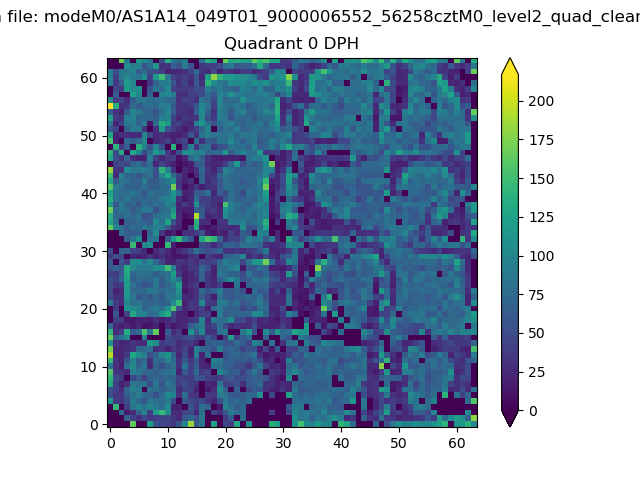 |
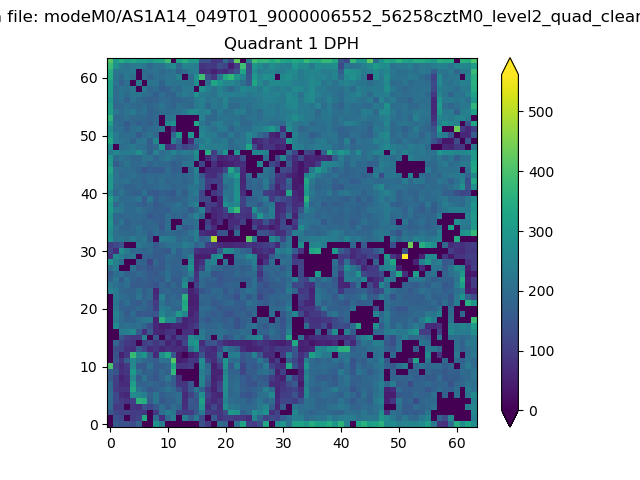 |
Quadrant B |
|---|---|---|---|
| Quadrant D |  |
 |
Quadrant C |
| Plot type | Count rate plots | Images |
|---|---|---|
| Comparison with Poisson distribution Blue bars denote a histogram of data divided into 1 sec bins. Red curve is a Poisson curve with rate = median count rate of data. |
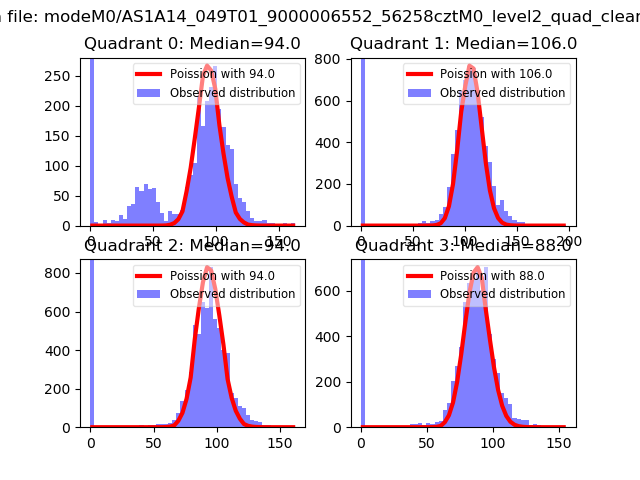 |
 |
| Quadrant-wise count rates Data is divided into 100 sec bins |
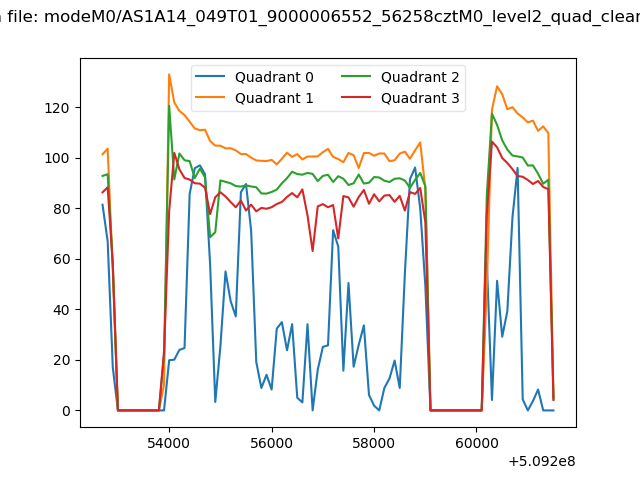 |
|
| Module-wise count rates for Quadrant A Data is divided into 100 sec bins |
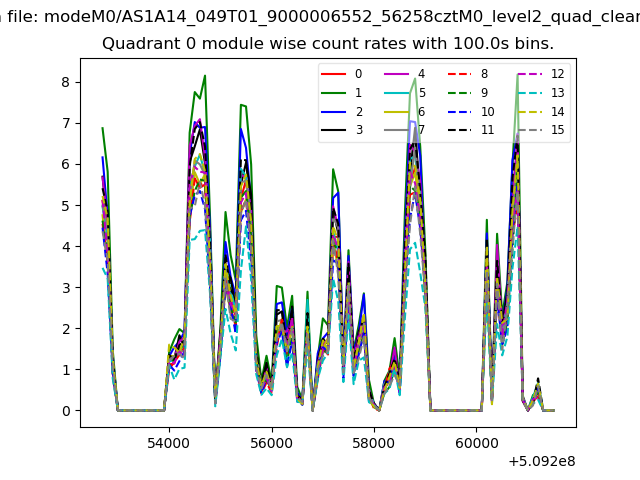 |
 |
| Module-wise count rates for Quadrant B Data is divided into 100 sec bins |
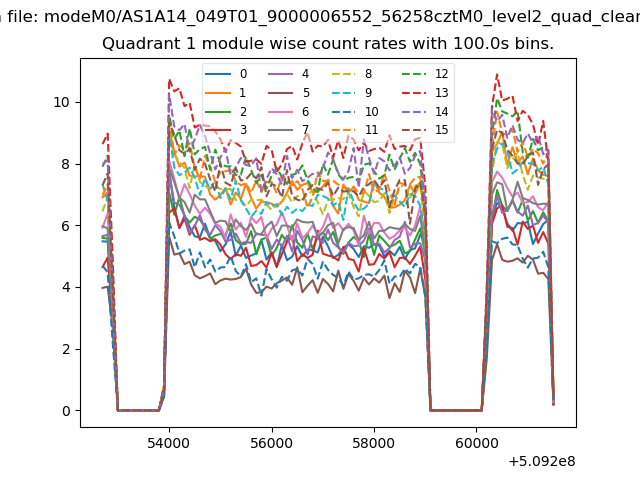 |
 |
| Module-wise count rates for Quadrant C Data is divided into 100 sec bins |
 |
 |
| Module-wise count rates for Quadrant D Data is divided into 100 sec bins |
 |
 |
| Parameter | Plot |
|---|---|
| CZT HV Monitor |  |
| D_VDD |  |
| Temperature 1 |  |
| Veto HV Monitor | 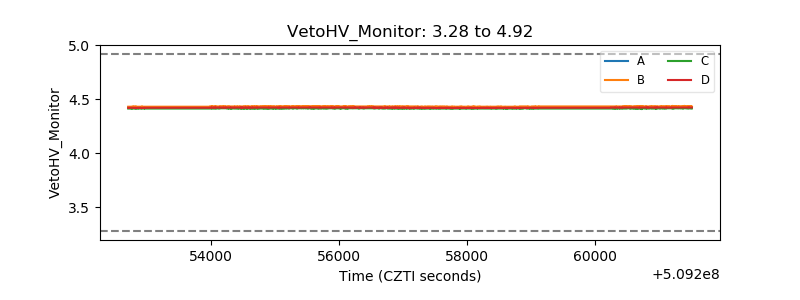 |
| Veto LLD | 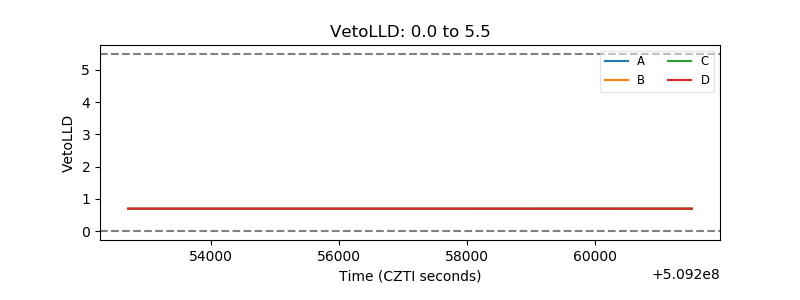 |
| Alpha Counter | 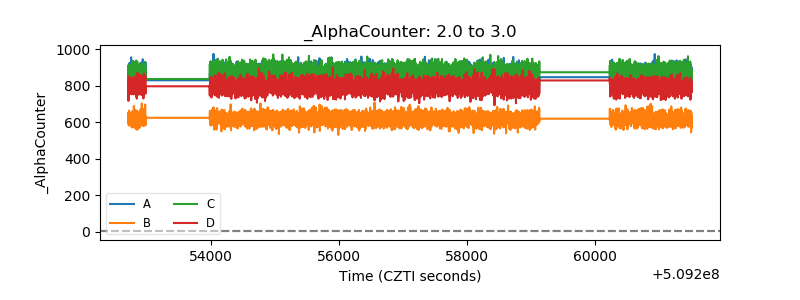 |
| _CPM_Rate | 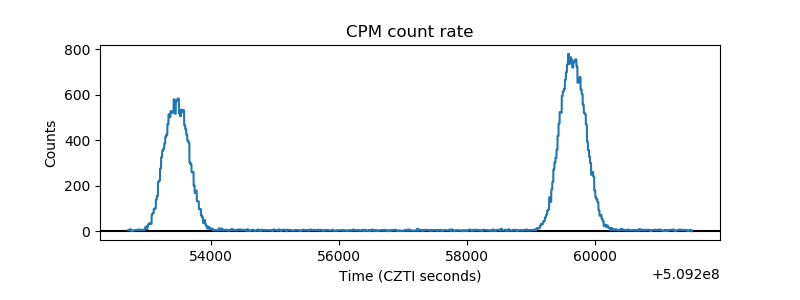 |
| CZT Counter |  |
| +2.5 Volts monitor |  |
| +5 Volts monitor |  |
| _ROLL_ROT | 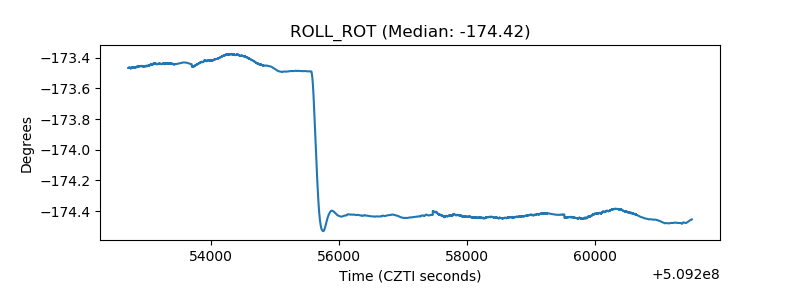 |
| _Roll_DEC | 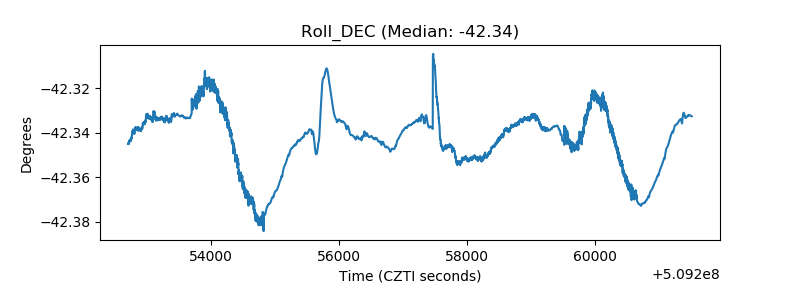 |
| _Roll_RA |  |
| Veto Counter | 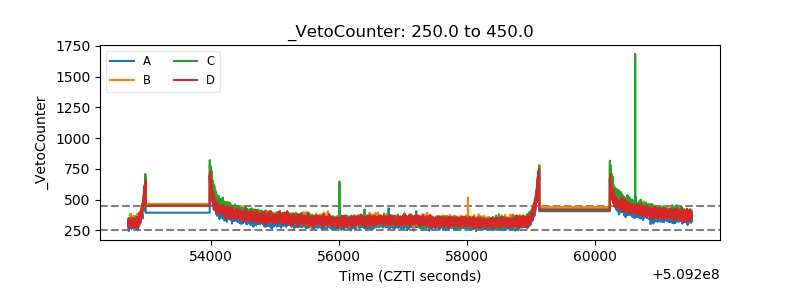 |