| Param | Original file | Final file |
|---|---|---|
| Filename | modeM0/AS1A14_049T01_9000006552_56261cztM0_level2.fits | modeM0/AS1A14_049T01_9000006552_56261cztM0_level2_quad_clean.evt |
| Size (bytes) | 822,349,440 | 77,771,520 |
| Size | 784.3 MB | 74.2 MB |
| Events in quadrant A | 14,868,742 | 165,211 |
| Events in quadrant B | 3,878,175 | 680,579 |
| Events in quadrant C | 6,938,980 | 482,528 |
| Events in quadrant D | 4,251,243 | 573,401 |
| Mode SS | |||
|---|---|---|---|
| Quadrant | BADHDUFLAG | Total packets | Discarded packets |
| A | 0 | 132 | 0 |
| B | 0 | 132 | 0 |
| C | 0 | 132 | 0 |
| D | 0 | 132 | 0 |
| Mode M9 | |||
|---|---|---|---|
| Quadrant | BADHDUFLAG | Total packets | Discarded packets |
| A | 0 | 10 | 0 |
| B | 0 | 10 | 0 |
| C | 0 | 10 | 0 |
| D | 0 | 10 | 0 |
| Mode M0 | |||
|---|---|---|---|
| Quadrant | BADHDUFLAG | Total packets | Discarded packets |
| A | 0 | 48609 | 1 |
| B | 0 | 15806 | 1 |
| C | 0 | 25022 | 1 |
| D | 0 | 16924 | 1 |
| Quadrant | Total seconds | Saturated seconds | Saturation percentage |
|---|---|---|---|
| A | 6494 | 5034 | 77.517709% |
| B | 6494 | 274 | 4.219279% |
| C | 6495 | 1762 | 27.128560% |
| D | 6495 | 208 | 3.202463% |
Noise dominated data is calculated using 1-second bins in cleaned event files. If a bin has >2000 counts, and if more than 50% of those come from <1% of pixels, then it is considered to be noise-dominated and hence unusable.
| Quadrant | # 1 sec bins | Bins with >0 counts | Bins with >2000 counts | High rate bins dominated by noise | Noise dominated (total time) | Noise dominated (detector-on time) | Marked lightcurve |
|---|---|---|---|---|---|---|---|
| A | 7533 | 6493 | 4776 | 4776 | 63.40% | 73.56% |  |
| B | 7534 | 6495 | 47 | 47 | 0.62% | 0.72% | 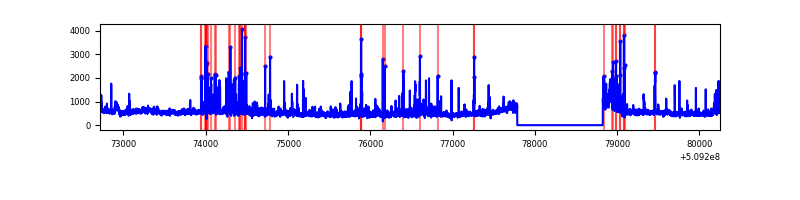 |
| C | 7535 | 6496 | 917 | 917 | 12.17% | 14.12% | 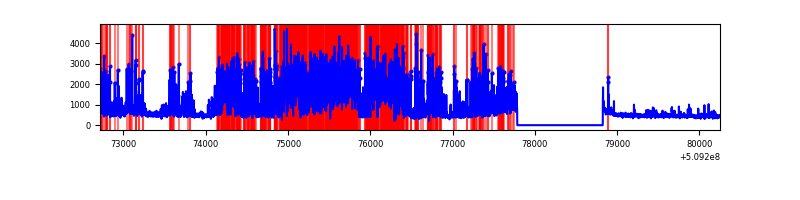 |
| D | 7535 | 6496 | 120 | 120 | 1.59% | 1.85% |  |
Top three noisy pixels from each quadrant. If the there are fewer than three noisy pixels in the level2.evt file, extra rows are filled as -1
| Pixel properties | Quadrant properties | ||||||
|---|---|---|---|---|---|---|---|
| Quadrant | DetID | PixID | Counts | Sigma | Mean | Median | Sigma |
| A | 12 | 115 | 6205901 | 56907.57 | 430 | 419 | 109.0 |
| A | 8 | 176 | 3910084 | 35853.71 | 430 | 419 | 109.0 |
| A | 15 | 32 | 2312152 | 21199.82 | 430 | 419 | 109.0 |
| B | 5 | 185 | 332620 | 2194.11 | 716 | 690 | 151.3 |
| B | 0 | 63 | 186345 | 1227.21 | 716 | 690 | 151.3 |
| B | 4 | 21 | 90067 | 590.8 | 716 | 690 | 151.3 |
| C | 15 | 230 | 3638788 | 21083.45 | 627 | 620 | 172.6 |
| C | 12 | 254 | 364059 | 2106.16 | 627 | 620 | 172.6 |
| C | 9 | 237 | 130288 | 751.44 | 627 | 620 | 172.6 |
| D | 8 | 129 | 643107 | 3247.01 | 704 | 672 | 197.9 |
| D | 2 | 249 | 318901 | 1608.4 | 704 | 672 | 197.9 |
| D | 2 | 31 | 187071 | 942.1 | 704 | 672 | 197.9 |
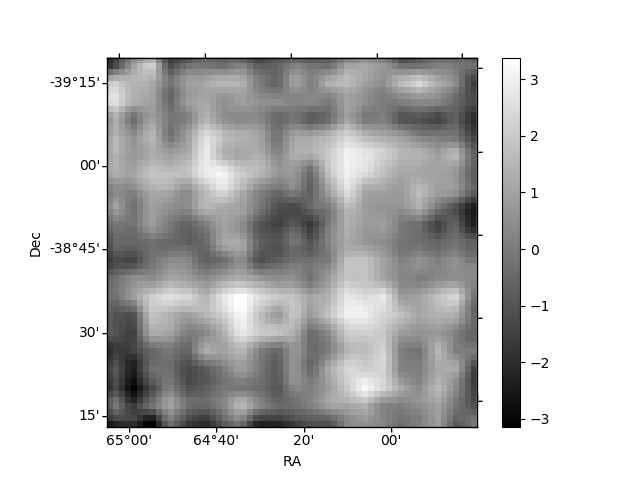
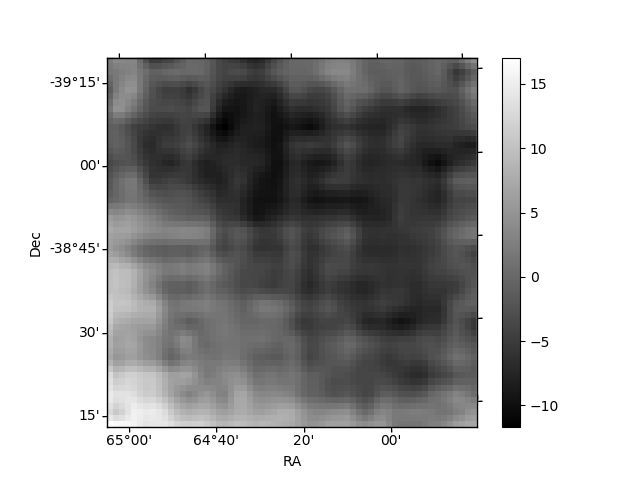
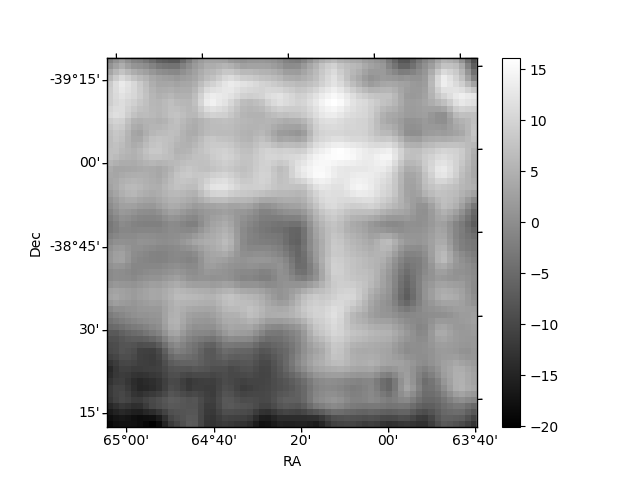
Histogram calculated using DETX and DETY for each event in the final _common_clean file
| Quadrant A | 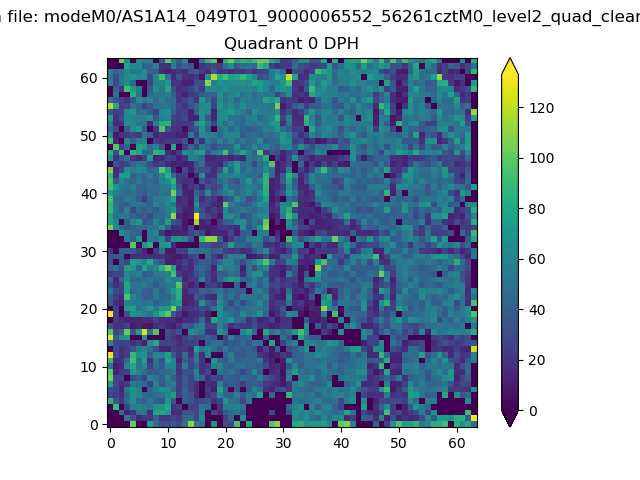 |
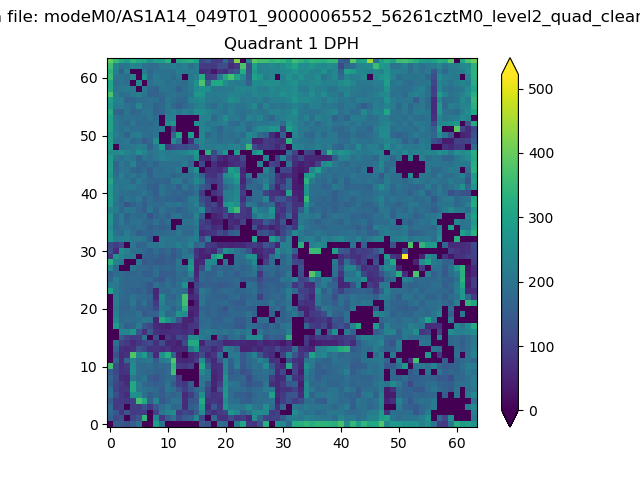 |
Quadrant B |
|---|---|---|---|
| Quadrant D | 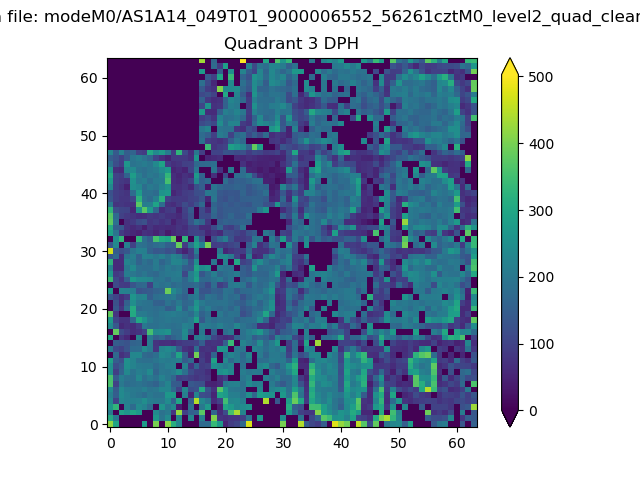 |
 |
Quadrant C |
| Plot type | Count rate plots | Images |
|---|---|---|
| Comparison with Poisson distribution Blue bars denote a histogram of data divided into 1 sec bins. Red curve is a Poisson curve with rate = median count rate of data. |
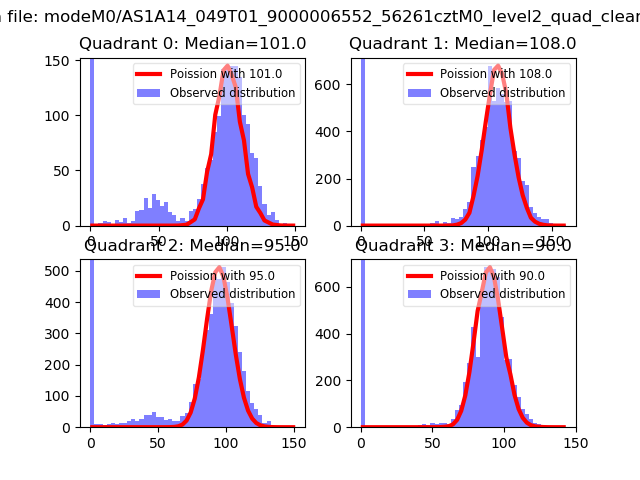 |
 |
| Quadrant-wise count rates Data is divided into 100 sec bins |
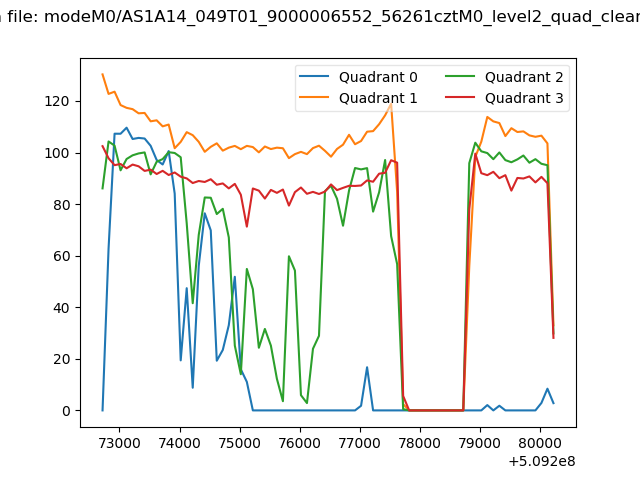 |
|
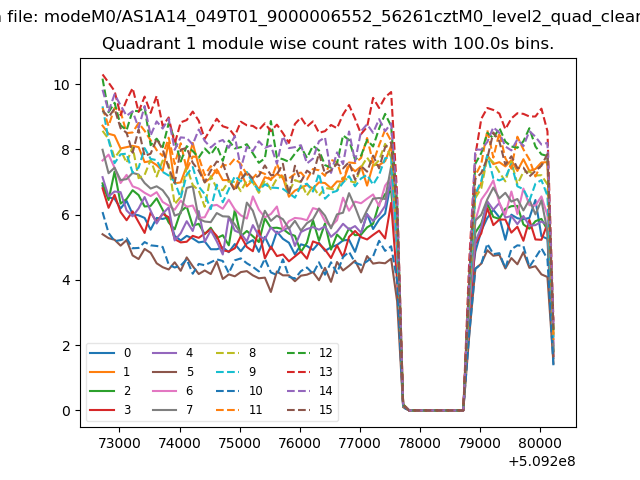
| Module-wise count rates for Quadrant A Data is divided into 100 sec bins |
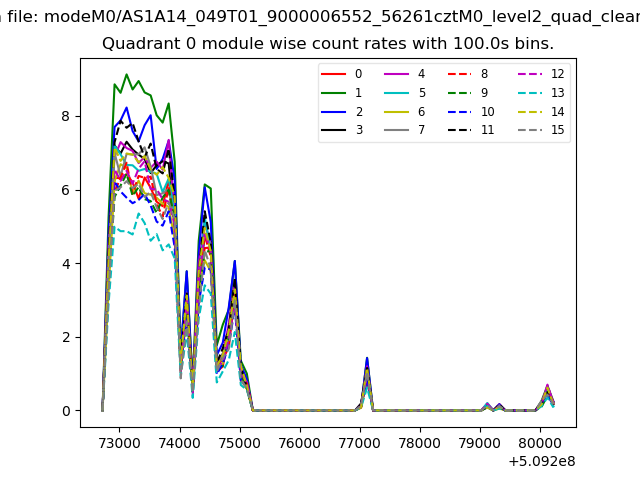 |
 |
| Module-wise count rates for Quadrant B Data is divided into 100 sec bins |
 |
 |
| Module-wise count rates for Quadrant C Data is divided into 100 sec bins |
 |
 |
| Module-wise count rates for Quadrant D Data is divided into 100 sec bins |
 |
 |
| Parameter | Plot |
|---|---|
| CZT HV Monitor |  |
| D_VDD | 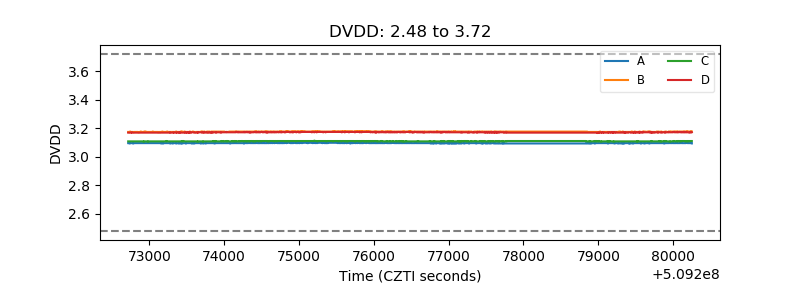 |
| Temperature 1 | 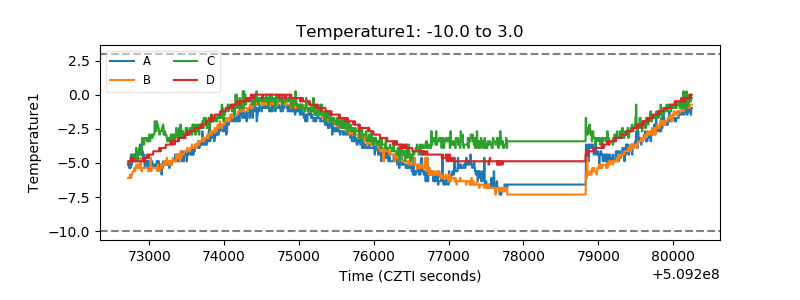 |
| Veto HV Monitor | 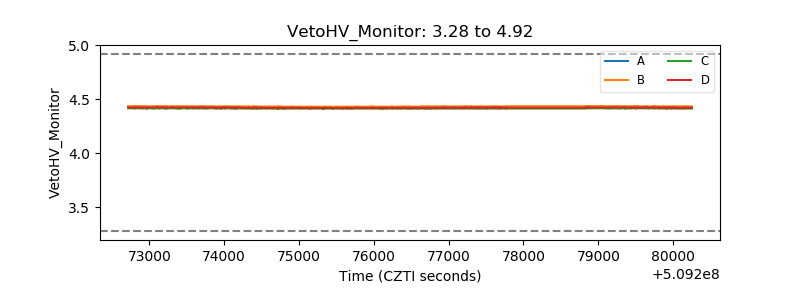 |
| Veto LLD | 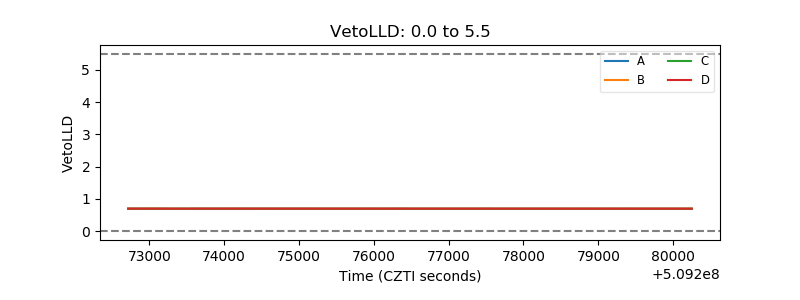 |
| Alpha Counter |  |
| _CPM_Rate | 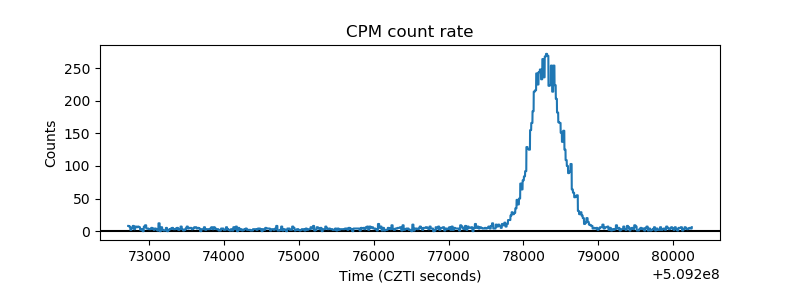 |
| CZT Counter | 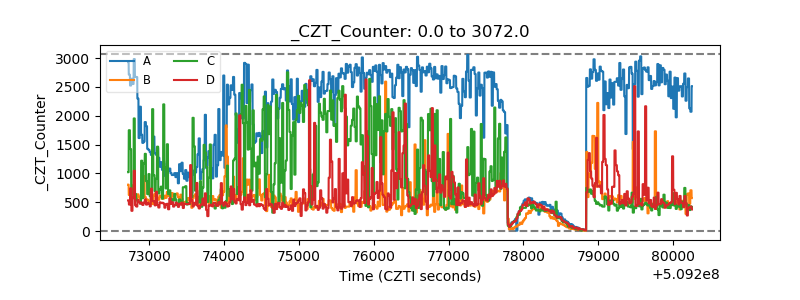 |
| +2.5 Volts monitor |  |
| +5 Volts monitor |  |
| _ROLL_ROT | 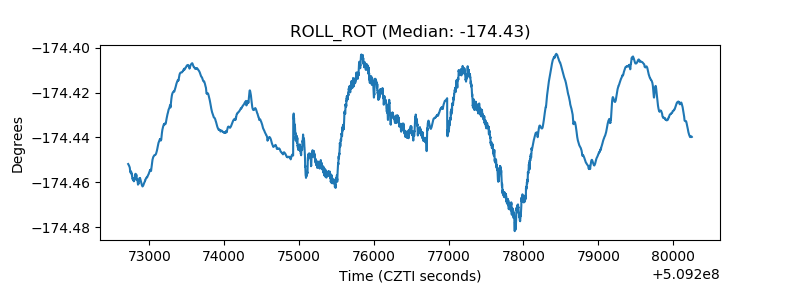 |
| _Roll_DEC | 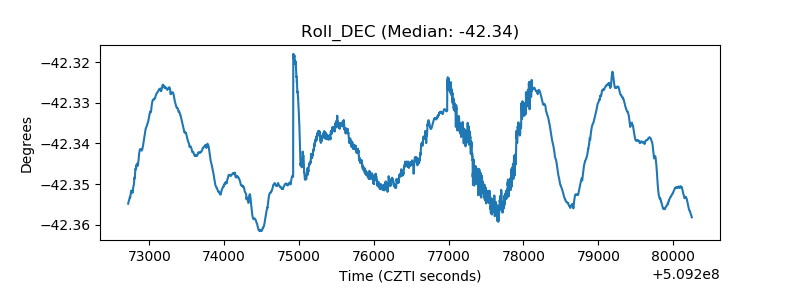 |
| _Roll_RA | 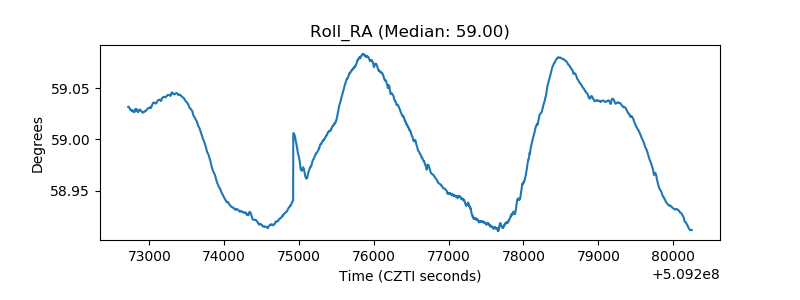 |
| Veto Counter | 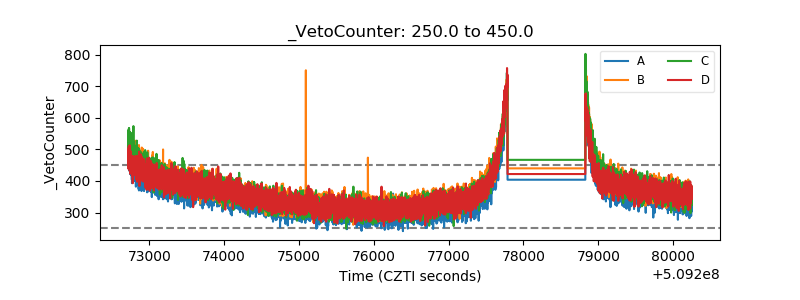 |