| Param | Original file | Final file |
|---|---|---|
| Filename | modeM0/AS1A14_049T01_9000006552_56262cztM0_level2.fits | modeM0/AS1A14_049T01_9000006552_56262cztM0_level2_quad_clean.evt |
| Size (bytes) | 837,506,880 | 80,087,040 |
| Size | 798.7 MB | 76.4 MB |
| Events in quadrant A | 16,944,180 | 74,239 |
| Events in quadrant B | 4,262,527 | 691,646 |
| Events in quadrant C | 4,893,744 | 603,274 |
| Events in quadrant D | 4,372,774 | 581,030 |
| Mode SS | |||
|---|---|---|---|
| Quadrant | BADHDUFLAG | Total packets | Discarded packets |
| A | 0 | 138 | 0 |
| B | 0 | 138 | 0 |
| C | 0 | 138 | 0 |
| D | 0 | 138 | 0 |
| Mode M9 | |||
|---|---|---|---|
| Quadrant | BADHDUFLAG | Total packets | Discarded packets |
| A | 0 | 8 | 0 |
| B | 0 | 8 | 0 |
| C | 0 | 8 | 0 |
| D | 0 | 8 | 0 |
| Mode M0 | |||
|---|---|---|---|
| Quadrant | BADHDUFLAG | Total packets | Discarded packets |
| A | 0 | 54840 | 8 |
| B | 0 | 17259 | 1 |
| C | 0 | 19334 | 1 |
| D | 0 | 17690 | 1 |
| Quadrant | Total seconds | Saturated seconds | Saturation percentage |
|---|---|---|---|
| A | 6811 | 6186 | 90.823668% |
| B | 6811 | 250 | 3.670533% |
| C | 6812 | 540 | 7.927187% |
| D | 6812 | 267 | 3.919554% |
Noise dominated data is calculated using 1-second bins in cleaned event files. If a bin has >2000 counts, and if more than 50% of those come from <1% of pixels, then it is considered to be noise-dominated and hence unusable.
| Quadrant | # 1 sec bins | Bins with >0 counts | Bins with >2000 counts | High rate bins dominated by noise | Noise dominated (total time) | Noise dominated (detector-on time) | Marked lightcurve |
|---|---|---|---|---|---|---|---|
| A | 7675 | 6810 | 5661 | 5661 | 73.76% | 83.13% |  |
| B | 7676 | 6812 | 62 | 62 | 0.81% | 0.91% |  |
| C | 7677 | 6813 | 383 | 383 | 4.99% | 5.62% | 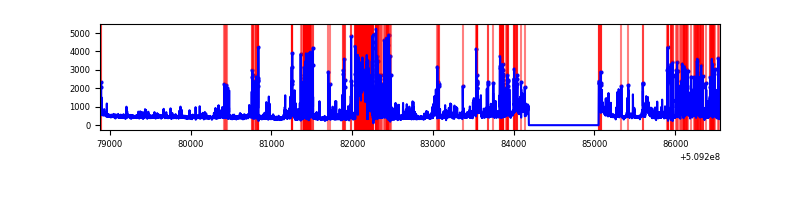 |
| D | 7677 | 6813 | 194 | 194 | 2.53% | 2.85% |  |
Top three noisy pixels from each quadrant. If the there are fewer than three noisy pixels in the level2.evt file, extra rows are filled as -1
| Pixel properties | Quadrant properties | ||||||
|---|---|---|---|---|---|---|---|
| Quadrant | DetID | PixID | Counts | Sigma | Mean | Median | Sigma |
| A | 12 | 115 | 8291235 | 90384.94 | 364 | 354 | 91.7 |
| A | 8 | 176 | 3291310 | 35877.11 | 364 | 354 | 91.7 |
| A | 15 | 32 | 2867287 | 31254.53 | 364 | 354 | 91.7 |
| B | 5 | 185 | 339592 | 2191.95 | 737 | 710 | 154.6 |
| B | 0 | 63 | 250307 | 1614.44 | 737 | 710 | 154.6 |
| B | 0 | 231 | 181661 | 1170.42 | 737 | 710 | 154.6 |
| C | 13 | 3 | 1016181 | 5224.97 | 710 | 704 | 194.4 |
| C | 12 | 254 | 745943 | 3834.51 | 710 | 704 | 194.4 |
| C | 12 | 252 | 113543 | 580.59 | 710 | 704 | 194.4 |
| D | 8 | 129 | 462378 | 2276.49 | 721 | 688 | 202.8 |
| D | 2 | 249 | 395538 | 1946.92 | 721 | 688 | 202.8 |
| D | 11 | 176 | 255268 | 1255.28 | 721 | 688 | 202.8 |
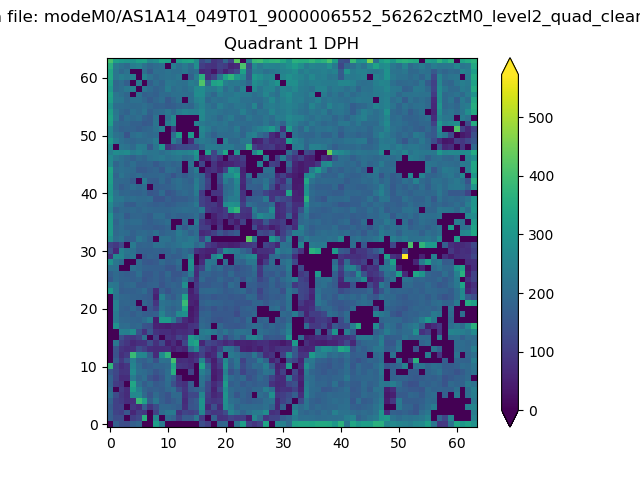
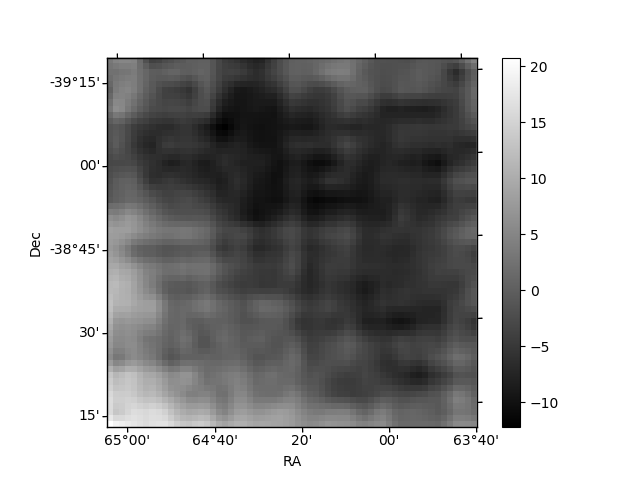
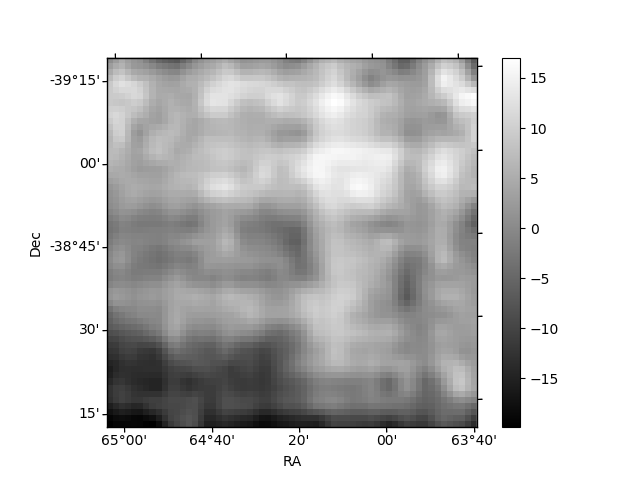
Histogram calculated using DETX and DETY for each event in the final _common_clean file
| Quadrant A |  |
 |
Quadrant B |
|---|---|---|---|
| Quadrant D | 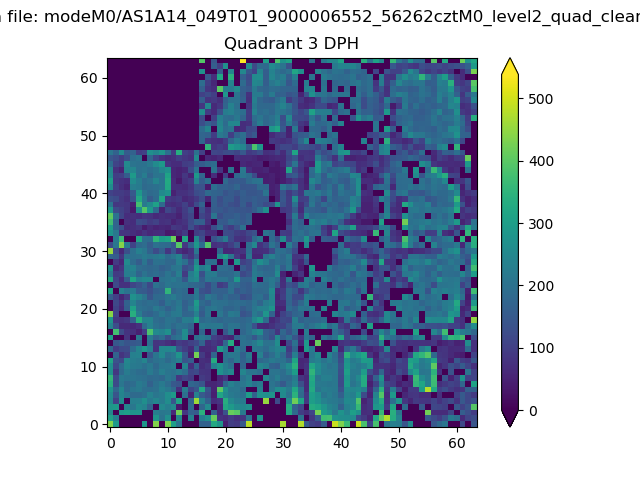 |
 |
Quadrant C |
| Plot type | Count rate plots | Images |
|---|---|---|
| Comparison with Poisson distribution Blue bars denote a histogram of data divided into 1 sec bins. Red curve is a Poisson curve with rate = median count rate of data. |
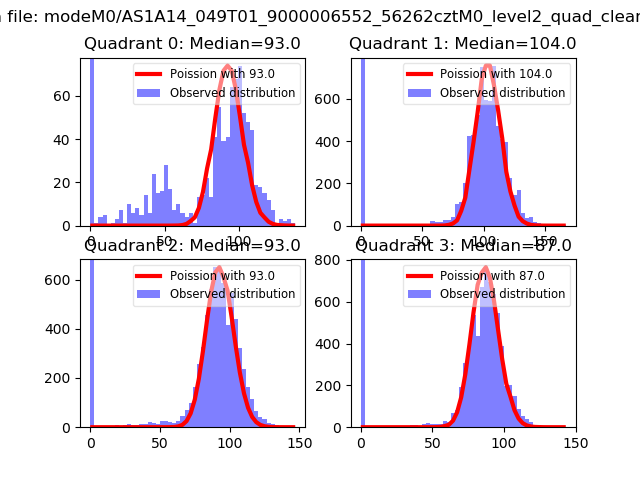 |
 |
| Quadrant-wise count rates Data is divided into 100 sec bins |
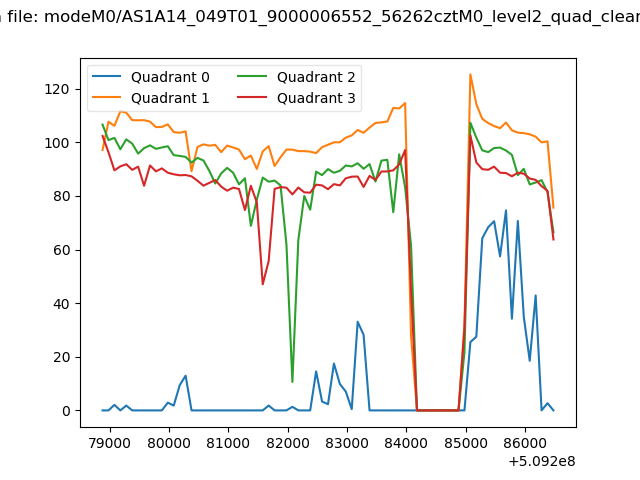 |
|
| Module-wise count rates for Quadrant A Data is divided into 100 sec bins |
 |
 |
| Module-wise count rates for Quadrant B Data is divided into 100 sec bins |
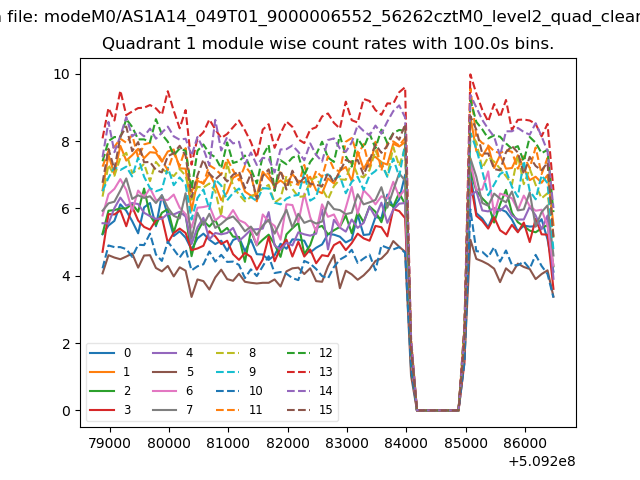 |
 |
| Module-wise count rates for Quadrant C Data is divided into 100 sec bins |
 |
 |
| Module-wise count rates for Quadrant D Data is divided into 100 sec bins |
 |
 |
| Parameter | Plot |
|---|---|
| CZT HV Monitor | 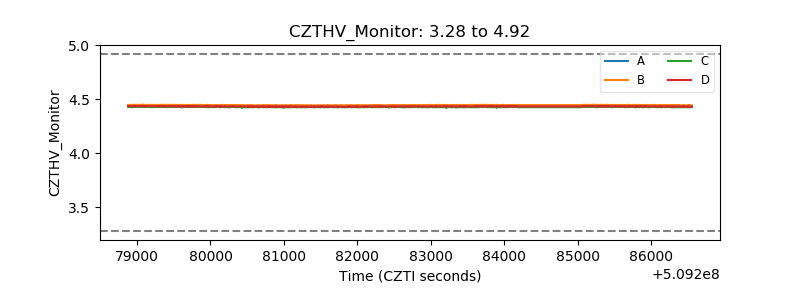 |
| D_VDD |  |
| Temperature 1 |  |
| Veto HV Monitor | 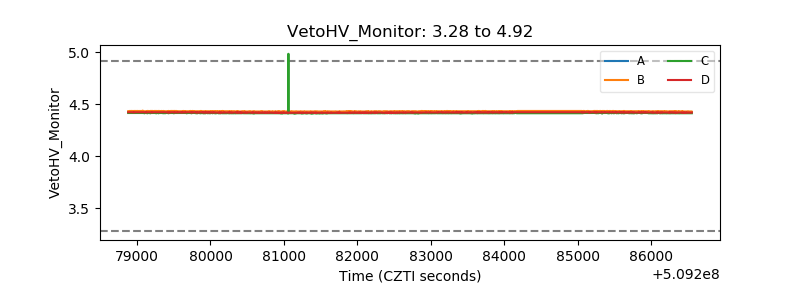 |
| Veto LLD | 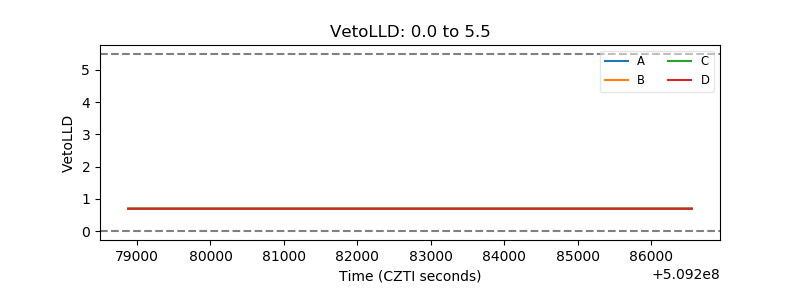 |
| Alpha Counter |  |
| _CPM_Rate | 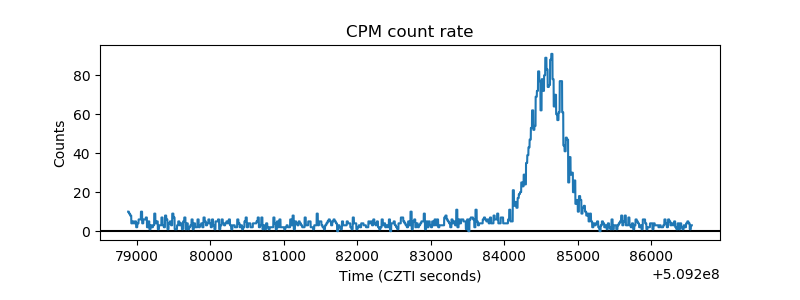 |
| CZT Counter |  |
| +2.5 Volts monitor |  |
| +5 Volts monitor | 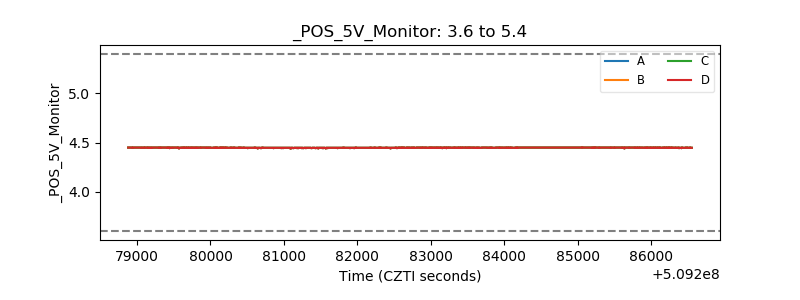 |
| _ROLL_ROT | 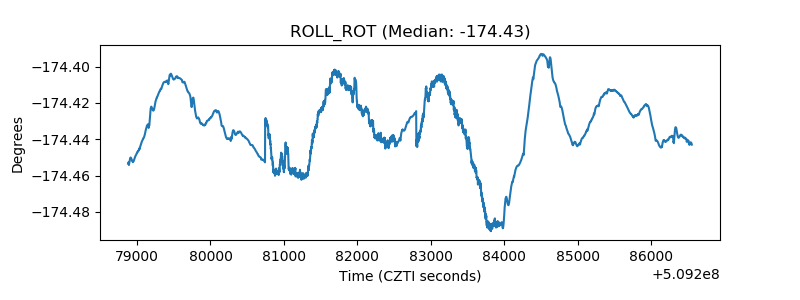 |
| _Roll_DEC | 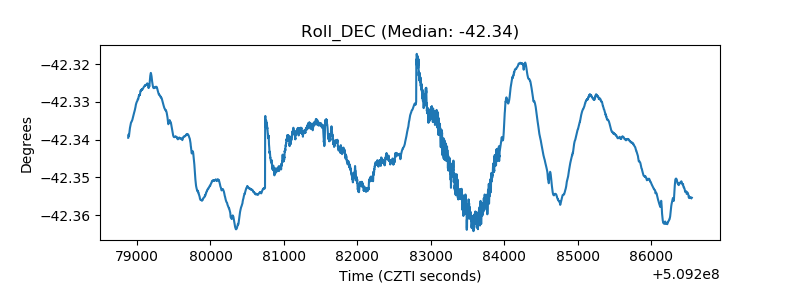 |
| _Roll_RA |  |
| Veto Counter | 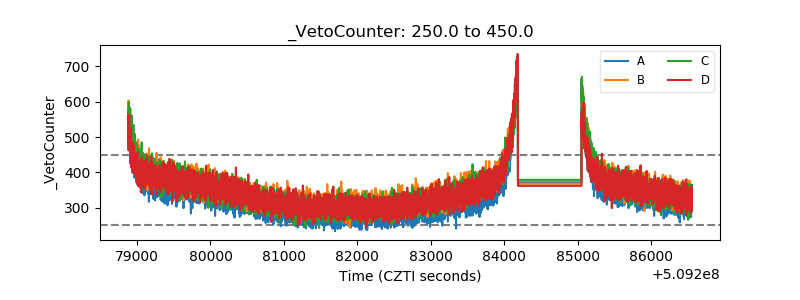 |