| Param | Original file | Final file |
|---|---|---|
| Filename | modeM0/AS1A14_049T01_9000006552_56264cztM0_level2.fits | modeM0/AS1A14_049T01_9000006552_56264cztM0_level2_quad_clean.evt |
| Size (bytes) | 976,124,160 | 76,167,360 |
| Size | 930.9 MB | 72.6 MB |
| Events in quadrant A | 15,176,015 | 210,443 |
| Events in quadrant B | 3,914,528 | 709,882 |
| Events in quadrant C | 10,742,108 | 358,810 |
| Events in quadrant D | 5,757,357 | 537,932 |
| Mode SS | |||
|---|---|---|---|
| Quadrant | BADHDUFLAG | Total packets | Discarded packets |
| A | 0 | 140 | 0 |
| B | 0 | 140 | 0 |
| C | 0 | 140 | 0 |
| D | 0 | 140 | 0 |
| Mode M0 | |||
|---|---|---|---|
| Quadrant | BADHDUFLAG | Total packets | Discarded packets |
| A | 0 | 49925 | 5 |
| B | 0 | 16297 | 0 |
| C | 0 | 36811 | 0 |
| D | 0 | 21945 | 0 |
| Quadrant | Total seconds | Saturated seconds | Saturation percentage |
|---|---|---|---|
| A | 7016 | 4997 | 71.222919% |
| B | 7017 | 76 | 1.083084% |
| C | 7017 | 3384 | 48.225737% |
| D | 7017 | 711 | 10.132535% |
Noise dominated data is calculated using 1-second bins in cleaned event files. If a bin has >2000 counts, and if more than 50% of those come from <1% of pixels, then it is considered to be noise-dominated and hence unusable.
| Quadrant | # 1 sec bins | Bins with >0 counts | Bins with >2000 counts | High rate bins dominated by noise | Noise dominated (total time) | Noise dominated (detector-on time) | Marked lightcurve |
|---|---|---|---|---|---|---|---|
| A | 7016 | 7016 | 4695 | 4695 | 66.92% | 66.92% |  |
| B | 7017 | 7017 | 22 | 22 | 0.31% | 0.31% |  |
| C | 7017 | 7017 | 2256 | 2256 | 32.15% | 32.15% | 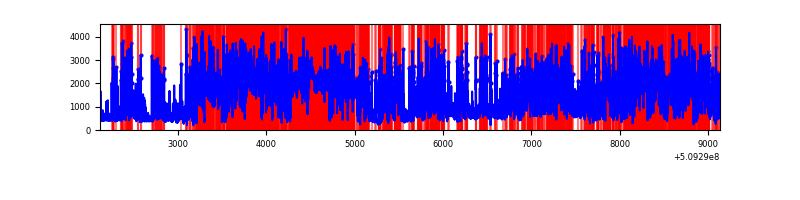 |
| D | 7017 | 7017 | 654 | 654 | 9.32% | 9.32% | 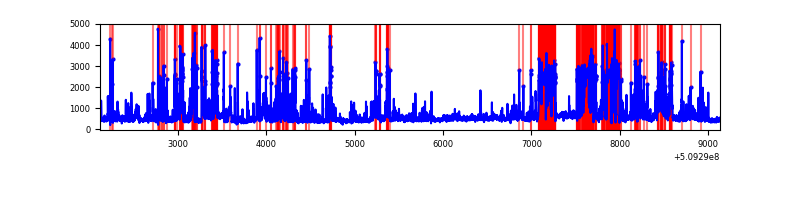 |
Top three noisy pixels from each quadrant. If the there are fewer than three noisy pixels in the level2.evt file, extra rows are filled as -1
| Pixel properties | Quadrant properties | ||||||
|---|---|---|---|---|---|---|---|
| Quadrant | DetID | PixID | Counts | Sigma | Mean | Median | Sigma |
| A | 14 | 235 | 4251159 | 37874.3 | 445 | 435 | 112.2 |
| A | 8 | 176 | 4182973 | 37266.76 | 445 | 435 | 112.2 |
| A | 12 | 115 | 2127456 | 18951.93 | 445 | 435 | 112.2 |
| B | 5 | 185 | 174624 | 1095.0 | 744 | 717 | 158.8 |
| B | 7 | 0 | 173761 | 1089.57 | 744 | 717 | 158.8 |
| B | 0 | 171 | 141609 | 887.12 | 744 | 717 | 158.8 |
| C | 15 | 230 | 6289934 | 42634.62 | 544 | 539 | 147.5 |
| C | 12 | 254 | 1021387 | 6920.14 | 544 | 539 | 147.5 |
| C | 13 | 3 | 780492 | 5287.15 | 544 | 539 | 147.5 |
| D | 8 | 129 | 928707 | 4786.81 | 681 | 649 | 193.9 |
| D | 2 | 249 | 830765 | 4281.64 | 681 | 649 | 193.9 |
| D | 2 | 120 | 614875 | 3168.1 | 681 | 649 | 193.9 |
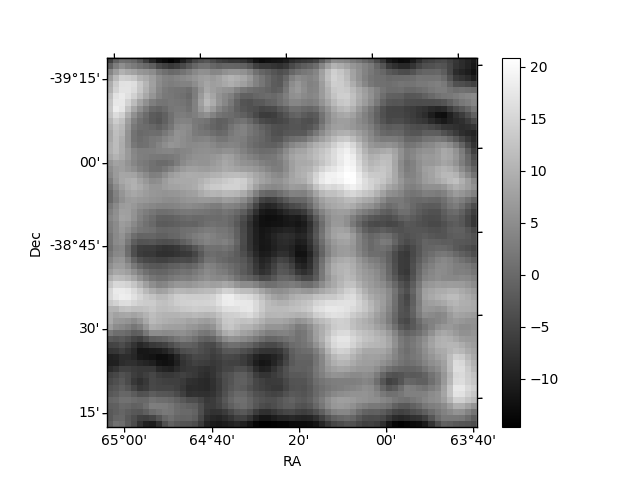
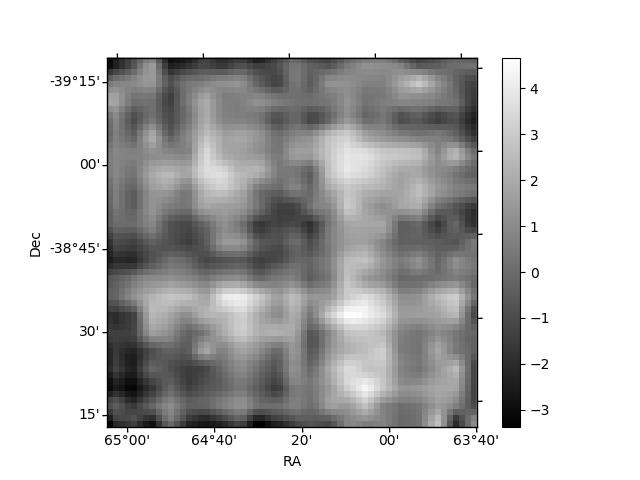
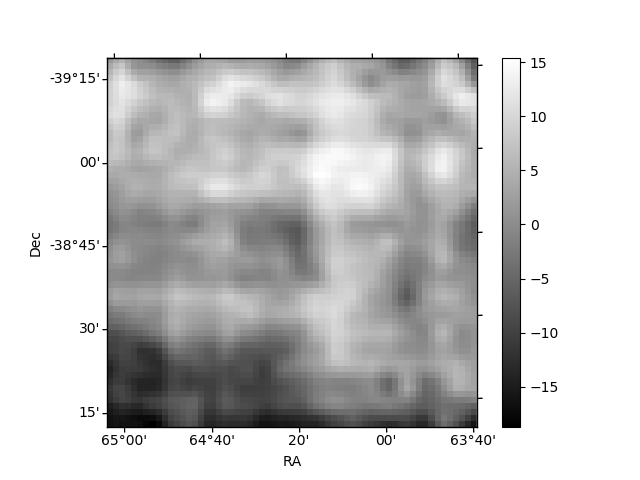
Histogram calculated using DETX and DETY for each event in the final _common_clean file
| Quadrant A |  |
 |
Quadrant B |
|---|---|---|---|
| Quadrant D | 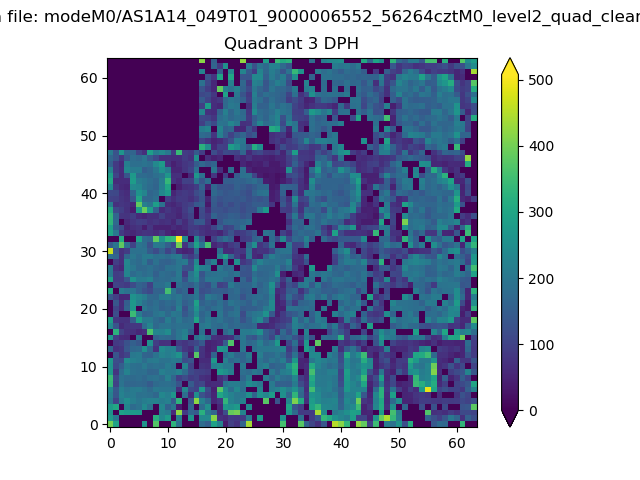 |
 |
Quadrant C |
| Plot type | Count rate plots | Images |
|---|---|---|
| Comparison with Poisson distribution Blue bars denote a histogram of data divided into 1 sec bins. Red curve is a Poisson curve with rate = median count rate of data. |
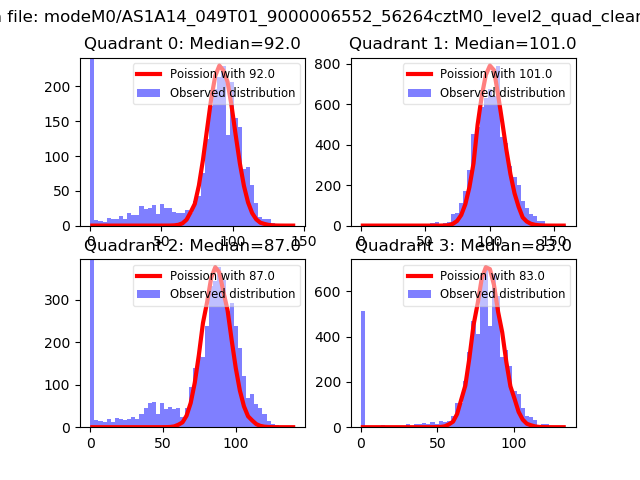 |
 |
| Quadrant-wise count rates Data is divided into 100 sec bins |
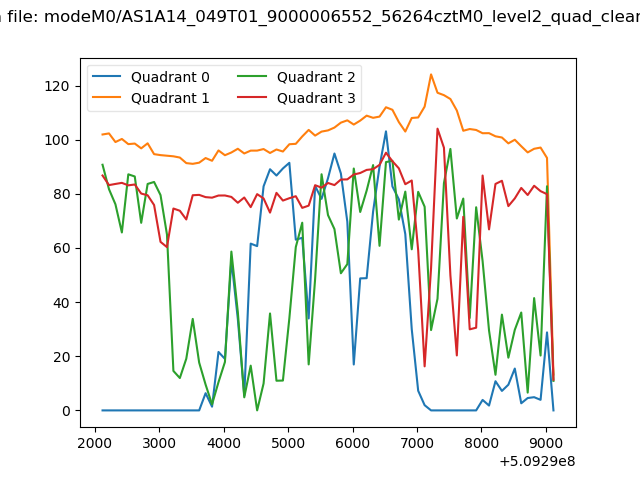 |
|
| Module-wise count rates for Quadrant A Data is divided into 100 sec bins |
 |
 |
| Module-wise count rates for Quadrant B Data is divided into 100 sec bins |
 |
 |
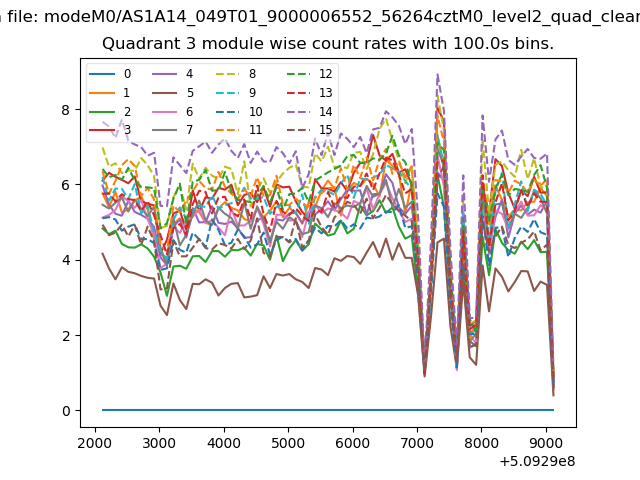
| Module-wise count rates for Quadrant C Data is divided into 100 sec bins |
 |
 |
| Module-wise count rates for Quadrant D Data is divided into 100 sec bins |
 |
 |
| Parameter | Plot |
|---|---|
| CZT HV Monitor | 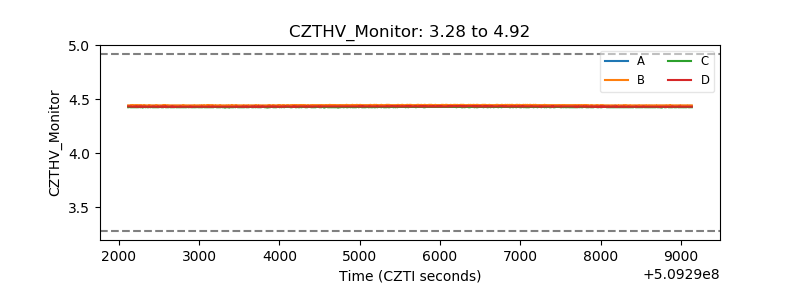 |
| D_VDD |  |
| Temperature 1 | 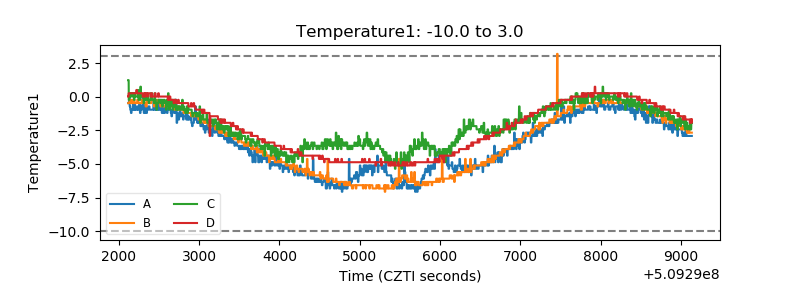 |
| Veto HV Monitor | 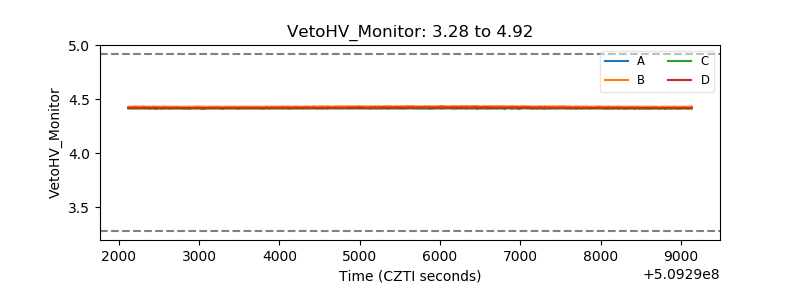 |
| Veto LLD | 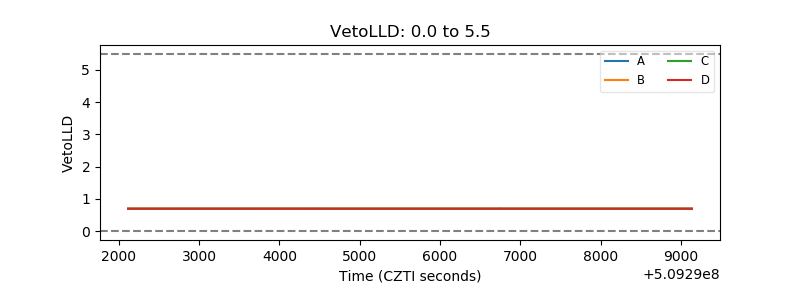 |
| Alpha Counter | 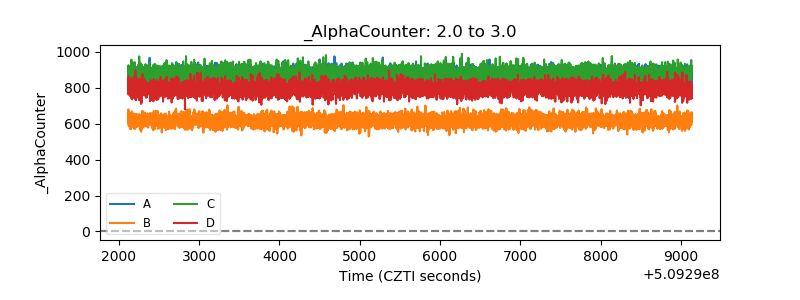 |
| _CPM_Rate | 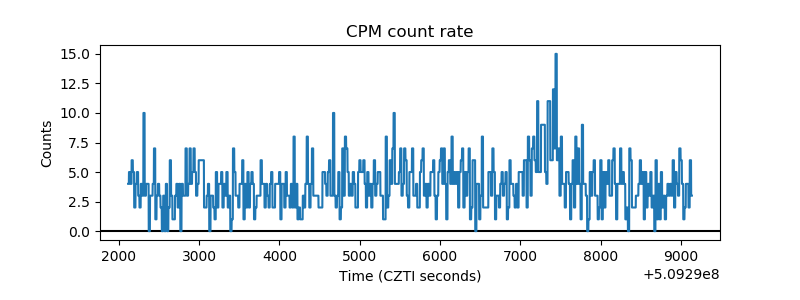 |
| CZT Counter |  |
| +2.5 Volts monitor |  |
| +5 Volts monitor | 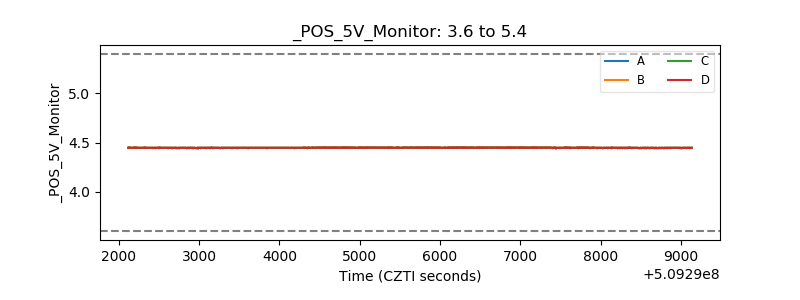 |
| _ROLL_ROT | 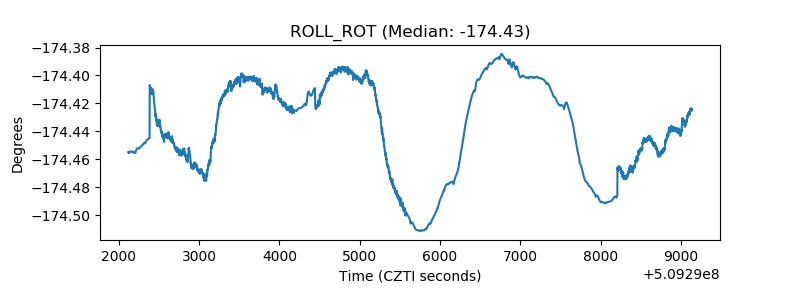 |
| _Roll_DEC | 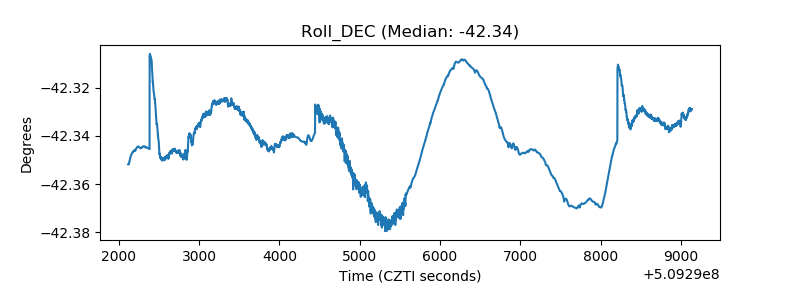 |
| _Roll_RA |  |
| Veto Counter |  |