| Param | Original file | Final file |
|---|---|---|
| Filename | modeM0/AS1A14_049T01_9000006552_56265cztM0_level2.fits | modeM0/AS1A14_049T01_9000006552_56265cztM0_level2_quad_clean.evt |
| Size (bytes) | 936,492,480 | 80,807,040 |
| Size | 893.1 MB | 77.1 MB |
| Events in quadrant A | 13,922,767 | 276,866 |
| Events in quadrant B | 4,172,639 | 704,850 |
| Events in quadrant C | 10,823,597 | 395,785 |
| Events in quadrant D | 5,193,469 | 570,327 |
| Mode SS | |||
|---|---|---|---|
| Quadrant | BADHDUFLAG | Total packets | Discarded packets |
| A | 0 | 144 | 0 |
| B | 0 | 144 | 0 |
| C | 0 | 144 | 0 |
| D | 0 | 144 | 0 |
| Mode M0 | |||
|---|---|---|---|
| Quadrant | BADHDUFLAG | Total packets | Discarded packets |
| A | 0 | 46392 | 6 |
| B | 0 | 17373 | 0 |
| C | 0 | 37125 | 0 |
| D | 0 | 20498 | 0 |
| Quadrant | Total seconds | Saturated seconds | Saturation percentage |
|---|---|---|---|
| A | 7152 | 4402 | 61.549217% |
| B | 7152 | 186 | 2.600671% |
| C | 7153 | 3057 | 42.737313% |
| D | 7153 | 453 | 6.333007% |
Noise dominated data is calculated using 1-second bins in cleaned event files. If a bin has >2000 counts, and if more than 50% of those come from <1% of pixels, then it is considered to be noise-dominated and hence unusable.
| Quadrant | # 1 sec bins | Bins with >0 counts | Bins with >2000 counts | High rate bins dominated by noise | Noise dominated (total time) | Noise dominated (detector-on time) | Marked lightcurve |
|---|---|---|---|---|---|---|---|
| A | 7152 | 7152 | 4001 | 4001 | 55.94% | 55.94% |  |
| B | 7152 | 7152 | 122 | 122 | 1.71% | 1.71% |  |
| C | 7153 | 7153 | 2290 | 2290 | 32.01% | 32.01% | 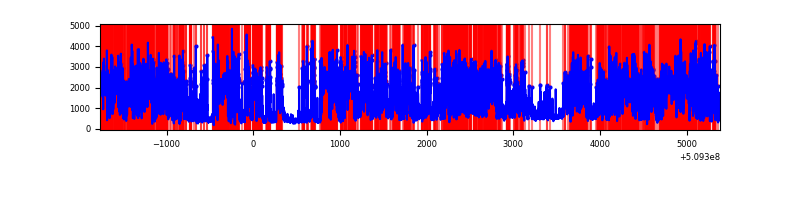 |
| D | 7153 | 7153 | 418 | 418 | 5.84% | 5.84% |  |
Top three noisy pixels from each quadrant. If the there are fewer than three noisy pixels in the level2.evt file, extra rows are filled as -1
| Pixel properties | Quadrant properties | ||||||
|---|---|---|---|---|---|---|---|
| Quadrant | DetID | PixID | Counts | Sigma | Mean | Median | Sigma |
| A | 8 | 176 | 4820501 | 37598.5 | 511 | 500 | 128.2 |
| A | 14 | 235 | 4299391 | 33533.57 | 511 | 500 | 128.2 |
| A | 15 | 32 | 997003 | 7773.24 | 511 | 500 | 128.2 |
| B | 4 | 171 | 219074 | 1387.92 | 742 | 718 | 157.3 |
| B | 5 | 185 | 211681 | 1340.93 | 742 | 718 | 157.3 |
| B | 0 | 171 | 199053 | 1260.66 | 742 | 718 | 157.3 |
| C | 15 | 230 | 4254496 | 26971.78 | 576 | 573 | 157.7 |
| C | 12 | 254 | 2882570 | 18273.15 | 576 | 573 | 157.7 |
| C | 5 | 250 | 405450 | 2567.1 | 576 | 573 | 157.7 |
| D | 8 | 129 | 1016432 | 4989.66 | 710 | 678 | 203.6 |
| D | 2 | 249 | 468535 | 2298.24 | 710 | 678 | 203.6 |
| D | 2 | 31 | 338713 | 1660.52 | 710 | 678 | 203.6 |
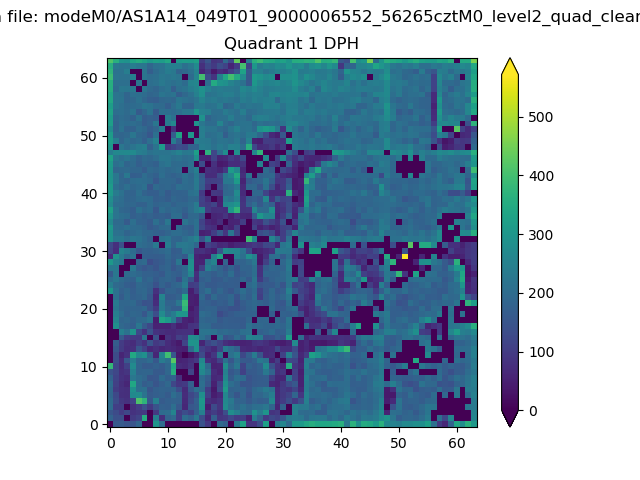
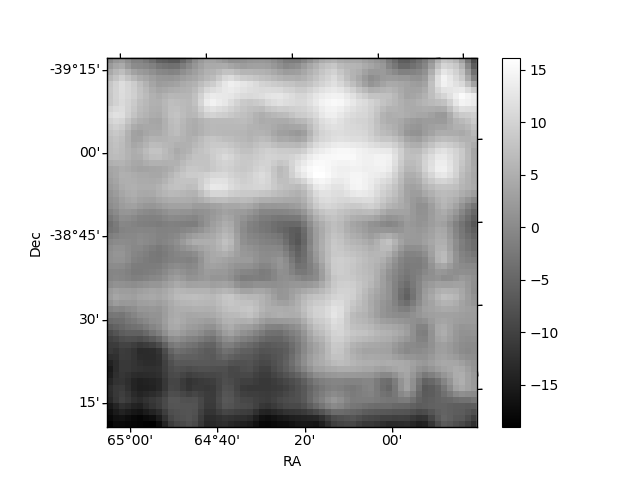
Histogram calculated using DETX and DETY for each event in the final _common_clean file
| Quadrant A |  |
 |
Quadrant B |
|---|---|---|---|
| Quadrant D |  |
 |
Quadrant C |
| Plot type | Count rate plots | Images |
|---|---|---|
| Comparison with Poisson distribution Blue bars denote a histogram of data divided into 1 sec bins. Red curve is a Poisson curve with rate = median count rate of data. |
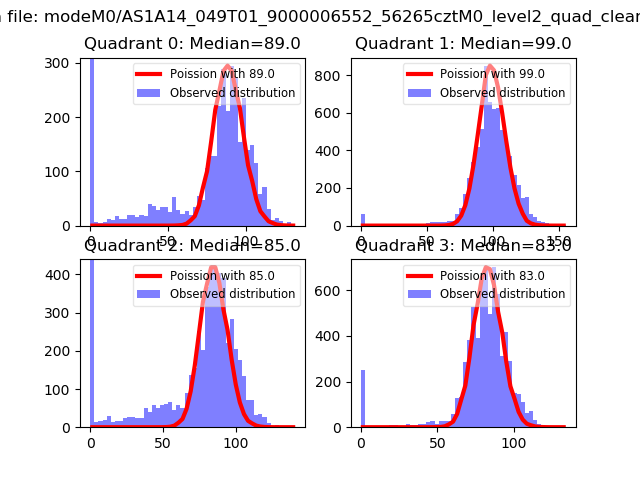 |
 |
| Quadrant-wise count rates Data is divided into 100 sec bins |
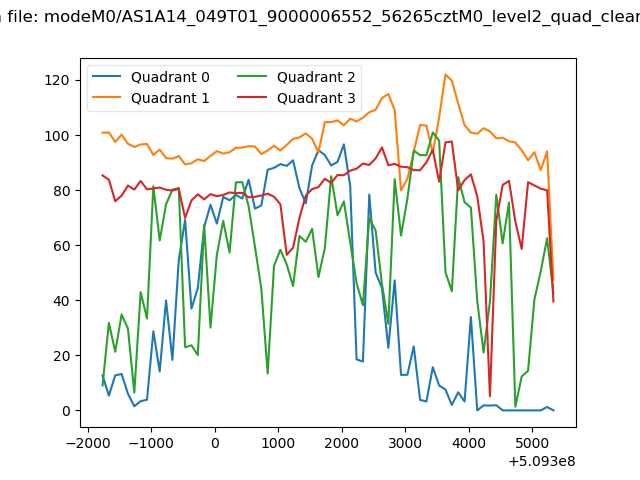 |
|
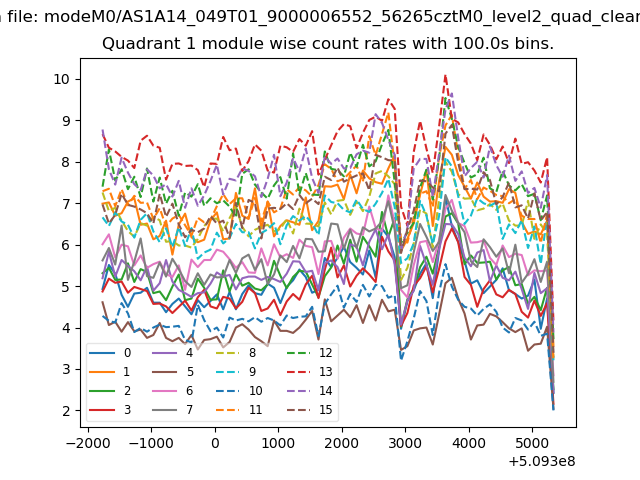
| Module-wise count rates for Quadrant A Data is divided into 100 sec bins |
 |
 |
| Module-wise count rates for Quadrant B Data is divided into 100 sec bins |
 |
 |
| Module-wise count rates for Quadrant C Data is divided into 100 sec bins |
 |
 |
| Module-wise count rates for Quadrant D Data is divided into 100 sec bins |
 |
 |
| Parameter | Plot |
|---|---|
| CZT HV Monitor | 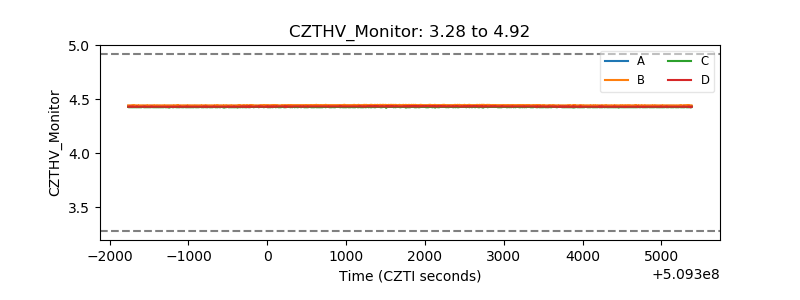 |
| D_VDD |  |
| Temperature 1 |  |
| Veto HV Monitor | 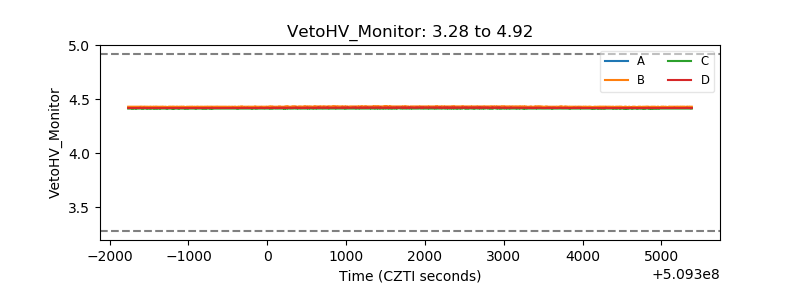 |
| Veto LLD | 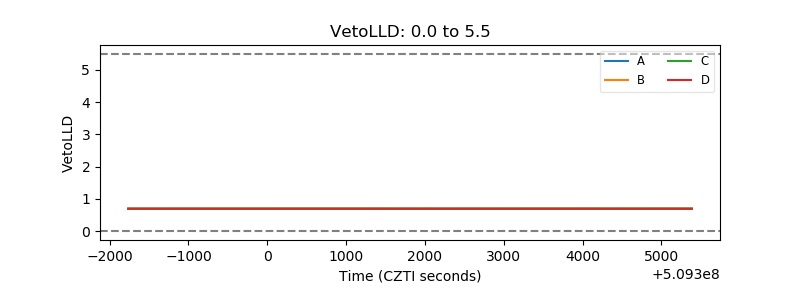 |
| Alpha Counter |  |
| _CPM_Rate | 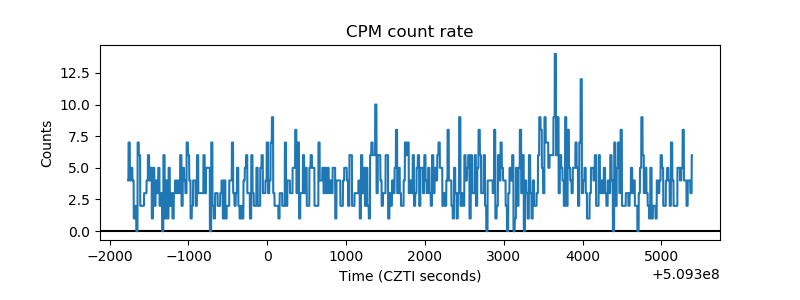 |
| CZT Counter |  |
| +2.5 Volts monitor |  |
| +5 Volts monitor | 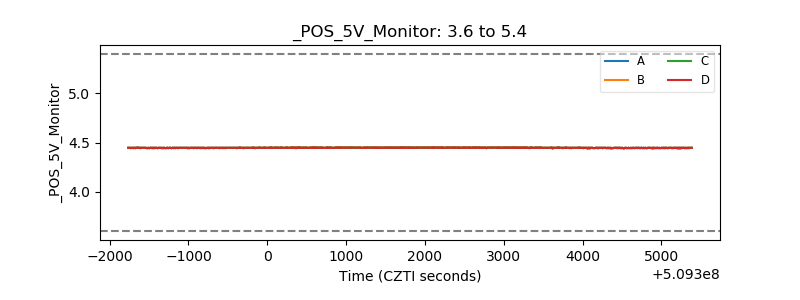 |
| _ROLL_ROT | 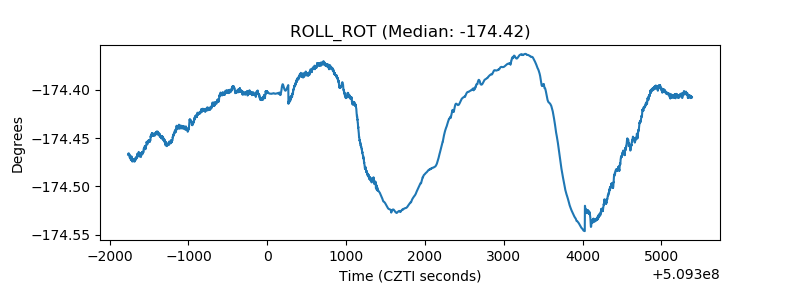 |
| _Roll_DEC | 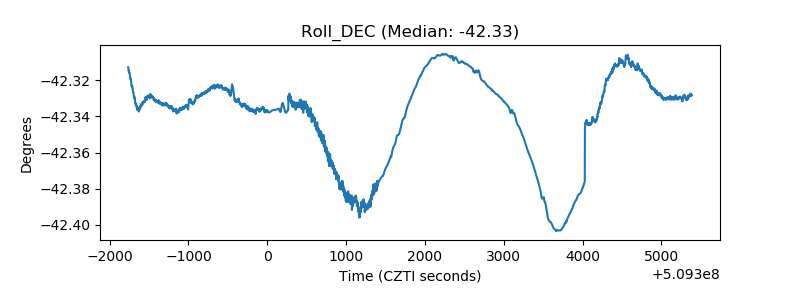 |
| _Roll_RA |  |
| Veto Counter | 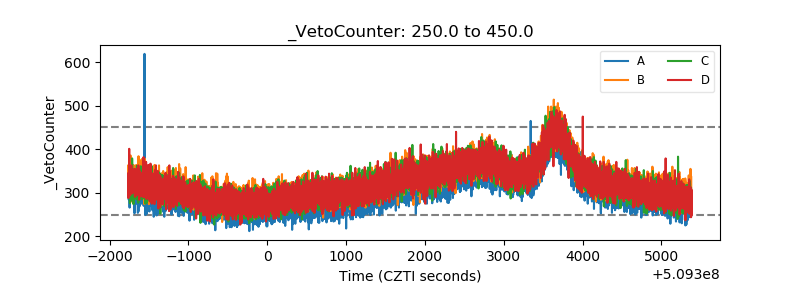 |