| Param | Original file | Final file |
|---|---|---|
| Filename | modeM0/AS1A14_049T01_9000006552_56268cztM0_level2.fits | modeM0/AS1A14_049T01_9000006552_56268cztM0_level2_quad_clean.evt |
| Size (bytes) | 1,233,023,040 | 109,215,360 |
| Size | 1.1 GB | 104.2 MB |
| Events in quadrant A | 17,726,461 | 522,733 |
| Events in quadrant B | 6,259,740 | 827,759 |
| Events in quadrant C | 13,250,749 | 540,197 |
| Events in quadrant D | 7,572,999 | 669,190 |
| Mode SS | |||
|---|---|---|---|
| Quadrant | BADHDUFLAG | Total packets | Discarded packets |
| A | 0 | 214 | 0 |
| B | 0 | 214 | 0 |
| C | 0 | 214 | 0 |
| D | 0 | 214 | 0 |
| Mode M0 | |||
|---|---|---|---|
| Quadrant | BADHDUFLAG | Total packets | Discarded packets |
| A | 0 | 60305 | 6 |
| B | 0 | 26112 | 0 |
| C | 0 | 46855 | 0 |
| D | 0 | 30267 | 0 |
| Quadrant | Total seconds | Saturated seconds | Saturation percentage |
|---|---|---|---|
| A | 10776 | 4784 | 44.394952% |
| B | 10776 | 329 | 3.053081% |
| C | 10777 | 3116 | 28.913427% |
| D | 10777 | 537 | 4.982834% |
Noise dominated data is calculated using 1-second bins in cleaned event files. If a bin has >2000 counts, and if more than 50% of those come from <1% of pixels, then it is considered to be noise-dominated and hence unusable.
| Quadrant | # 1 sec bins | Bins with >0 counts | Bins with >2000 counts | High rate bins dominated by noise | Noise dominated (total time) | Noise dominated (detector-on time) | Marked lightcurve |
|---|---|---|---|---|---|---|---|
| A | 11065 | 11055 | 4116 | 4116 | 37.20% | 37.23% |  |
| B | 11066 | 11061 | 149 | 149 | 1.35% | 1.35% |  |
| C | 11066 | 11013 | 2421 | 2421 | 21.88% | 21.98% | 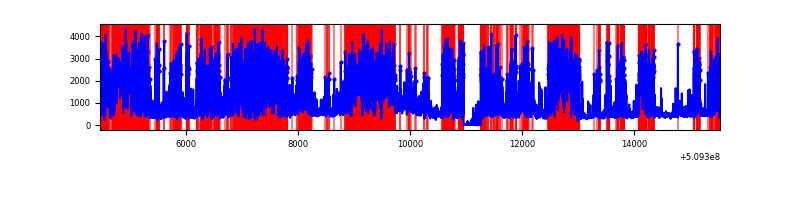 |
| D | 11067 | 11063 | 485 | 485 | 4.38% | 4.38% | 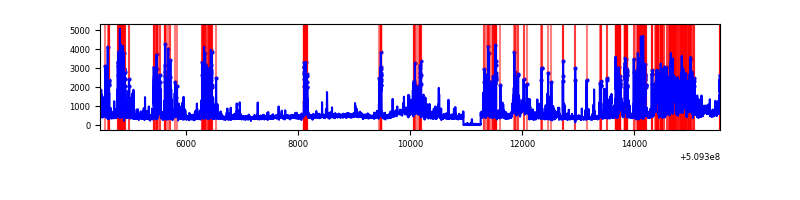 |
Top three noisy pixels from each quadrant. If the there are fewer than three noisy pixels in the level2.evt file, extra rows are filled as -1
| Pixel properties | Quadrant properties | ||||||
|---|---|---|---|---|---|---|---|
| Quadrant | DetID | PixID | Counts | Sigma | Mean | Median | Sigma |
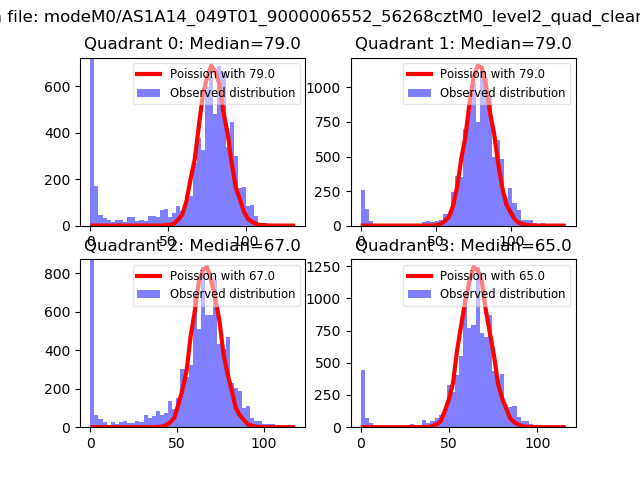
| A | 15 | 32 | 6020461 | 27116.31 | 893 | 875 | 222.0 |
| A | 8 | 176 | 4710109 | 21213.6 | 893 | 875 | 222.0 |
| A | 14 | 235 | 1057863 | 4761.39 | 893 | 875 | 222.0 |
| B | 5 | 185 | 371489 | 1541.56 | 1124 | 1083 | 240.3 |
| B | 0 | 171 | 344165 | 1427.84 | 1124 | 1083 | 240.3 |
| B | 4 | 171 | 265592 | 1100.84 | 1124 | 1083 | 240.3 |
| C | 15 | 230 | 5712870 | 22116.94 | 939 | 931 | 258.3 |
| C | 12 | 254 | 3219774 | 12463.54 | 939 | 931 | 258.3 |
| C | 12 | 252 | 249889 | 963.98 | 939 | 931 | 258.3 |
| D | 2 | 249 | 2099849 | 6764.93 | 1081 | 1030 | 310.2 |
| D | 8 | 129 | 574422 | 1848.16 | 1081 | 1030 | 310.2 |
| D | 11 | 129 | 190542 | 610.84 | 1081 | 1030 | 310.2 |
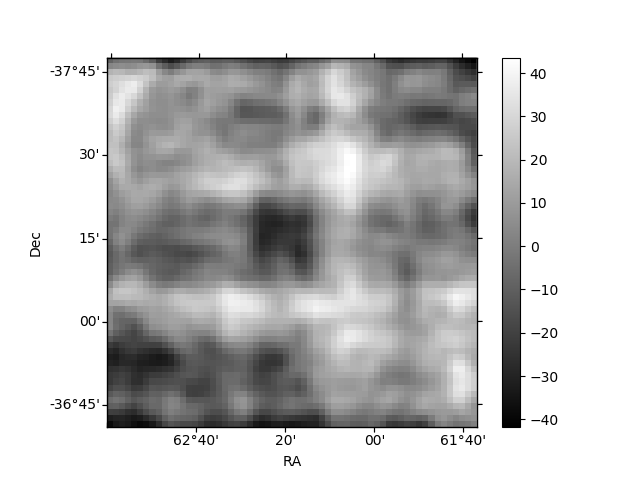
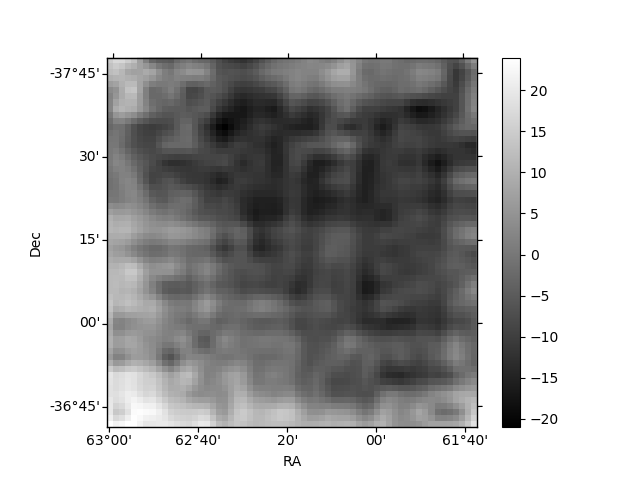
Histogram calculated using DETX and DETY for each event in the final _common_clean file
| Quadrant A | 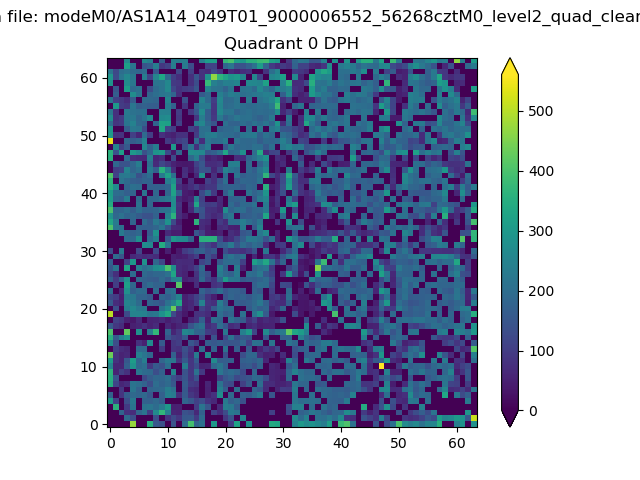 |
 |
Quadrant B |
|---|---|---|---|
| Quadrant D | 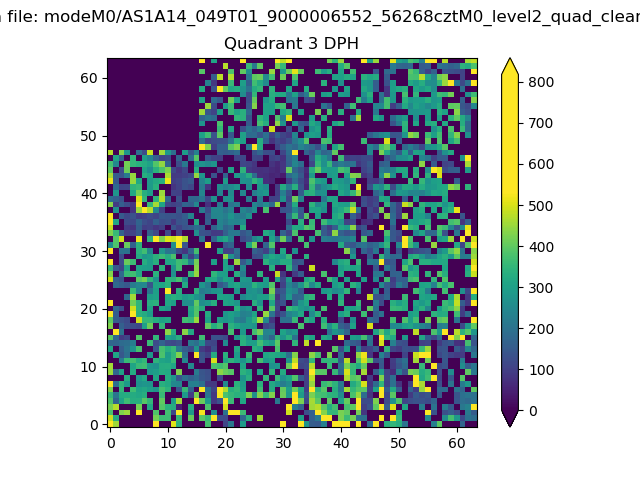 |
 |
Quadrant C |
| Plot type | Count rate plots | Images |
|---|---|---|
| Comparison with Poisson distribution Blue bars denote a histogram of data divided into 1 sec bins. Red curve is a Poisson curve with rate = median count rate of data. |
 |
 |
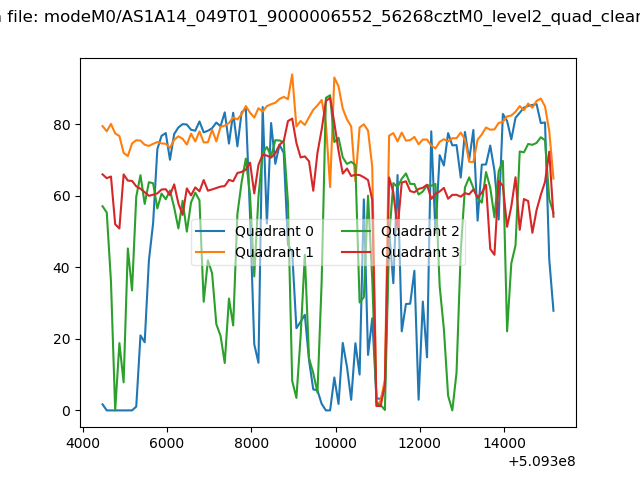
| Quadrant-wise count rates Data is divided into 100 sec bins |
 |
|
| Module-wise count rates for Quadrant A Data is divided into 100 sec bins |
 |
 |
| Module-wise count rates for Quadrant B Data is divided into 100 sec bins |
 |
 |
| Module-wise count rates for Quadrant C Data is divided into 100 sec bins |
 |
 |
| Module-wise count rates for Quadrant D Data is divided into 100 sec bins |
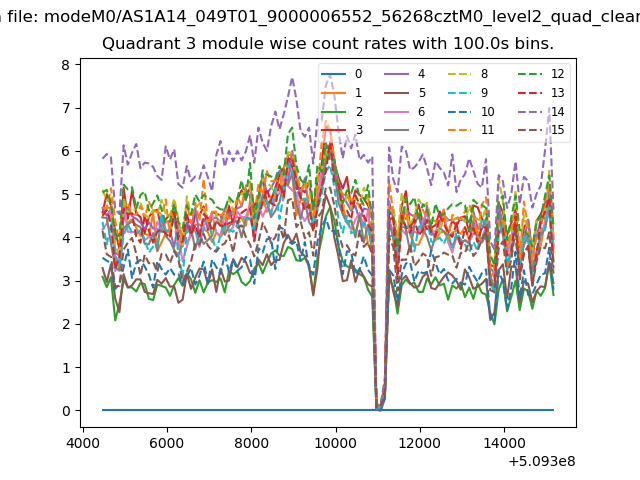 |
 |
| Parameter | Plot |
|---|---|
| CZT HV Monitor | 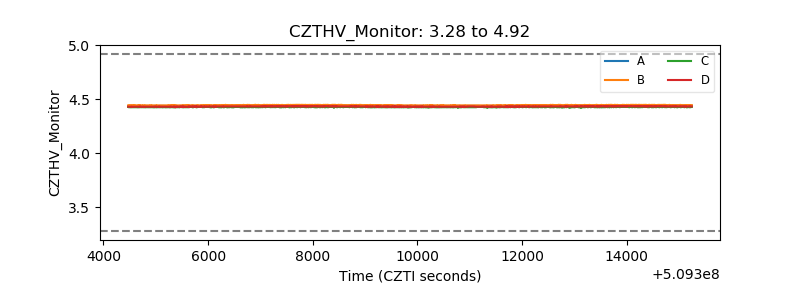 |
| D_VDD |  |
| Temperature 1 | 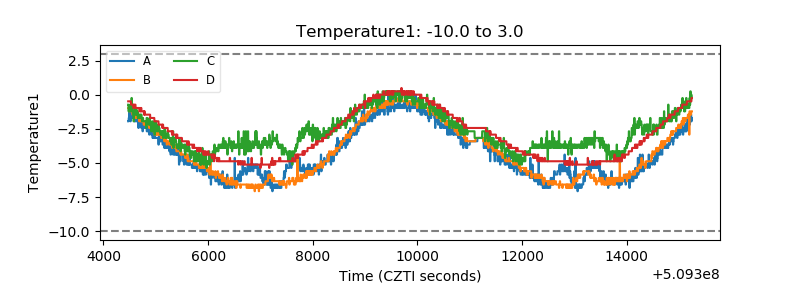 |
| Veto HV Monitor | 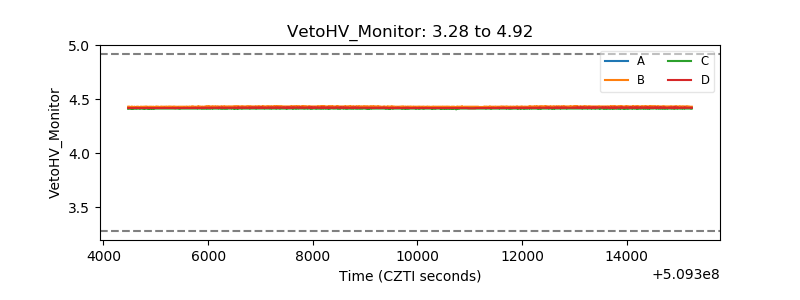 |
| Veto LLD | 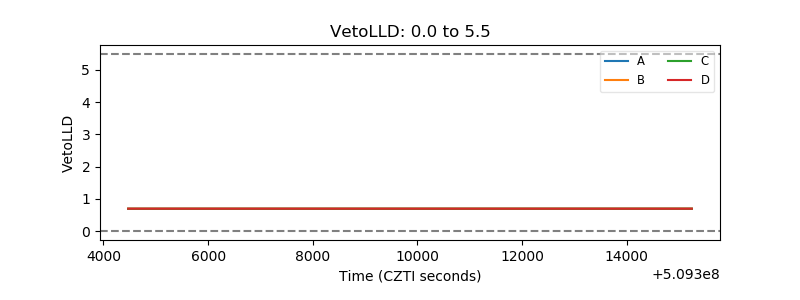 |
| Alpha Counter | 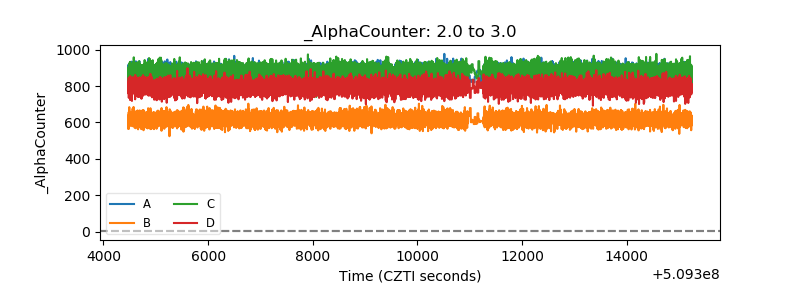 |
| _CPM_Rate | 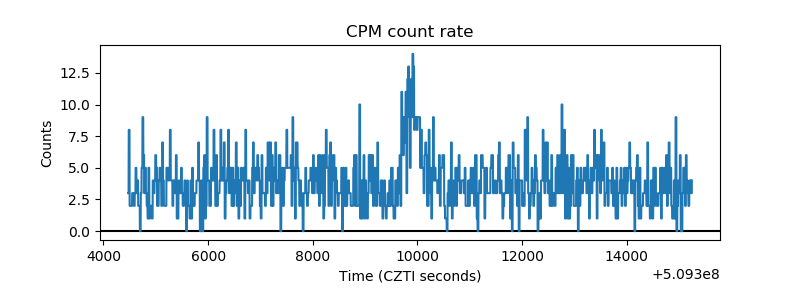 |
| CZT Counter |  |
| +2.5 Volts monitor |  |
| +5 Volts monitor | 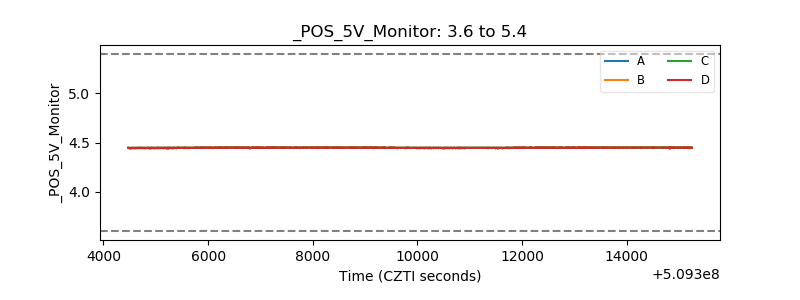 |
| _ROLL_ROT | 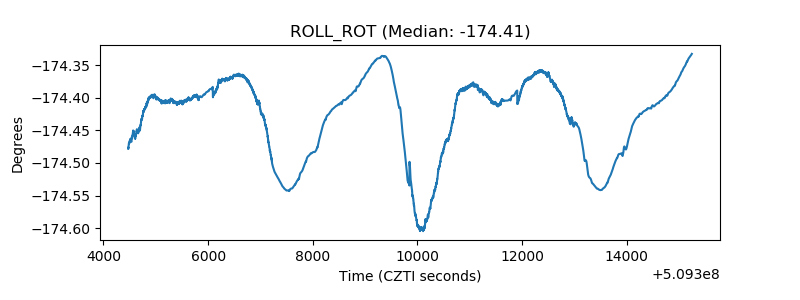 |
| _Roll_DEC | 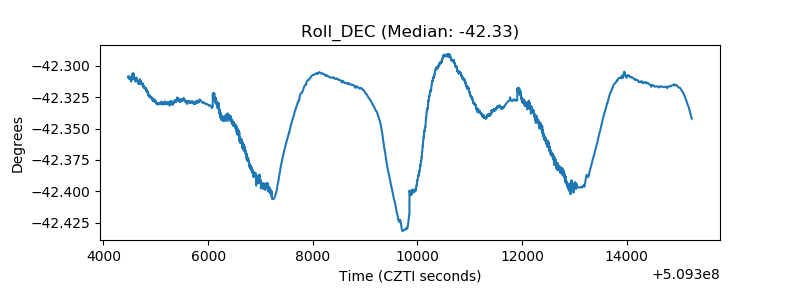 |
| _Roll_RA |  |
| Veto Counter |  |