| Param | Original file | Final file |
|---|---|---|
| Filename | modeM0/AS1A14_049T01_9000006552_56269cztM0_level2.fits | modeM0/AS1A14_049T01_9000006552_56269cztM0_level2_quad_clean.evt |
| Size (bytes) | 1,763,265,600 | 156,686,400 |
| Size | 1.6 GB | 149.4 MB |
| Events in quadrant A | 25,845,976 | 657,185 |
| Events in quadrant B | 8,431,390 | 1,311,073 |
| Events in quadrant C | 16,615,082 | 867,228 |
| Events in quadrant D | 13,331,846 | 969,023 |
| Mode SS | |||
|---|---|---|---|
| Quadrant | BADHDUFLAG | Total packets | Discarded packets |
| A | 0 | 278 | 0 |
| B | 0 | 278 | 0 |
| C | 0 | 278 | 0 |
| D | 0 | 278 | 0 |
| Mode M9 | |||
|---|---|---|---|
| Quadrant | BADHDUFLAG | Total packets | Discarded packets |
| A | 0 | 17 | 0 |
| B | 0 | 17 | 0 |
| C | 0 | 17 | 0 |
| D | 0 | 17 | 0 |
| Mode M0 | |||
|---|---|---|---|
| Quadrant | BADHDUFLAG | Total packets | Discarded packets |
| A | 0 | 86185 | 3 |
| B | 0 | 34464 | 3 |
| C | 0 | 58803 | 3 |
| D | 0 | 49347 | 3 |
| Quadrant | Total seconds | Saturated seconds | Saturation percentage |
|---|---|---|---|
| A | 13582 | 6993 | 51.487263% |
| B | 13583 | 587 | 4.321578% |
| C | 13583 | 3857 | 28.395789% |
| D | 13583 | 1944 | 14.312008% |
Noise dominated data is calculated using 1-second bins in cleaned event files. If a bin has >2000 counts, and if more than 50% of those come from <1% of pixels, then it is considered to be noise-dominated and hence unusable.
| Quadrant | # 1 sec bins | Bins with >0 counts | Bins with >2000 counts | High rate bins dominated by noise | Noise dominated (total time) | Noise dominated (detector-on time) | Marked lightcurve |
|---|---|---|---|---|---|---|---|
| A | 15302 | 13582 | 6513 | 6513 | 42.56% | 47.95% |  |
| B | 15303 | 13586 | 340 | 340 | 2.22% | 2.50% |  |
| C | 15303 | 13584 | 3187 | 3187 | 20.83% | 23.46% | 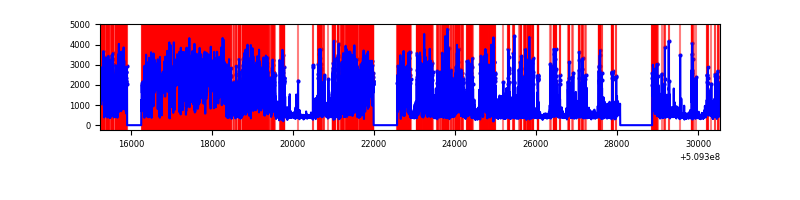 |
| D | 15303 | 13586 | 1771 | 1771 | 11.57% | 13.04% |  |
Top three noisy pixels from each quadrant. If the there are fewer than three noisy pixels in the level2.evt file, extra rows are filled as -1
| Pixel properties | Quadrant properties | ||||||
|---|---|---|---|---|---|---|---|
| Quadrant | DetID | PixID | Counts | Sigma | Mean | Median | Sigma |
| A | 15 | 32 | 9589485 | 34789.69 | 1108 | 1083 | 275.6 |
| A | 8 | 176 | 6980969 | 25325.19 | 1108 | 1083 | 275.6 |
| A | 4 | 95 | 2552713 | 9258.1 | 1108 | 1083 | 275.6 |
| B | 0 | 231 | 774036 | 2554.39 | 1416 | 1363 | 302.5 |
| B | 5 | 185 | 501719 | 1654.13 | 1416 | 1363 | 302.5 |
| B | 4 | 171 | 337183 | 1110.19 | 1416 | 1363 | 302.5 |
| C | 15 | 230 | 8254258 | 25397.74 | 1185 | 1172 | 325.0 |
| C | 12 | 254 | 3228263 | 9930.93 | 1185 | 1172 | 325.0 |
| C | 5 | 250 | 175609 | 536.81 | 1185 | 1172 | 325.0 |
| D | 8 | 129 | 5769042 | 15321.39 | 1318 | 1254 | 376.5 |
| D | 2 | 249 | 987188 | 2619.01 | 1318 | 1254 | 376.5 |
| D | 2 | 120 | 377087 | 998.35 | 1318 | 1254 | 376.5 |
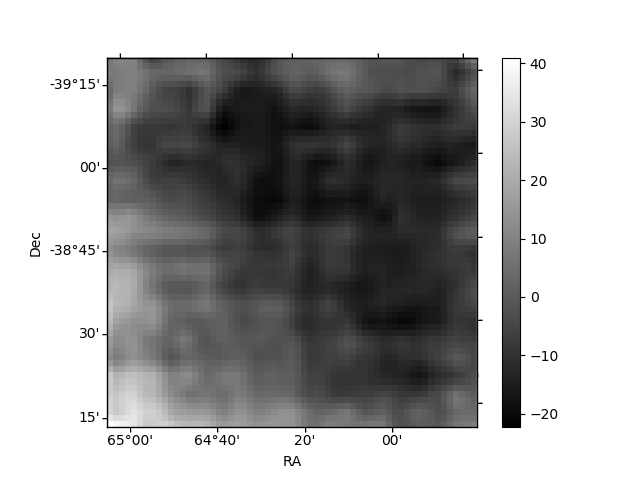
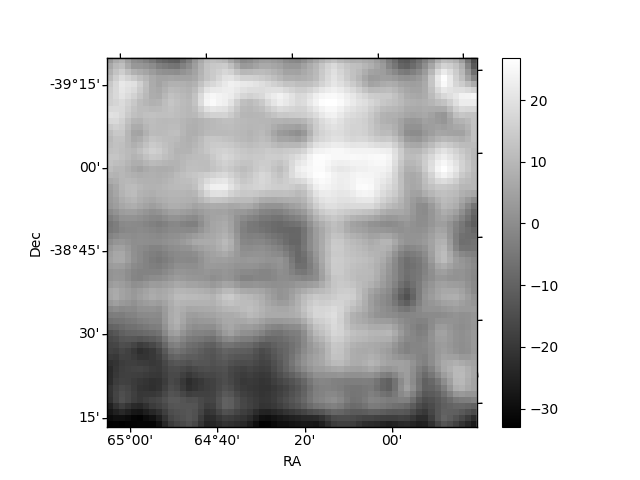
Histogram calculated using DETX and DETY for each event in the final _common_clean file
| Quadrant A | 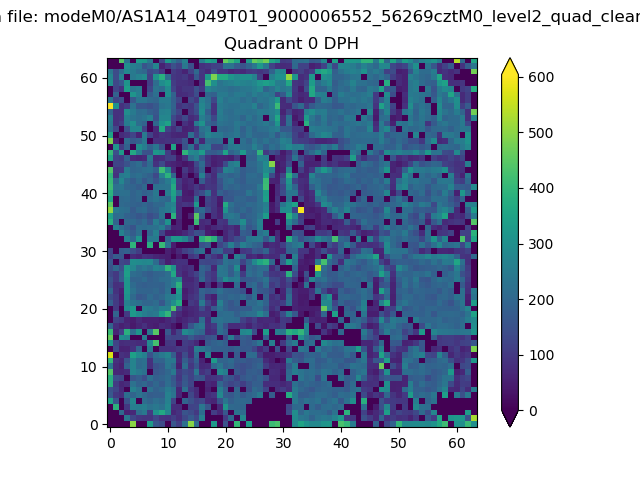 |
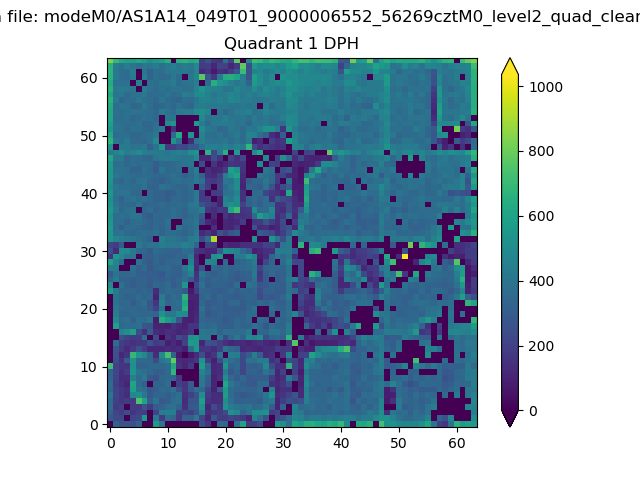 |
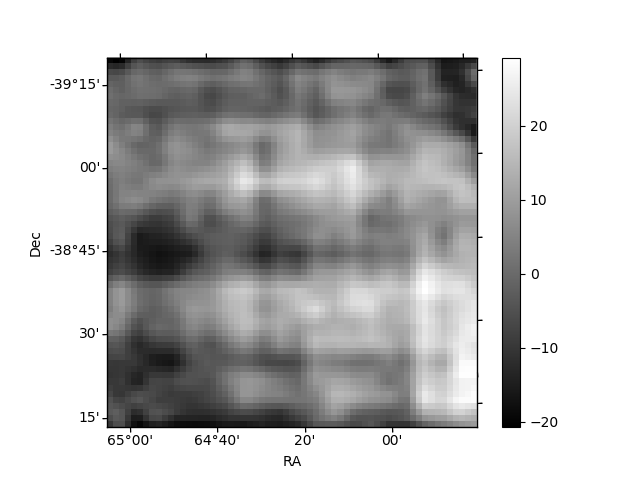
Quadrant B |
|---|---|---|---|
| Quadrant D | 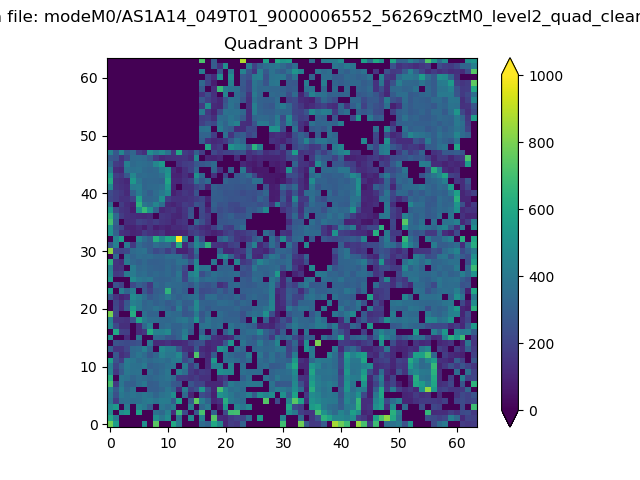 |
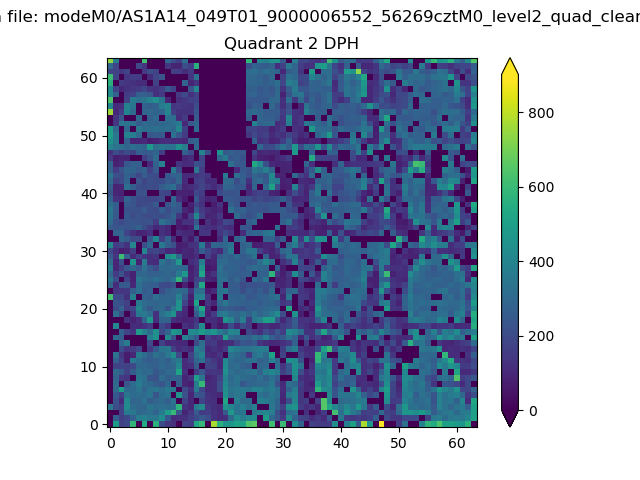 |
Quadrant C |
| Plot type | Count rate plots | Images |
|---|---|---|
| Comparison with Poisson distribution Blue bars denote a histogram of data divided into 1 sec bins. Red curve is a Poisson curve with rate = median count rate of data. |
 |
 |
| Quadrant-wise count rates Data is divided into 100 sec bins |
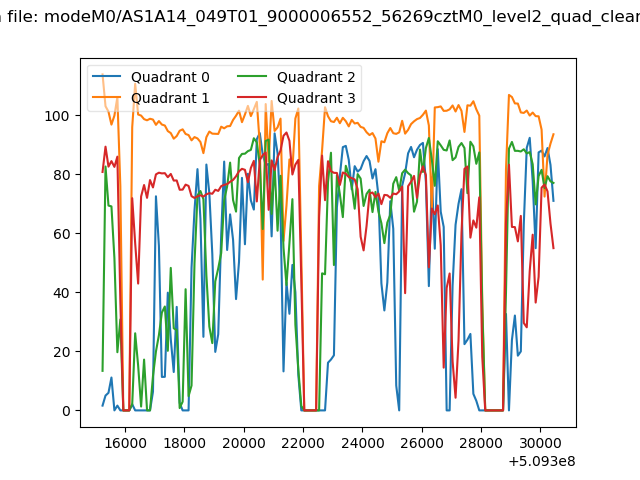 |
|
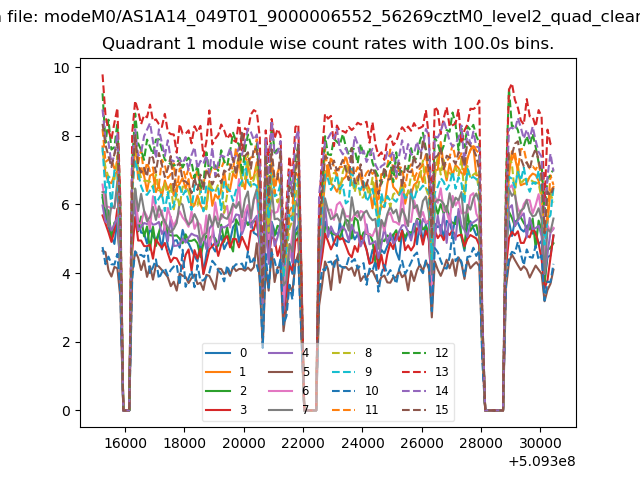
| Module-wise count rates for Quadrant A Data is divided into 100 sec bins |
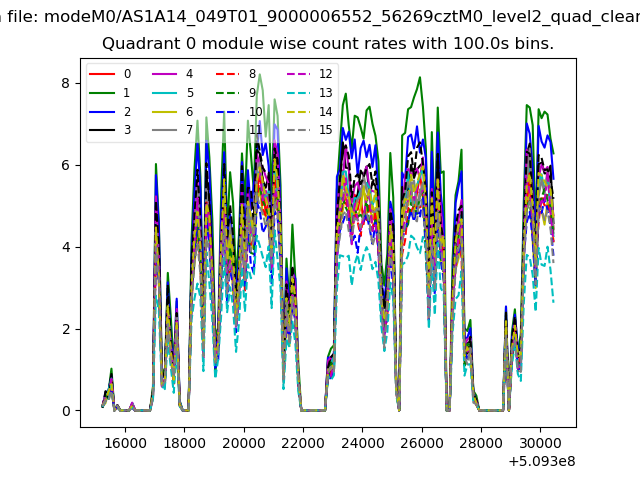 |
 |
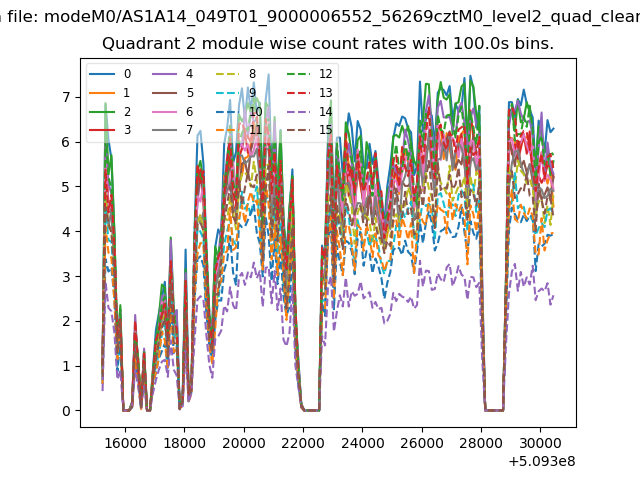
| Module-wise count rates for Quadrant B Data is divided into 100 sec bins |
 |
 |
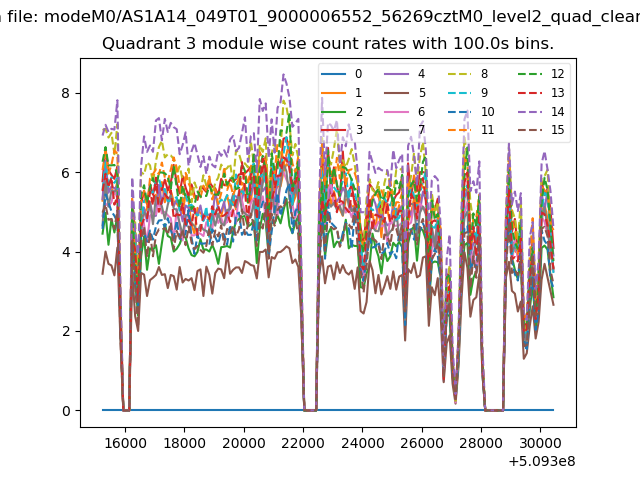
| Module-wise count rates for Quadrant C Data is divided into 100 sec bins |
 |
 |
| Module-wise count rates for Quadrant D Data is divided into 100 sec bins |
 |
 |
| Parameter | Plot |
|---|---|
| CZT HV Monitor | 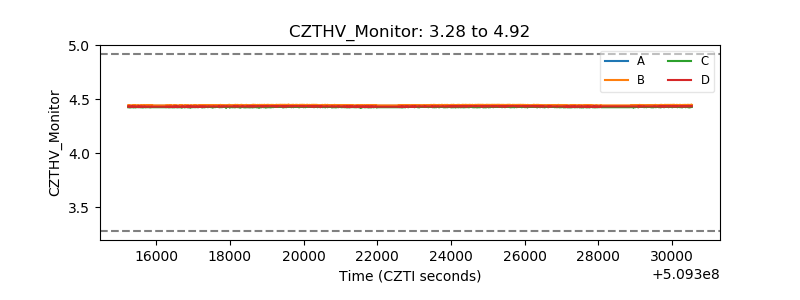 |
| D_VDD |  |
| Temperature 1 | 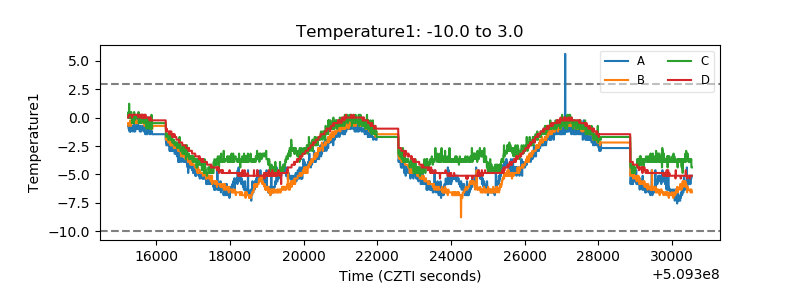 |
| Veto HV Monitor | 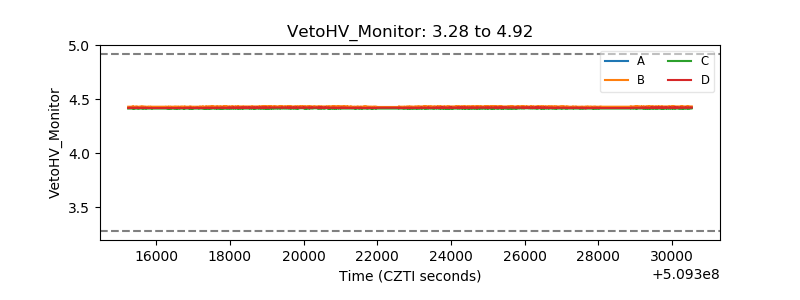 |
| Veto LLD |  |
| Alpha Counter |  |
| _CPM_Rate |  |
| CZT Counter | 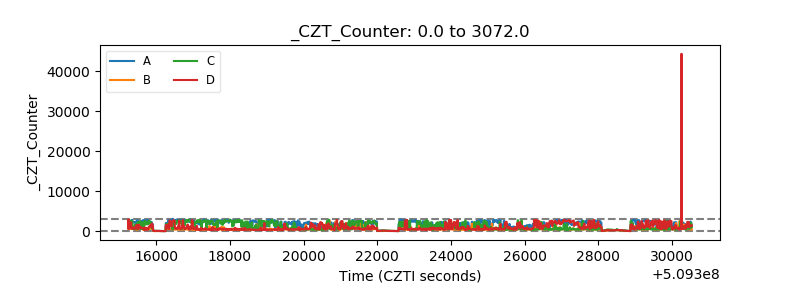 |
| +2.5 Volts monitor | 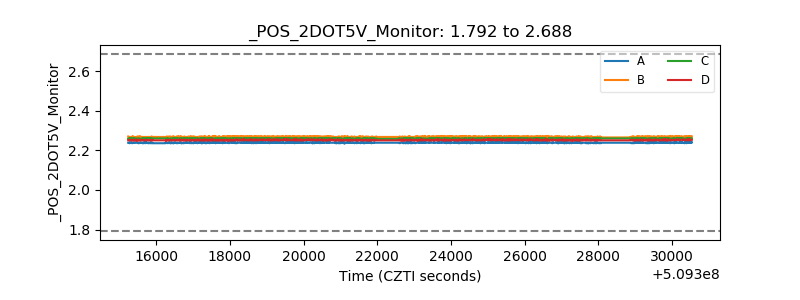 |
| +5 Volts monitor |  |
| _ROLL_ROT | 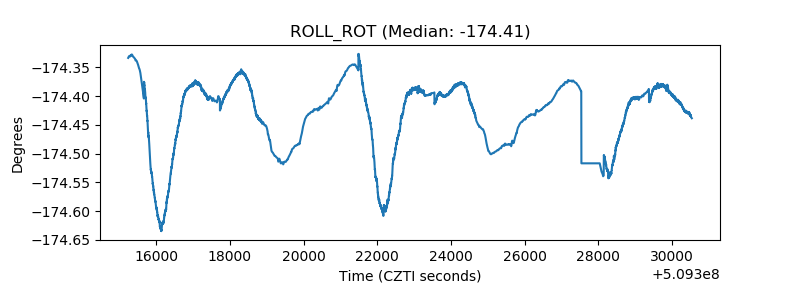 |
| _Roll_DEC | 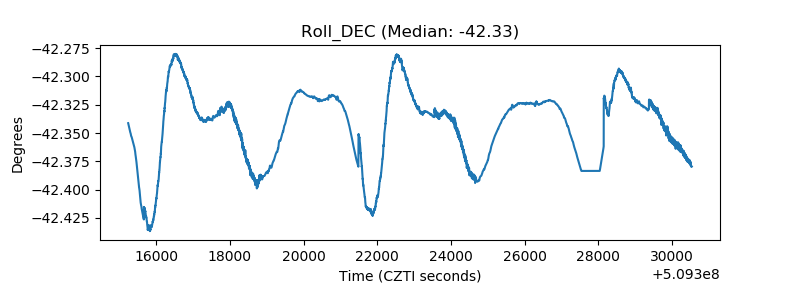 |
| _Roll_RA |  |
| Veto Counter | 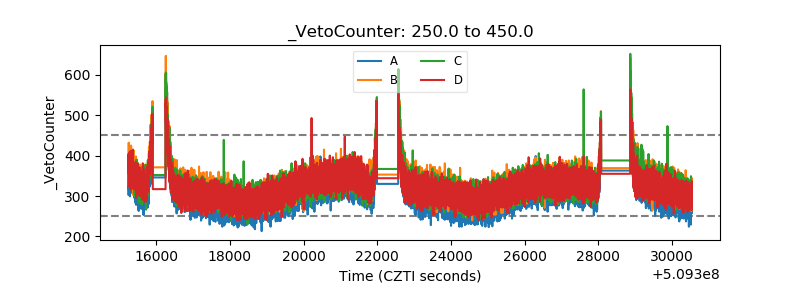 |