| Param | Original file | Final file |
|---|---|---|
| Filename | modeM0/AS1A14_049T01_9000006552_56273cztM0_level2.fits | modeM0/AS1A14_049T01_9000006552_56273cztM0_level2_quad_clean.evt |
| Size (bytes) | 829,264,320 | 79,202,880 |
| Size | 790.8 MB | 75.5 MB |
| Events in quadrant A | 15,759,690 | 90,254 |
| Events in quadrant B | 5,390,359 | 642,859 |
| Events in quadrant C | 3,977,350 | 623,066 |
| Events in quadrant D | 5,061,856 | 585,932 |
| Mode SS | |||
|---|---|---|---|
| Quadrant | BADHDUFLAG | Total packets | Discarded packets |
| A | 0 | 134 | 0 |
| B | 0 | 134 | 0 |
| C | 0 | 134 | 0 |
| D | 0 | 134 | 0 |
| Mode M9 | |||
|---|---|---|---|
| Quadrant | BADHDUFLAG | Total packets | Discarded packets |
| A | 0 | 23 | 0 |
| B | 0 | 23 | 0 |
| C | 0 | 23 | 0 |
| D | 0 | 23 | 0 |
| Mode M0 | |||
|---|---|---|---|
| Quadrant | BADHDUFLAG | Total packets | Discarded packets |
| A | 0 | 51276 | 2 |
| B | 0 | 20475 | 2 |
| C | 0 | 16351 | 2 |
| D | 0 | 19534 | 3 |
| Quadrant | Total seconds | Saturated seconds | Saturation percentage |
|---|---|---|---|
| A | 6540 | 5873 | 89.801223% |
| B | 6541 | 910 | 13.912246% |
| C | 6541 | 271 | 4.143097% |
| D | 6540 | 332 | 5.076453% |
Noise dominated data is calculated using 1-second bins in cleaned event files. If a bin has >2000 counts, and if more than 50% of those come from <1% of pixels, then it is considered to be noise-dominated and hence unusable.
| Quadrant | # 1 sec bins | Bins with >0 counts | Bins with >2000 counts | High rate bins dominated by noise | Noise dominated (total time) | Noise dominated (detector-on time) | Marked lightcurve |
|---|---|---|---|---|---|---|---|
| A | 8759 | 6539 | 5459 | 5459 | 62.32% | 83.48% |  |
| B | 8761 | 6543 | 526 | 526 | 6.00% | 8.04% |  |
| C | 8761 | 6542 | 165 | 165 | 1.88% | 2.52% | 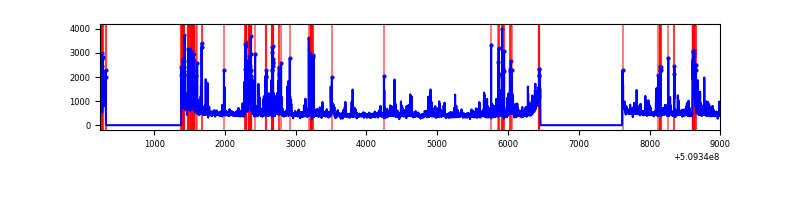 |
| D | 8760 | 6542 | 250 | 250 | 2.85% | 3.82% |  |
Top three noisy pixels from each quadrant. If the there are fewer than three noisy pixels in the level2.evt file, extra rows are filled as -1
| Pixel properties | Quadrant properties | ||||||
|---|---|---|---|---|---|---|---|
| Quadrant | DetID | PixID | Counts | Sigma | Mean | Median | Sigma |
| A | 15 | 32 | 5652395 | 51964.44 | 427 | 417 | 108.8 |
| A | 4 | 95 | 3333617 | 30645.53 | 427 | 417 | 108.8 |
| A | 8 | 176 | 3117058 | 28654.48 | 427 | 417 | 108.8 |
| B | 5 | 185 | 2231590 | 15161.27 | 698 | 674 | 147.1 |
| B | 0 | 63 | 157450 | 1065.45 | 698 | 674 | 147.1 |
| B | 10 | 247 | 59524 | 399.94 | 698 | 674 | 147.1 |
| C | 12 | 254 | 675786 | 3457.62 | 713 | 709 | 195.2 |
| C | 13 | 3 | 204143 | 1041.95 | 713 | 709 | 195.2 |
| C | 12 | 252 | 157925 | 805.23 | 713 | 709 | 195.2 |
| D | 2 | 249 | 1214418 | 5963.74 | 713 | 681 | 203.5 |
| D | 8 | 129 | 460290 | 2258.31 | 713 | 681 | 203.5 |
| D | 15 | 115 | 242755 | 1189.44 | 713 | 681 | 203.5 |
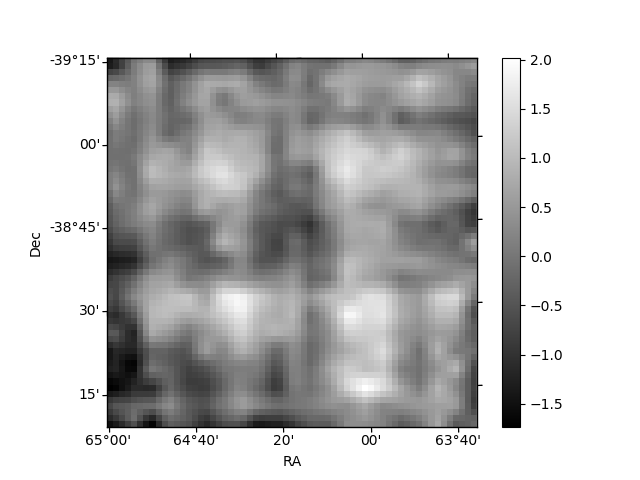
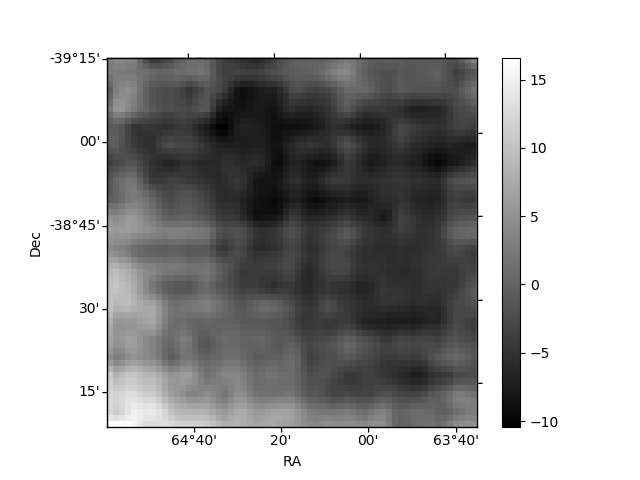
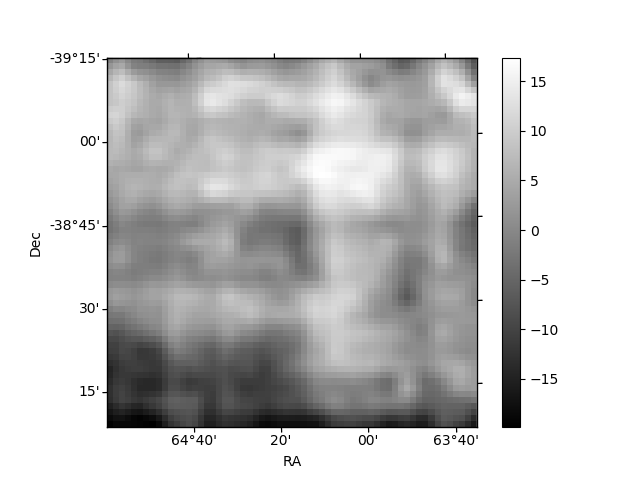
Histogram calculated using DETX and DETY for each event in the final _common_clean file
| Quadrant A | 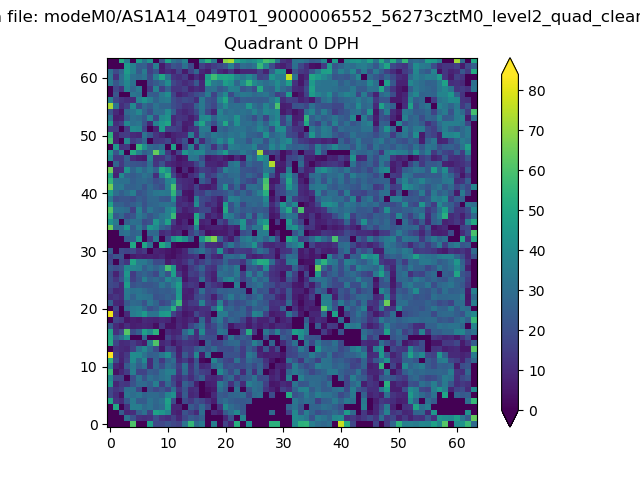 |
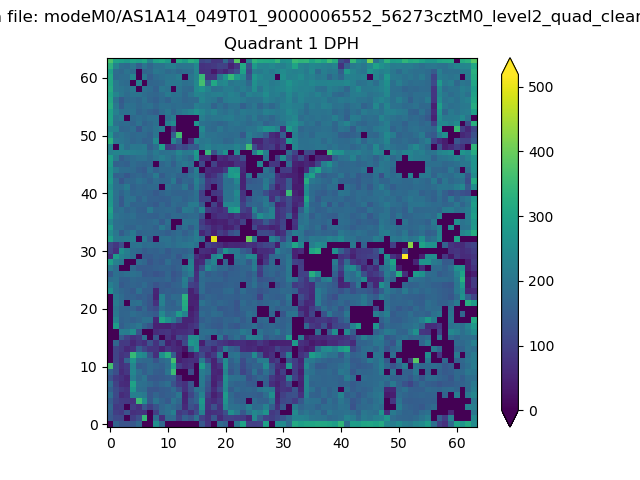 |
Quadrant B |
|---|---|---|---|
| Quadrant D | 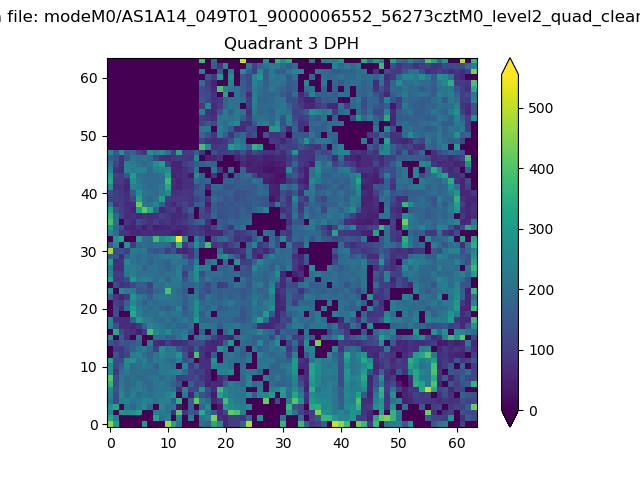 |
 |
Quadrant C |
| Plot type | Count rate plots | Images |
|---|---|---|
| Comparison with Poisson distribution Blue bars denote a histogram of data divided into 1 sec bins. Red curve is a Poisson curve with rate = median count rate of data. |
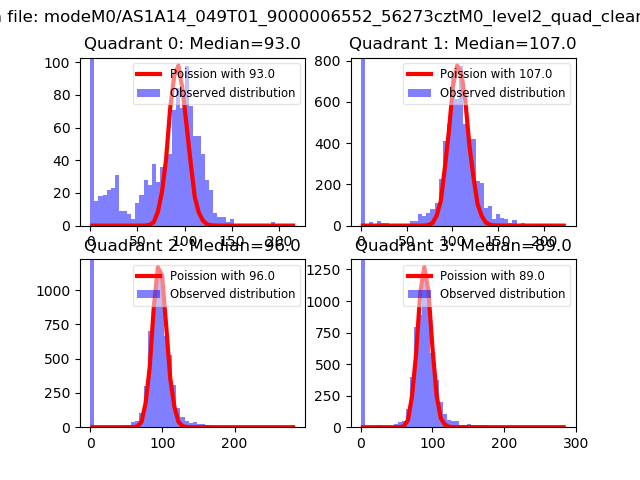 |
 |
| Quadrant-wise count rates Data is divided into 100 sec bins |
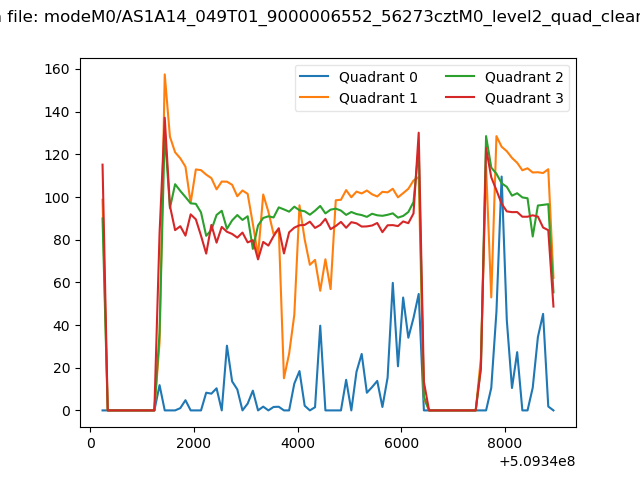 |
|
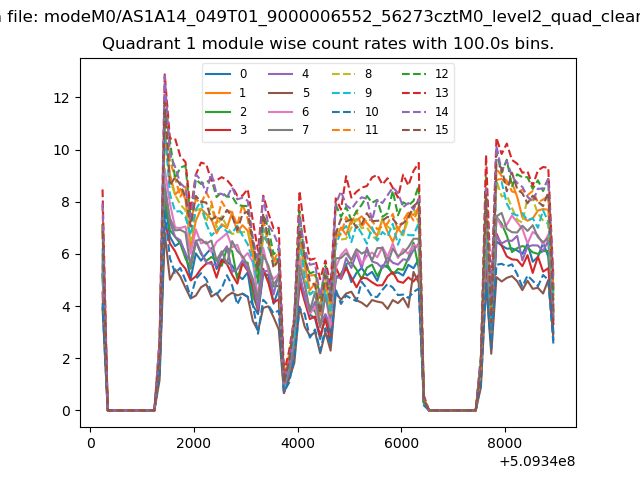
| Module-wise count rates for Quadrant A Data is divided into 100 sec bins |
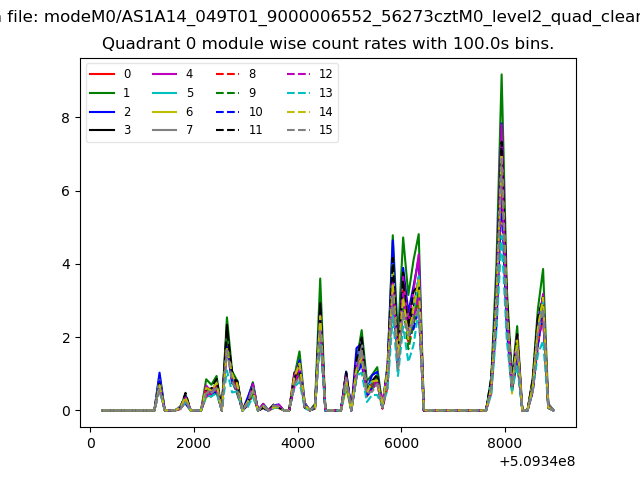 |
 |
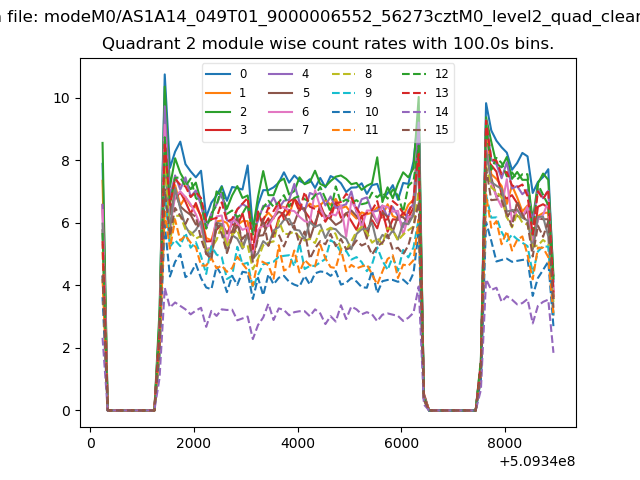
| Module-wise count rates for Quadrant B Data is divided into 100 sec bins |
 |
 |
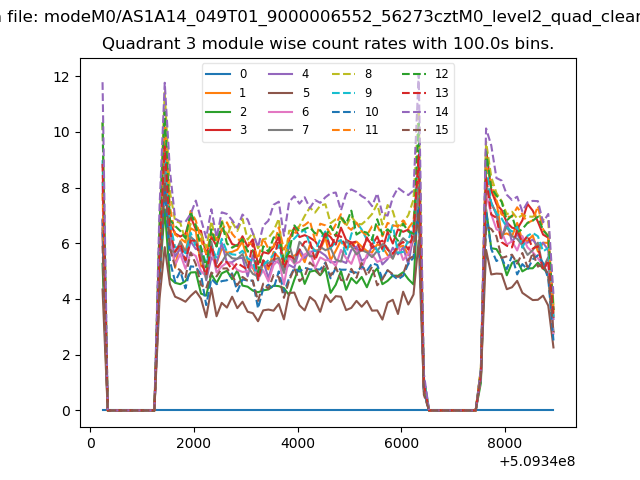
| Module-wise count rates for Quadrant C Data is divided into 100 sec bins |
 |
 |
| Module-wise count rates for Quadrant D Data is divided into 100 sec bins |
 |
 |
| Parameter | Plot |
|---|---|
| CZT HV Monitor |  |
| D_VDD | 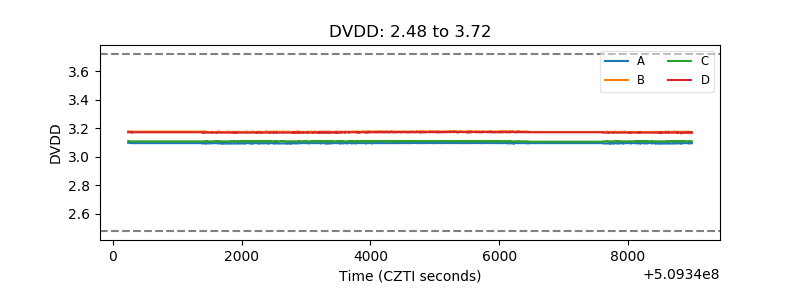 |
| Temperature 1 | 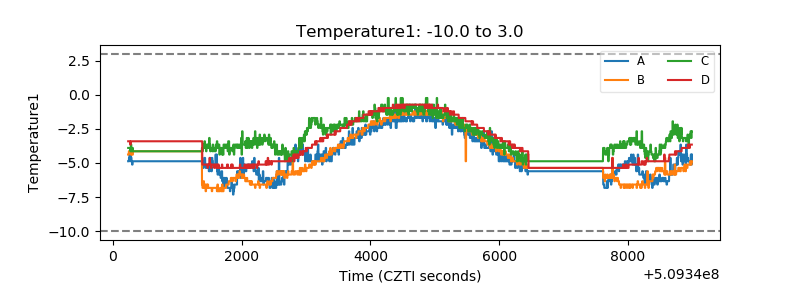 |
| Veto HV Monitor | 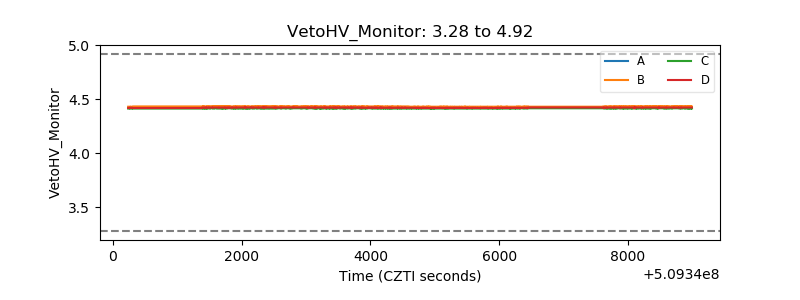 |
| Veto LLD | 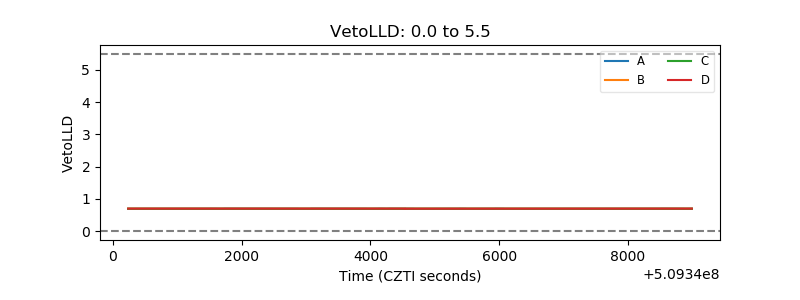 |
| Alpha Counter |  |
| _CPM_Rate | 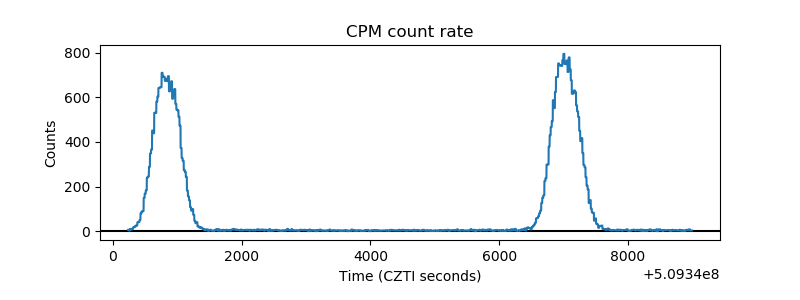 |
| CZT Counter | 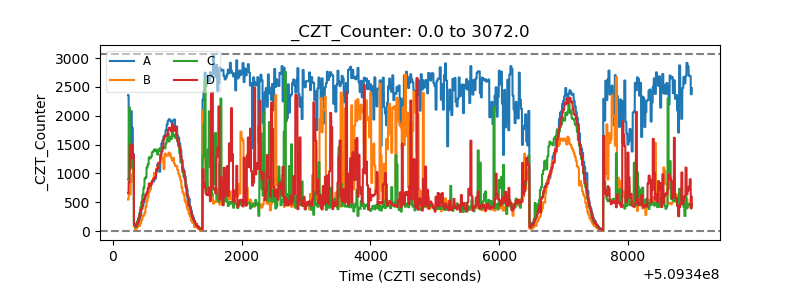 |
| +2.5 Volts monitor | 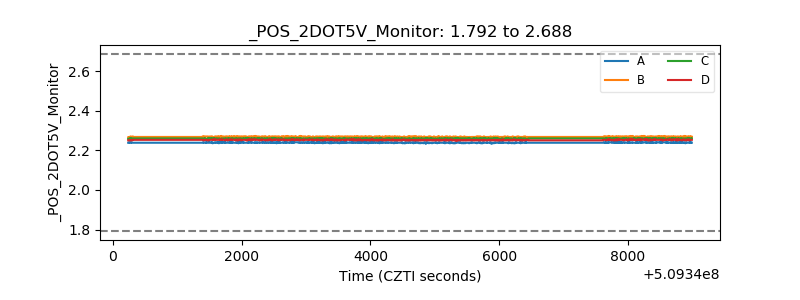 |
| +5 Volts monitor |  |
| _ROLL_ROT | 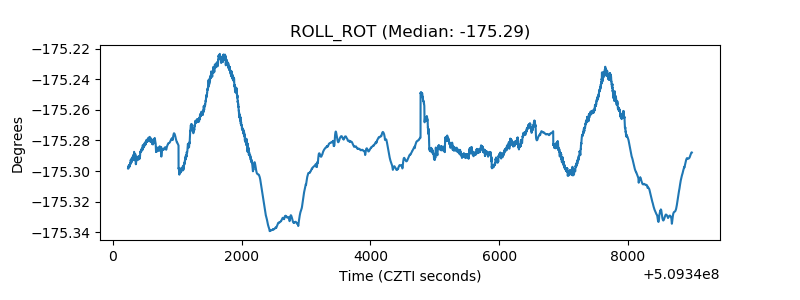 |
| _Roll_DEC | 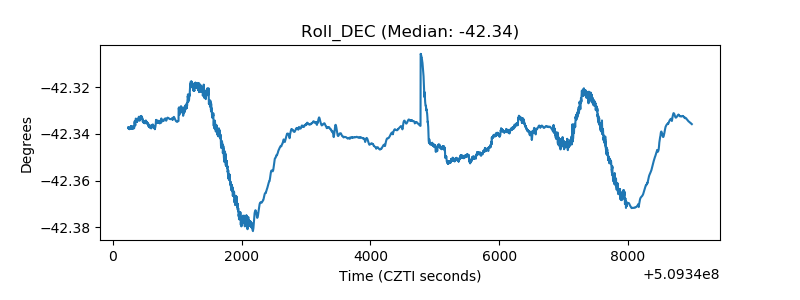 |
| _Roll_RA |  |
| Veto Counter | 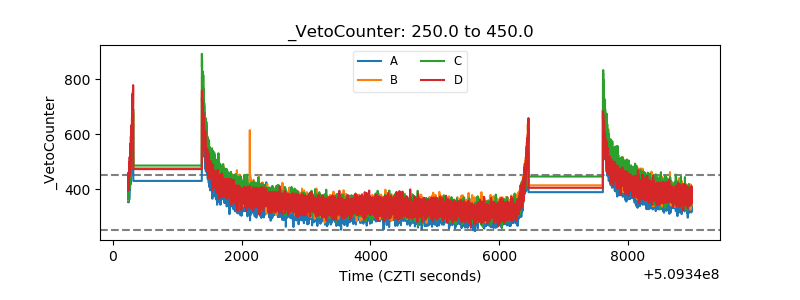 |