| Param | Original file | Final file |
|---|---|---|
| Filename | modeM0/AS1A14_049T01_9000006552_56275cztM0_level2.fits | modeM0/AS1A14_049T01_9000006552_56275cztM0_level2_quad_clean.evt |
| Size (bytes) | 844,816,320 | 74,615,040 |
| Size | 805.7 MB | 71.2 MB |
| Events in quadrant A | 16,367,635 | 30,212 |
| Events in quadrant B | 3,483,259 | 691,000 |
| Events in quadrant C | 4,553,951 | 591,407 |
| Events in quadrant D | 6,366,271 | 496,137 |
| Mode SS | |||
|---|---|---|---|
| Quadrant | BADHDUFLAG | Total packets | Discarded packets |
| A | 0 | 132 | 0 |
| B | 0 | 132 | 0 |
| C | 0 | 132 | 0 |
| D | 0 | 132 | 0 |
| Mode M9 | |||
|---|---|---|---|
| Quadrant | BADHDUFLAG | Total packets | Discarded packets |
| A | 0 | 14 | 0 |
| B | 0 | 14 | 0 |
| C | 0 | 15 | 0 |
| D | 0 | 15 | 0 |
| Mode M0 | |||
|---|---|---|---|
| Quadrant | BADHDUFLAG | Total packets | Discarded packets |
| A | 0 | 53010 | 2 |
| B | 0 | 14646 | 2 |
| C | 0 | 17977 | 2 |
| D | 0 | 23183 | 2 |
| Quadrant | Total seconds | Saturated seconds | Saturation percentage |
|---|---|---|---|
| A | 6456 | 6236 | 96.592317% |
| B | 6456 | 231 | 3.578067% |
| C | 6456 | 487 | 7.543371% |
| D | 6455 | 1150 | 17.815647% |
Noise dominated data is calculated using 1-second bins in cleaned event files. If a bin has >2000 counts, and if more than 50% of those come from <1% of pixels, then it is considered to be noise-dominated and hence unusable.
| Quadrant | # 1 sec bins | Bins with >0 counts | Bins with >2000 counts | High rate bins dominated by noise | Noise dominated (total time) | Noise dominated (detector-on time) | Marked lightcurve |
|---|---|---|---|---|---|---|---|
| A | 7595 | 6455 | 5928 | 5928 | 78.05% | 91.84% |  |
| B | 7596 | 6456 | 65 | 65 | 0.86% | 1.01% |  |
| C | 7596 | 6456 | 363 | 363 | 4.78% | 5.62% | 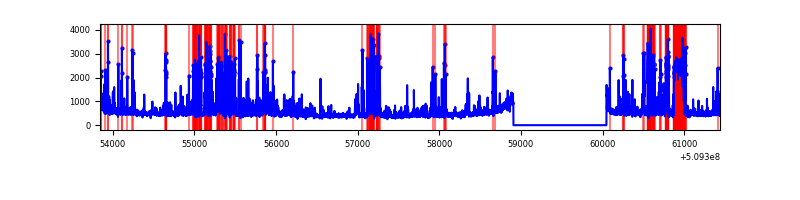 |
| D | 7595 | 6455 | 1075 | 1075 | 14.15% | 16.65% |  |
Top three noisy pixels from each quadrant. If the there are fewer than three noisy pixels in the level2.evt file, extra rows are filled as -1
| Pixel properties | Quadrant properties | ||||||
|---|---|---|---|---|---|---|---|
| Quadrant | DetID | PixID | Counts | Sigma | Mean | Median | Sigma |
| A | 12 | 115 | 5145967 | 64880.84 | 311 | 303 | 79.3 |
| A | 15 | 32 | 5125927 | 64628.16 | 311 | 303 | 79.3 |
| A | 8 | 176 | 2408765 | 30367.9 | 311 | 303 | 79.3 |
| B | 5 | 185 | 222856 | 1463.36 | 715 | 688 | 151.8 |
| B | 0 | 63 | 149469 | 979.98 | 715 | 688 | 151.8 |
| B | 10 | 247 | 110153 | 721.01 | 715 | 688 | 151.8 |
| C | 13 | 3 | 607871 | 3242.46 | 687 | 679 | 187.3 |
| C | 5 | 250 | 543530 | 2898.88 | 687 | 679 | 187.3 |
| C | 12 | 254 | 300378 | 1600.42 | 687 | 679 | 187.3 |
| D | 5 | 32 | 1749919 | 9386.98 | 655 | 626 | 186.4 |
| D | 8 | 129 | 712096 | 3817.86 | 655 | 626 | 186.4 |
| D | 8 | 240 | 669394 | 3588.72 | 655 | 626 | 186.4 |
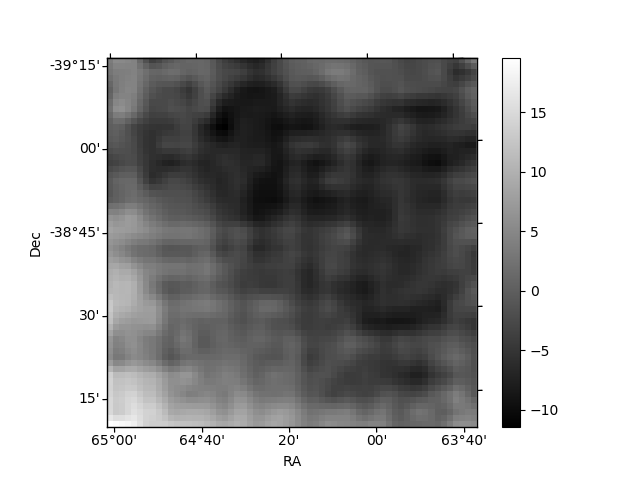
Histogram calculated using DETX and DETY for each event in the final _common_clean file
| Quadrant A | 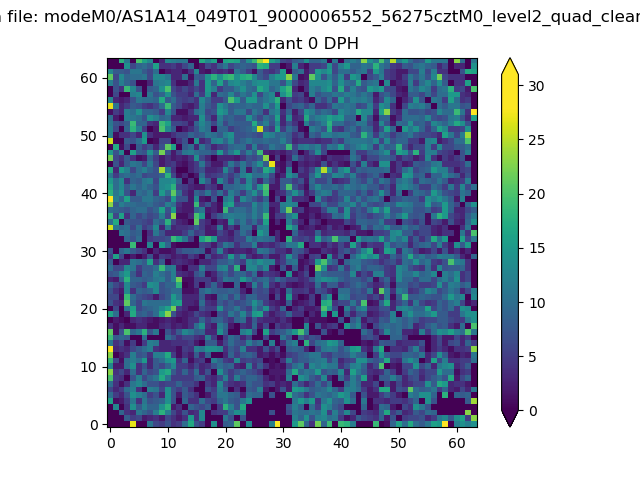 |
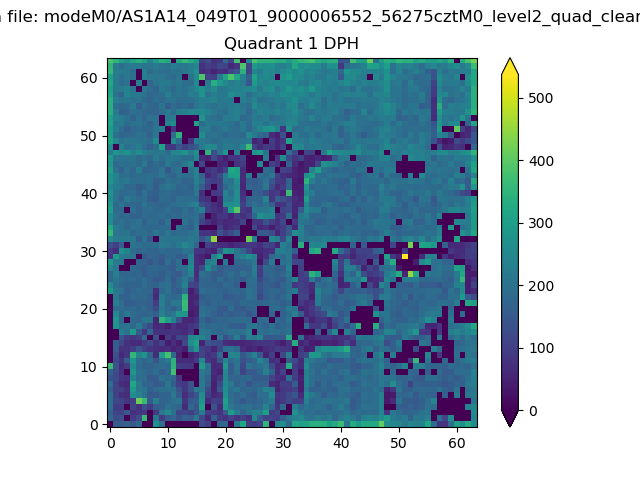 |
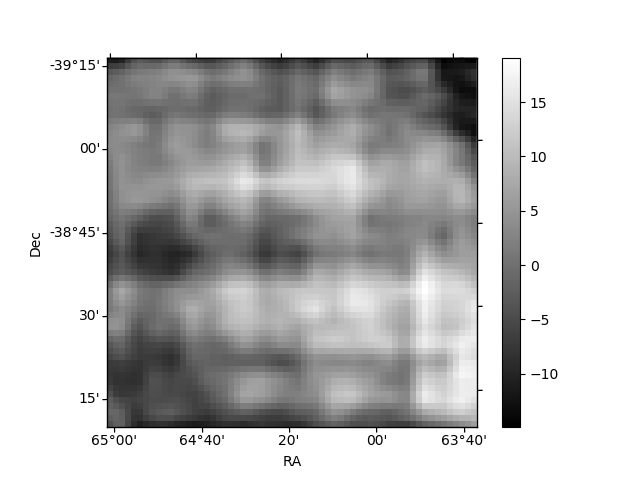
Quadrant B |
|---|---|---|---|
| Quadrant D | 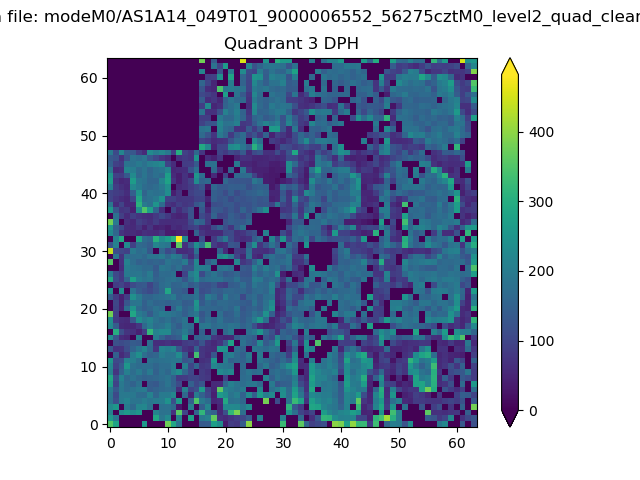 |
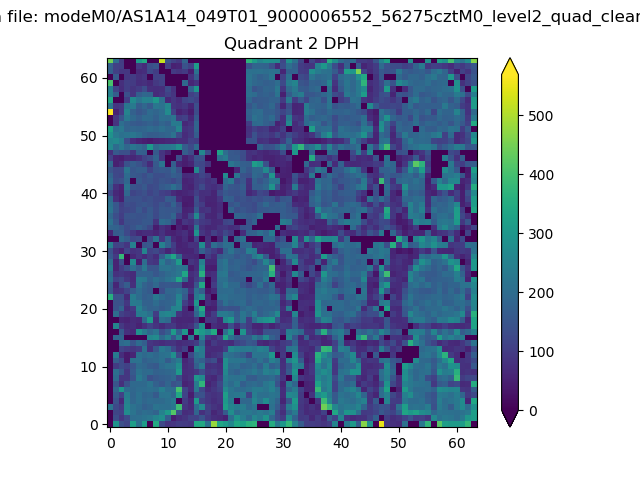 |
Quadrant C |
| Plot type | Count rate plots | Images |
|---|---|---|
| Comparison with Poisson distribution Blue bars denote a histogram of data divided into 1 sec bins. Red curve is a Poisson curve with rate = median count rate of data. |
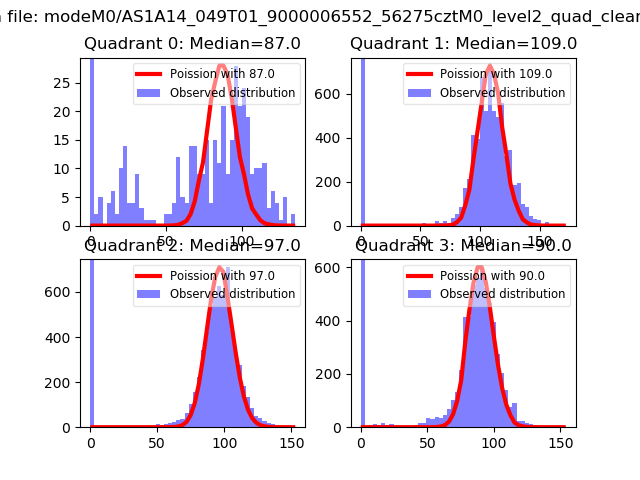 |
 |
| Quadrant-wise count rates Data is divided into 100 sec bins |
 |
|
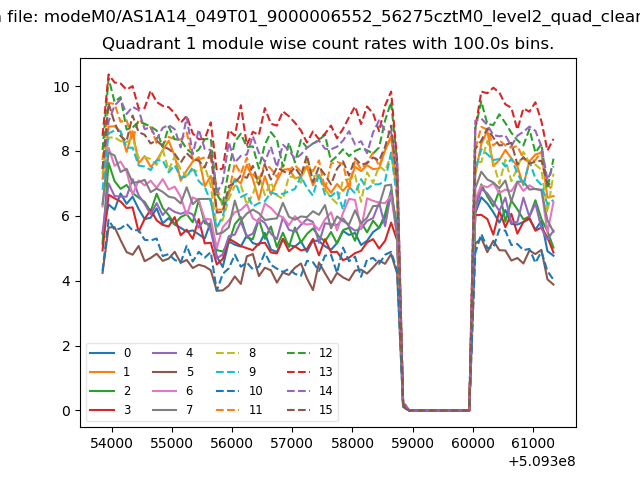
| Module-wise count rates for Quadrant A Data is divided into 100 sec bins |
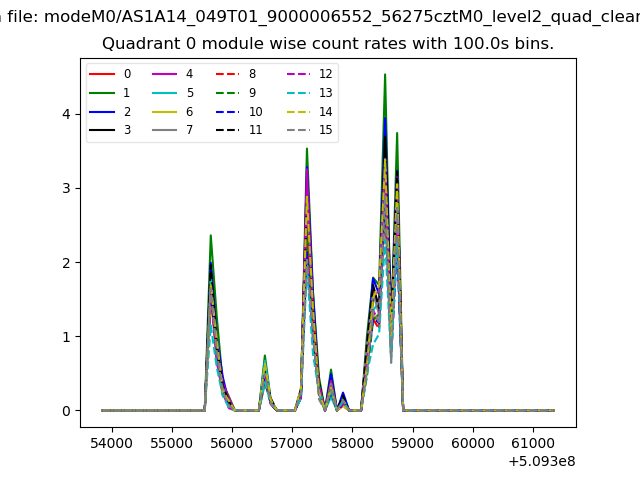 |
 |
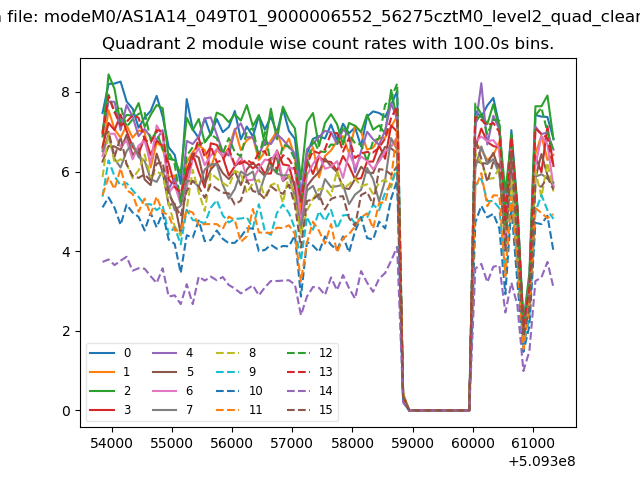
| Module-wise count rates for Quadrant B Data is divided into 100 sec bins |
 |
 |
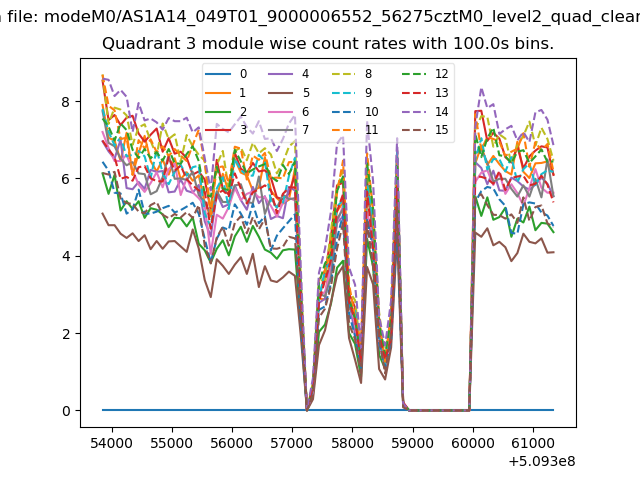
| Module-wise count rates for Quadrant C Data is divided into 100 sec bins |
 |
 |
| Module-wise count rates for Quadrant D Data is divided into 100 sec bins |
 |
 |
| Parameter | Plot |
|---|---|
| CZT HV Monitor | 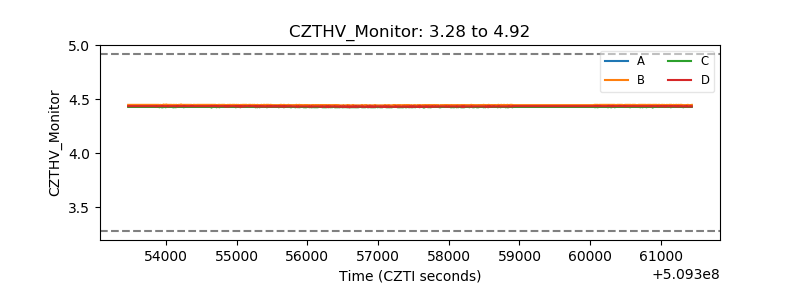 |
| D_VDD |  |
| Temperature 1 | 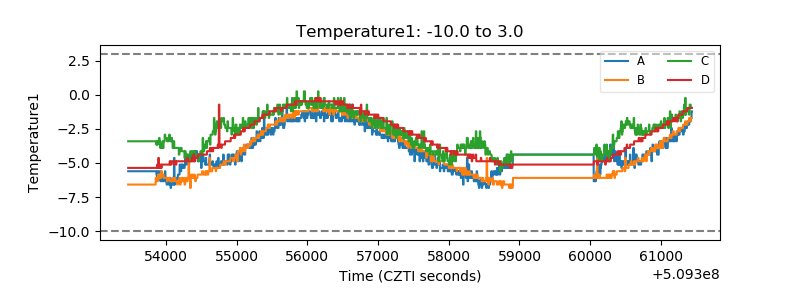 |
| Veto HV Monitor |  |
| Veto LLD |  |
| Alpha Counter |  |
| _CPM_Rate | 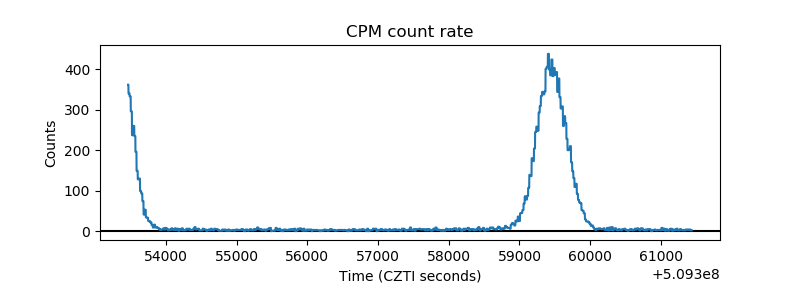 |
| CZT Counter | 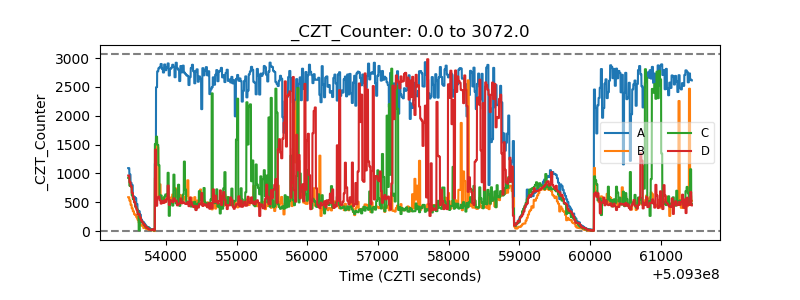 |
| +2.5 Volts monitor | 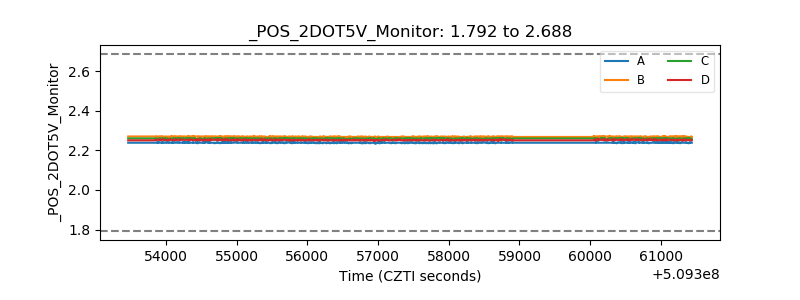 |
| +5 Volts monitor | 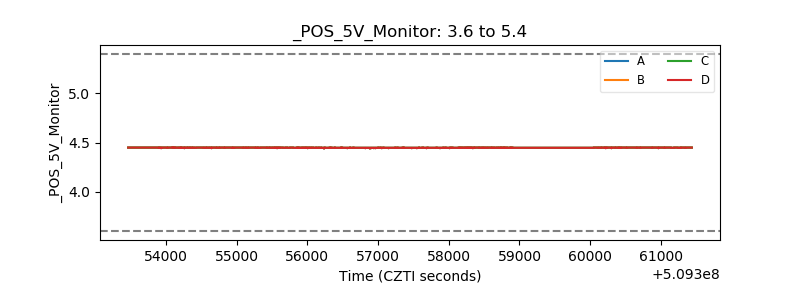 |
| _ROLL_ROT |  |
| _Roll_DEC |  |
| _Roll_RA |  |
| Veto Counter |  |