| Param | Original file | Final file |
|---|---|---|
| Filename | modeM0/AS1A14_049T01_9000006552_56276cztM0_level2.fits | modeM0/AS1A14_049T01_9000006552_56276cztM0_level2_quad_clean.evt |
| Size (bytes) | 828,806,400 | 68,650,560 |
| Size | 790.4 MB | 65.5 MB |
| Events in quadrant A | 15,597,155 | 33,857 |
| Events in quadrant B | 3,471,731 | 619,303 |
| Events in quadrant C | 4,993,415 | 510,156 |
| Events in quadrant D | 6,149,832 | 493,674 |
| Mode SS | |||
|---|---|---|---|
| Quadrant | BADHDUFLAG | Total packets | Discarded packets |
| A | 0 | 124 | 0 |
| B | 0 | 124 | 0 |
| C | 0 | 124 | 0 |
| D | 0 | 124 | 0 |
| Mode M9 | |||
|---|---|---|---|
| Quadrant | BADHDUFLAG | Total packets | Discarded packets |
| A | 0 | 10 | 0 |
| B | 0 | 10 | 0 |
| C | 0 | 10 | 0 |
| D | 0 | 10 | 0 |
| Mode M0 | |||
|---|---|---|---|
| Quadrant | BADHDUFLAG | Total packets | Discarded packets |
| A | 0 | 50394 | 1 |
| B | 0 | 14505 | 1 |
| C | 0 | 19077 | 1 |
| D | 0 | 22405 | 1 |
| Quadrant | Total seconds | Saturated seconds | Saturation percentage |
|---|---|---|---|
| A | 6034 | 5761 | 95.475638% |
| B | 6033 | 240 | 3.978120% |
| C | 6033 | 691 | 11.453671% |
| D | 6034 | 512 | 8.485250% |
Noise dominated data is calculated using 1-second bins in cleaned event files. If a bin has >2000 counts, and if more than 50% of those come from <1% of pixels, then it is considered to be noise-dominated and hence unusable.
| Quadrant | # 1 sec bins | Bins with >0 counts | Bins with >2000 counts | High rate bins dominated by noise | Noise dominated (total time) | Noise dominated (detector-on time) | Marked lightcurve |
|---|---|---|---|---|---|---|---|
| A | 7034 | 6034 | 5561 | 5561 | 79.06% | 92.16% |  |
| B | 7032 | 6032 | 105 | 105 | 1.49% | 1.74% |  |
| C | 7033 | 6034 | 524 | 524 | 7.45% | 8.68% | 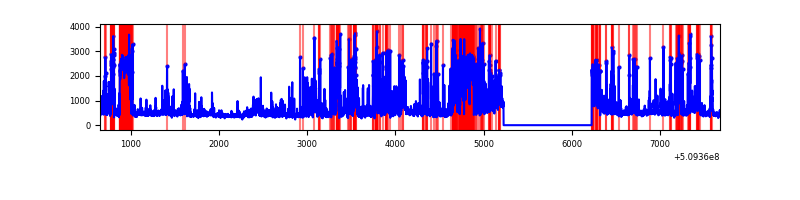 |
| D | 7034 | 6035 | 623 | 623 | 8.86% | 10.32% |  |
Top three noisy pixels from each quadrant. If the there are fewer than three noisy pixels in the level2.evt file, extra rows are filled as -1
| Pixel properties | Quadrant properties | ||||||
|---|---|---|---|---|---|---|---|
| Quadrant | DetID | PixID | Counts | Sigma | Mean | Median | Sigma |
| A | 12 | 115 | 6909651 | 114528.4 | 234 | 228 | 60.3 |
| A | 15 | 32 | 4289232 | 71093.17 | 234 | 228 | 60.3 |
| A | 8 | 176 | 2017233 | 33433.23 | 234 | 228 | 60.3 |
| B | 5 | 185 | 434552 | 3125.3 | 645 | 622 | 138.8 |
| B | 8 | 128 | 104829 | 750.53 | 645 | 622 | 138.8 |
| B | 0 | 63 | 86613 | 619.33 | 645 | 622 | 138.8 |
| C | 12 | 254 | 1765572 | 10749.35 | 597 | 592 | 164.2 |
| C | 13 | 3 | 454368 | 2763.65 | 597 | 592 | 164.2 |
| C | 12 | 252 | 171205 | 1039.09 | 597 | 592 | 164.2 |
| D | 7 | 77 | 2035031 | 11454.33 | 628 | 599 | 177.6 |
| D | 5 | 32 | 782943 | 4404.78 | 628 | 599 | 177.6 |
| D | 2 | 249 | 256693 | 1441.87 | 628 | 599 | 177.6 |
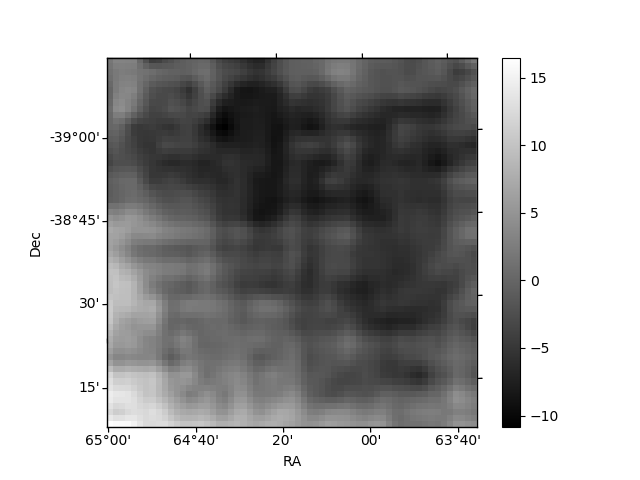
Histogram calculated using DETX and DETY for each event in the final _common_clean file
| Quadrant A |  |
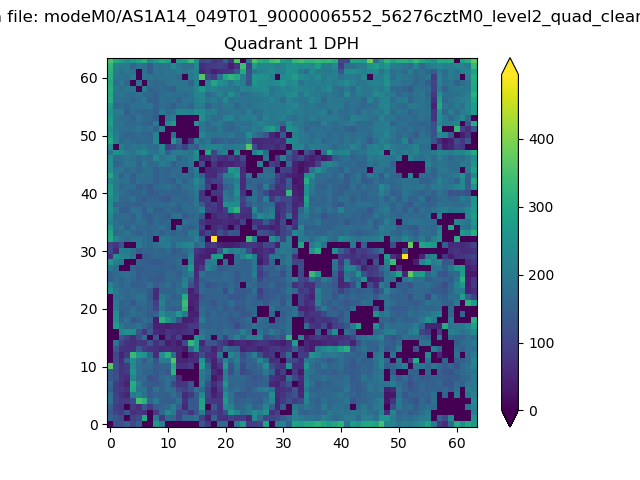 |
Quadrant B |
|---|---|---|---|
| Quadrant D | 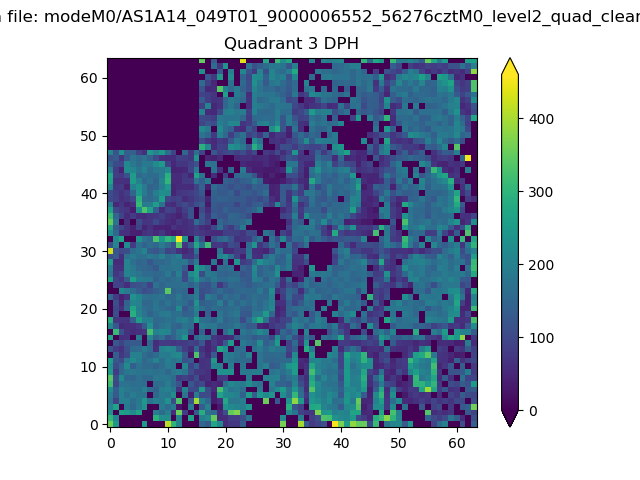 |
 |
Quadrant C |
| Plot type | Count rate plots | Images |
|---|---|---|
| Comparison with Poisson distribution Blue bars denote a histogram of data divided into 1 sec bins. Red curve is a Poisson curve with rate = median count rate of data. |
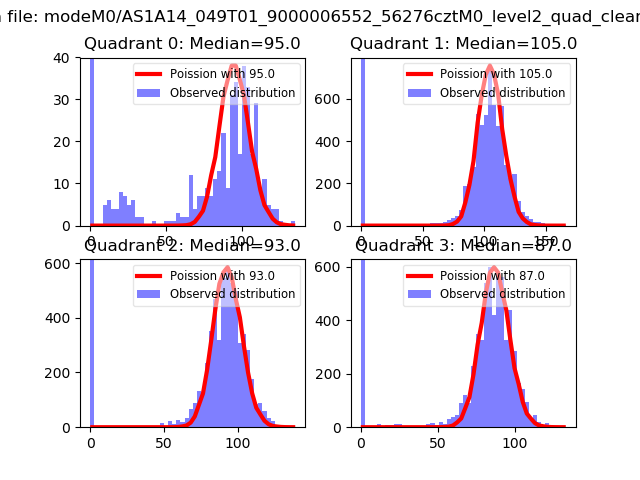 |
 |
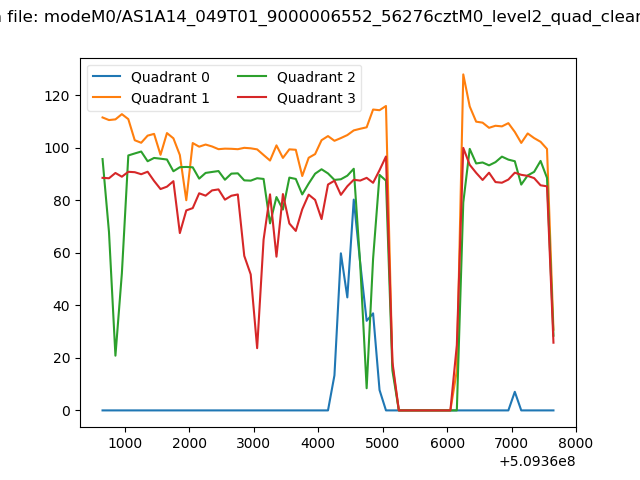
| Quadrant-wise count rates Data is divided into 100 sec bins |
 |
|
| Module-wise count rates for Quadrant A Data is divided into 100 sec bins |
 |
 |
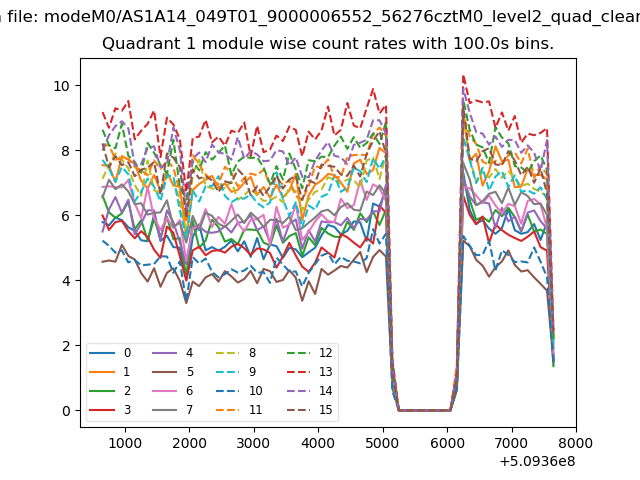
| Module-wise count rates for Quadrant B Data is divided into 100 sec bins |
 |
 |
| Module-wise count rates for Quadrant C Data is divided into 100 sec bins |
 |
 |
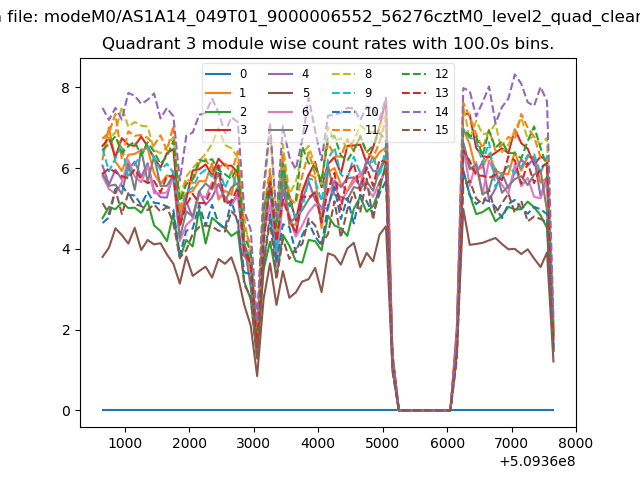
| Module-wise count rates for Quadrant D Data is divided into 100 sec bins |
 |
 |
| Parameter | Plot |
|---|---|
| CZT HV Monitor | 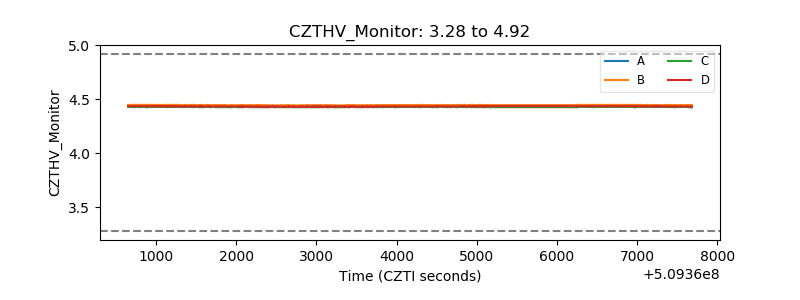 |
| D_VDD |  |
| Temperature 1 |  |
| Veto HV Monitor | 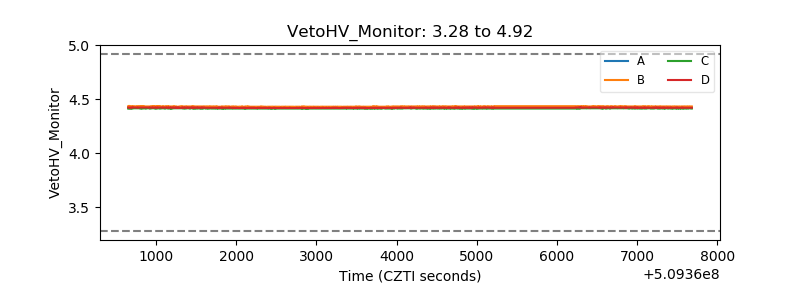 |
| Veto LLD | 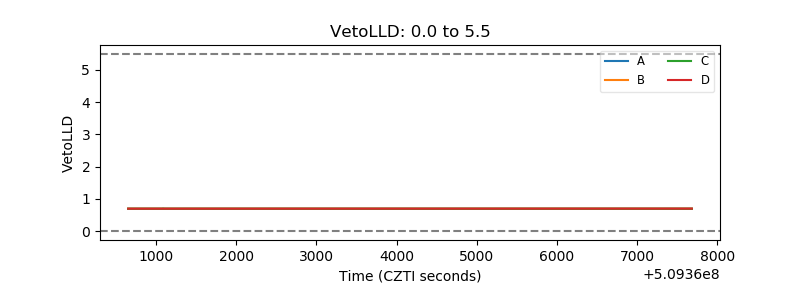 |
| Alpha Counter |  |
| _CPM_Rate | 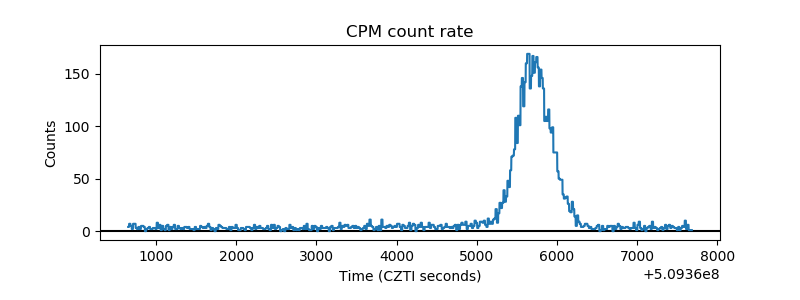 |
| CZT Counter |  |
| +2.5 Volts monitor |  |
| +5 Volts monitor | 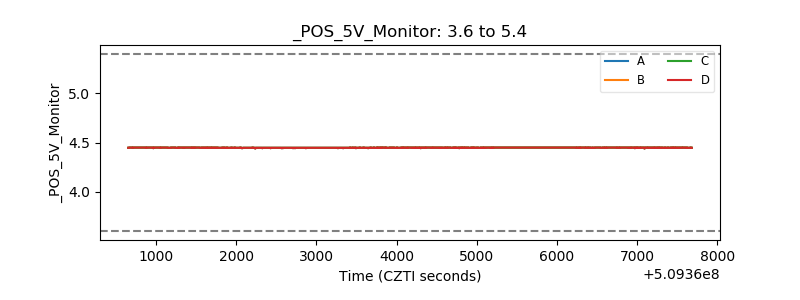 |
| _ROLL_ROT | 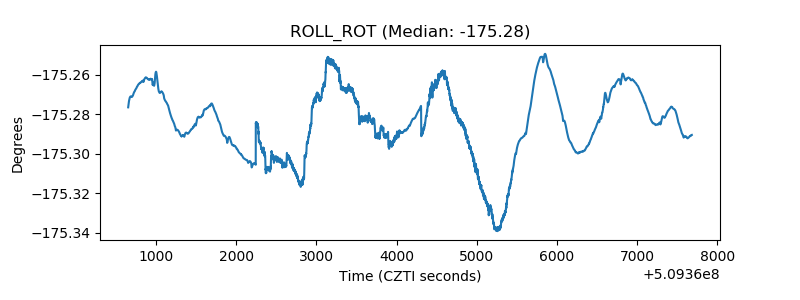 |
| _Roll_DEC | 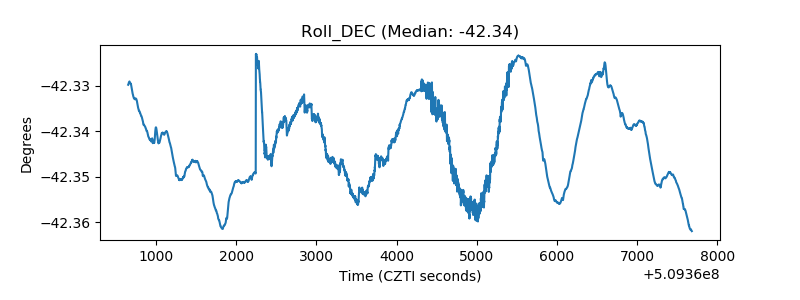 |
| _Roll_RA |  |
| Veto Counter | 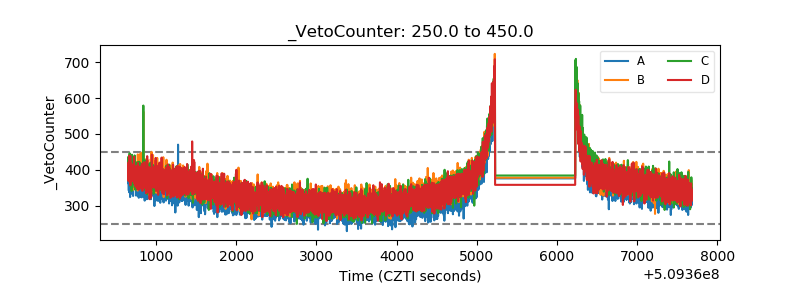 |