| Param | Original file | Final file |
|---|---|---|
| Filename | modeM0/AS1A14_049T01_9000006552_56278cztM0_level2.fits | modeM0/AS1A14_049T01_9000006552_56278cztM0_level2_quad_clean.evt |
| Size (bytes) | 811,465,920 | 91,532,160 |
| Size | 773.9 MB | 87.3 MB |
| Events in quadrant A | 13,574,812 | 399,357 |
| Events in quadrant B | 3,980,551 | 716,653 |
| Events in quadrant C | 6,505,730 | 575,062 |
| Events in quadrant D | 5,421,599 | 580,604 |
| Mode SS | |||
|---|---|---|---|
| Quadrant | BADHDUFLAG | Total packets | Discarded packets |
| A | 0 | 144 | 0 |
| B | 0 | 144 | 0 |
| C | 0 | 144 | 0 |
| D | 0 | 144 | 0 |
| Mode M0 | |||
|---|---|---|---|
| Quadrant | BADHDUFLAG | Total packets | Discarded packets |
| A | 0 | 45305 | 0 |
| B | 0 | 17022 | 0 |
| C | 0 | 24464 | 0 |
| D | 0 | 21215 | 0 |
| Quadrant | Total seconds | Saturated seconds | Saturation percentage |
|---|---|---|---|
| A | 7171 | 3505 | 48.877423% |
| B | 7171 | 293 | 4.085902% |
| C | 7171 | 1064 | 14.837540% |
| D | 7171 | 502 | 7.000418% |
Noise dominated data is calculated using 1-second bins in cleaned event files. If a bin has >2000 counts, and if more than 50% of those come from <1% of pixels, then it is considered to be noise-dominated and hence unusable.
| Quadrant | # 1 sec bins | Bins with >0 counts | Bins with >2000 counts | High rate bins dominated by noise | Noise dominated (total time) | Noise dominated (detector-on time) | Marked lightcurve |
|---|---|---|---|---|---|---|---|
| A | 7171 | 7171 | 3398 | 3398 | 47.39% | 47.39% |  |
| B | 7171 | 7171 | 115 | 115 | 1.60% | 1.60% | 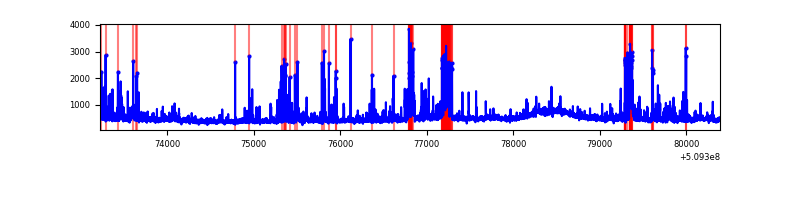 |
| C | 7171 | 7171 | 928 | 928 | 12.94% | 12.94% |  |
| D | 7171 | 7171 | 521 | 521 | 7.27% | 7.27% |  |
Top three noisy pixels from each quadrant. If the there are fewer than three noisy pixels in the level2.evt file, extra rows are filled as -1
| Pixel properties | Quadrant properties | ||||||
|---|---|---|---|---|---|---|---|
| Quadrant | DetID | PixID | Counts | Sigma | Mean | Median | Sigma |
| A | 8 | 176 | 4243563 | 26641.61 | 639 | 623 | 159.3 |
| A | 12 | 115 | 2854835 | 17921.73 | 639 | 623 | 159.3 |
| A | 15 | 32 | 2320206 | 14564.77 | 639 | 623 | 159.3 |
| B | 5 | 185 | 375571 | 2274.89 | 770 | 743 | 164.8 |
| B | 8 | 128 | 153044 | 924.34 | 770 | 743 | 164.8 |
| B | 1 | 207 | 100610 | 606.11 | 770 | 743 | 164.8 |
| C | 12 | 254 | 2513164 | 12961.32 | 703 | 695 | 193.8 |
| C | 13 | 3 | 598329 | 3083.07 | 703 | 695 | 193.8 |
| C | 12 | 252 | 216334 | 1112.44 | 703 | 695 | 193.8 |
| D | 5 | 32 | 1169940 | 5535.44 | 738 | 705 | 211.2 |
| D | 8 | 129 | 404973 | 1913.9 | 738 | 705 | 211.2 |
| D | 3 | 12 | 236514 | 1116.38 | 738 | 705 | 211.2 |
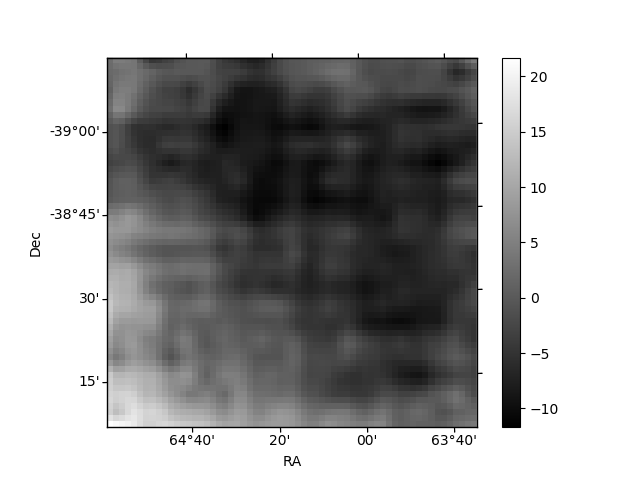
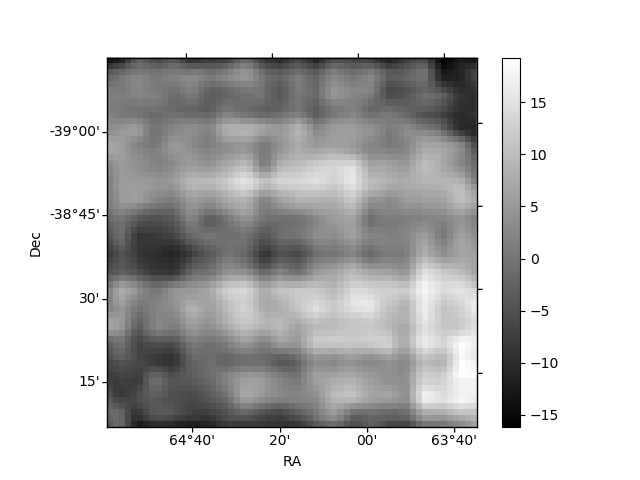
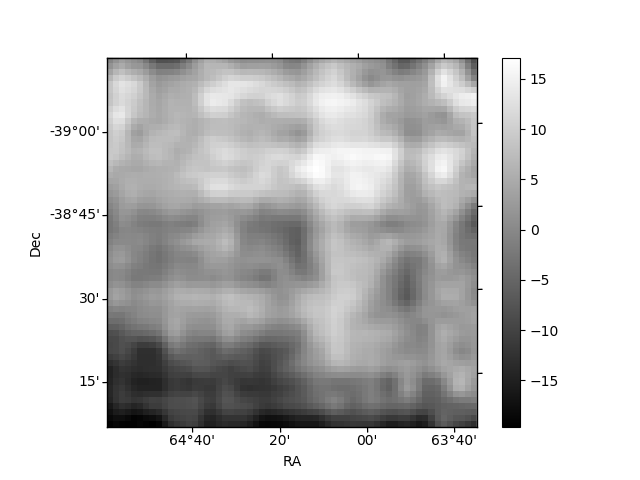
Histogram calculated using DETX and DETY for each event in the final _common_clean file
| Quadrant A | 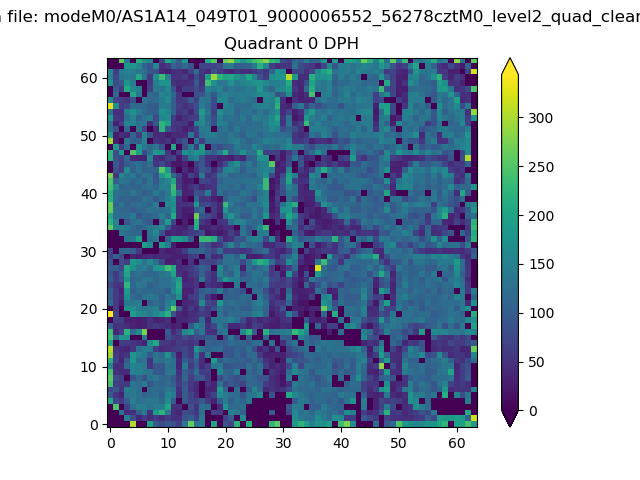 |
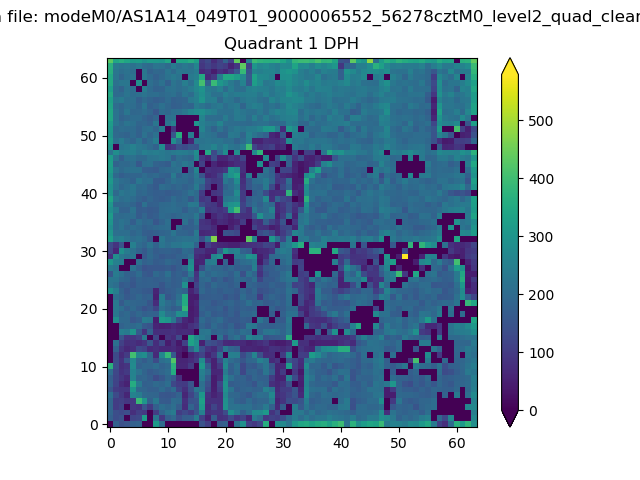 |
Quadrant B |
|---|---|---|---|
| Quadrant D | 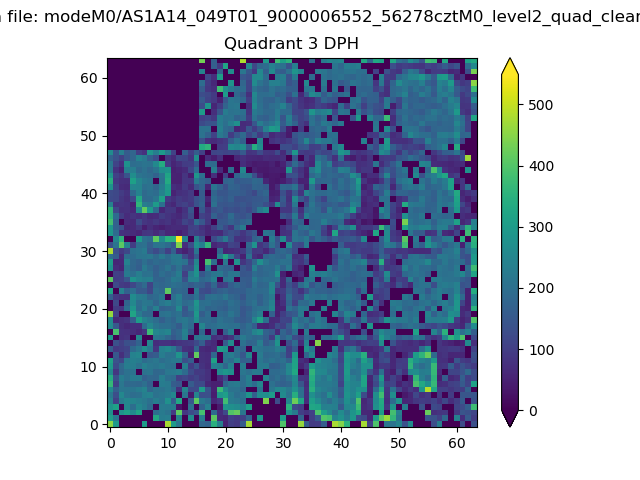 |
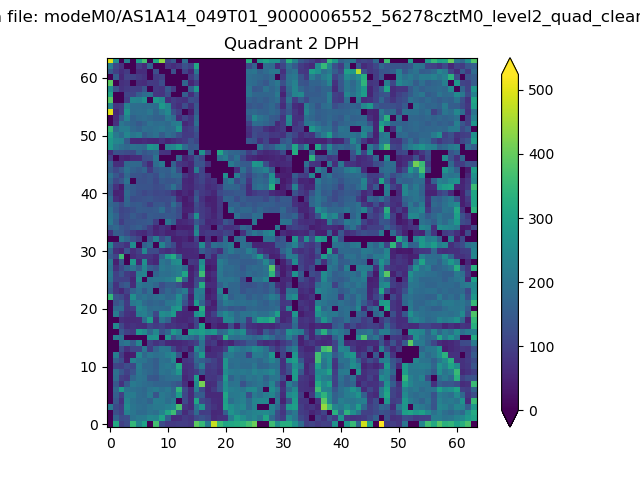 |
Quadrant C |
| Plot type | Count rate plots | Images |
|---|---|---|
| Comparison with Poisson distribution Blue bars denote a histogram of data divided into 1 sec bins. Red curve is a Poisson curve with rate = median count rate of data. |
 |
 |
| Quadrant-wise count rates Data is divided into 100 sec bins |
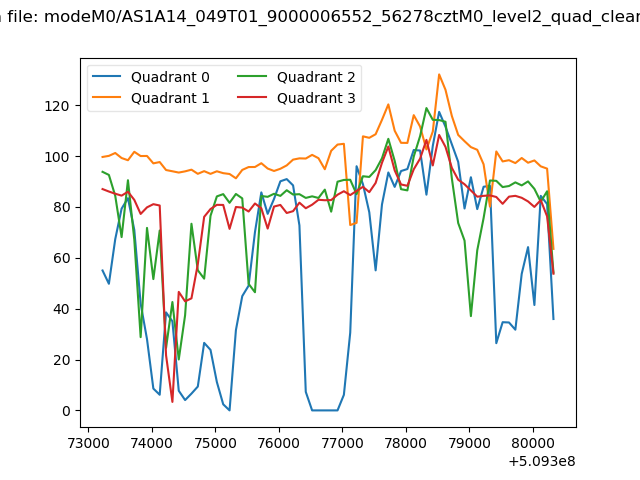 |
|
| Module-wise count rates for Quadrant A Data is divided into 100 sec bins |
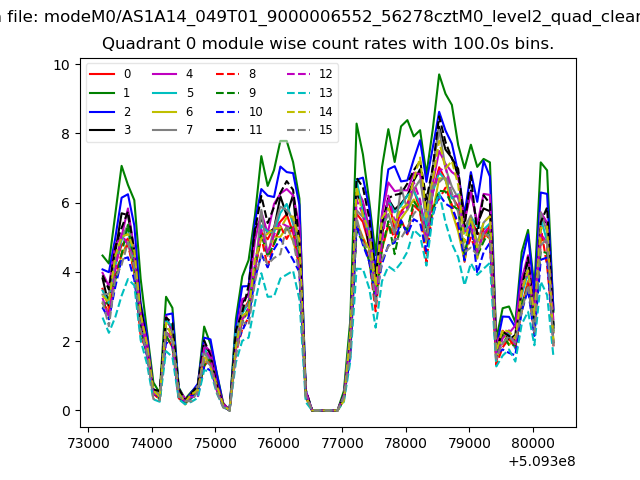 |
 |
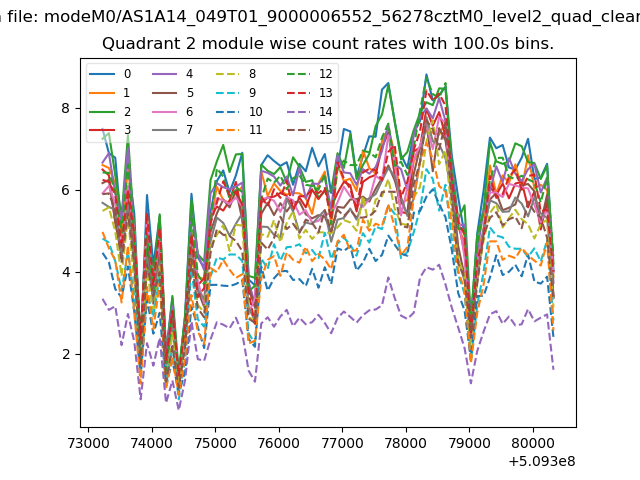
| Module-wise count rates for Quadrant B Data is divided into 100 sec bins |
 |
 |
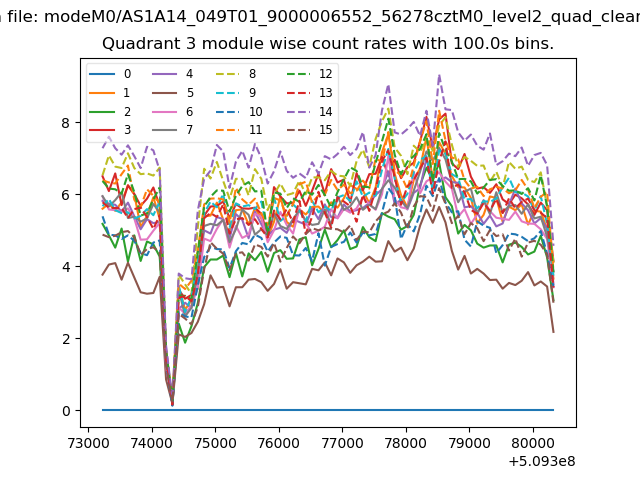
| Module-wise count rates for Quadrant C Data is divided into 100 sec bins |
 |
 |
| Module-wise count rates for Quadrant D Data is divided into 100 sec bins |
 |
 |
| Parameter | Plot |
|---|---|
| CZT HV Monitor |  |
| D_VDD |  |
| Temperature 1 | 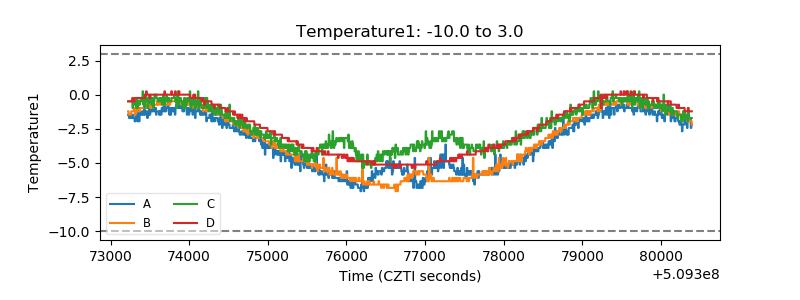 |
| Veto HV Monitor | 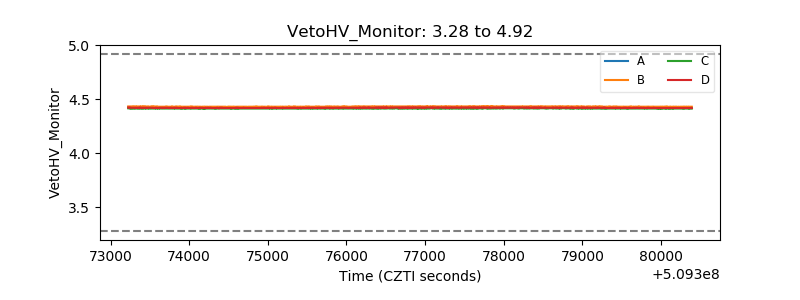 |
| Veto LLD |  |
| Alpha Counter |  |
| _CPM_Rate |  |
| CZT Counter | 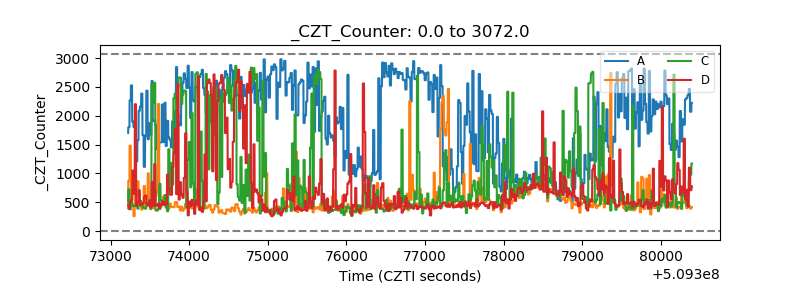 |
| +2.5 Volts monitor | 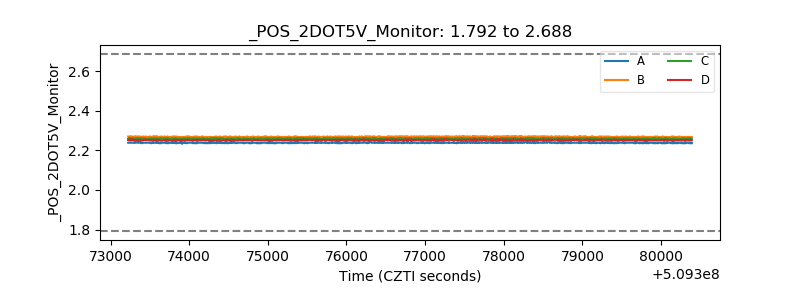 |
| +5 Volts monitor |  |
| _ROLL_ROT | 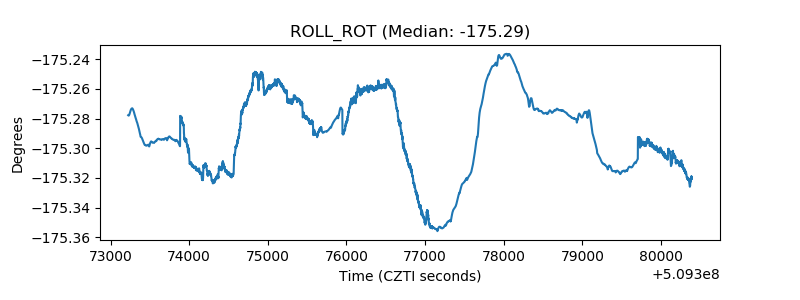 |
| _Roll_DEC | 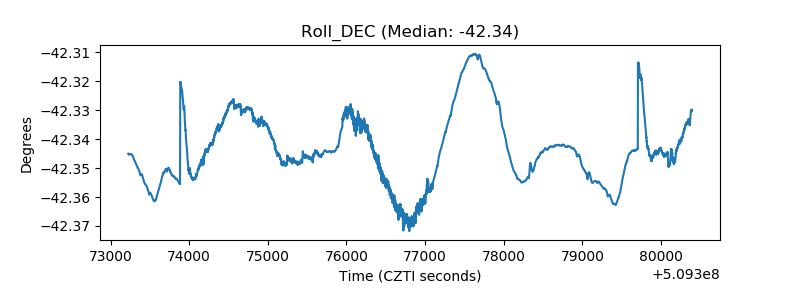 |
| _Roll_RA | 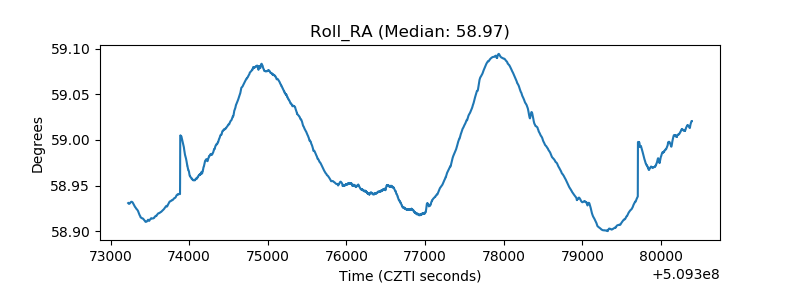 |
| Veto Counter | 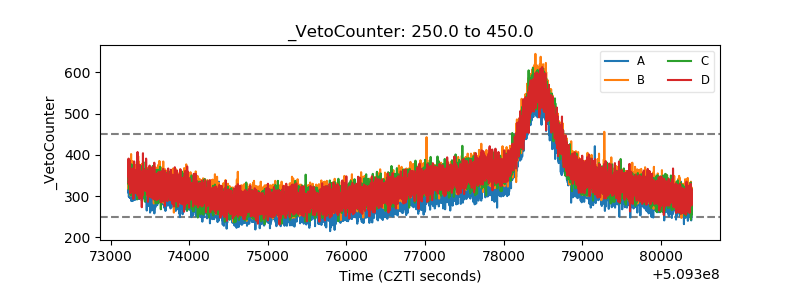 |