| Param | Original file | Final file |
|---|---|---|
| Filename | modeM0/AS1A14_049T01_9000006552_56279cztM0_level2.fits | modeM0/AS1A14_049T01_9000006552_56279cztM0_level2_quad_clean.evt |
| Size (bytes) | 748,656,000 | 88,401,600 |
| Size | 714.0 MB | 84.3 MB |
| Events in quadrant A | 13,147,234 | 350,577 |
| Events in quadrant B | 3,738,678 | 687,434 |
| Events in quadrant C | 4,729,101 | 606,821 |
| Events in quadrant D | 5,560,704 | 548,591 |
| Mode SS | |||
|---|---|---|---|
| Quadrant | BADHDUFLAG | Total packets | Discarded packets |
| A | 0 | 138 | 0 |
| B | 0 | 138 | 0 |
| C | 0 | 138 | 0 |
| D | 0 | 138 | 0 |
| Mode M0 | |||
|---|---|---|---|
| Quadrant | BADHDUFLAG | Total packets | Discarded packets |
| A | 0 | 43832 | 1 |
| B | 0 | 15987 | 0 |
| C | 0 | 18947 | 0 |
| D | 0 | 21406 | 0 |
| Quadrant | Total seconds | Saturated seconds | Saturation percentage |
|---|---|---|---|
| A | 6934 | 3514 | 50.677819% |
| B | 6935 | 146 | 2.105263% |
| C | 6935 | 265 | 3.821197% |
| D | 6935 | 473 | 6.820476% |
Noise dominated data is calculated using 1-second bins in cleaned event files. If a bin has >2000 counts, and if more than 50% of those come from <1% of pixels, then it is considered to be noise-dominated and hence unusable.
| Quadrant | # 1 sec bins | Bins with >0 counts | Bins with >2000 counts | High rate bins dominated by noise | Noise dominated (total time) | Noise dominated (detector-on time) | Marked lightcurve |
|---|---|---|---|---|---|---|---|
| A | 6934 | 6934 | 3461 | 3461 | 49.91% | 49.91% |  |
| B | 6935 | 6935 | 58 | 58 | 0.84% | 0.84% | 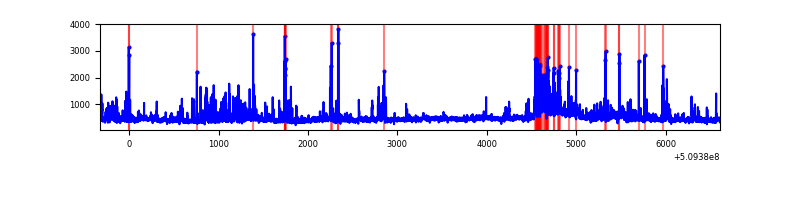 |
| C | 6935 | 6935 | 244 | 244 | 3.52% | 3.52% |  |
| D | 6935 | 6935 | 505 | 505 | 7.28% | 7.28% |  |
Top three noisy pixels from each quadrant. If the there are fewer than three noisy pixels in the level2.evt file, extra rows are filled as -1
| Pixel properties | Quadrant properties | ||||||
|---|---|---|---|---|---|---|---|
| Quadrant | DetID | PixID | Counts | Sigma | Mean | Median | Sigma |
| A | 8 | 176 | 4237338 | 29188.37 | 575 | 562 | 145.2 |
| A | 15 | 32 | 3541546 | 24394.86 | 575 | 562 | 145.2 |
| A | 12 | 115 | 1011042 | 6961.49 | 575 | 562 | 145.2 |
| B | 5 | 185 | 280275 | 1834.81 | 717 | 692 | 152.4 |
| B | 1 | 207 | 112504 | 733.79 | 717 | 692 | 152.4 |
| B | 0 | 171 | 75013 | 487.74 | 717 | 692 | 152.4 |
| C | 15 | 230 | 640395 | 3358.7 | 692 | 686 | 190.5 |
| C | 12 | 254 | 614716 | 3223.88 | 692 | 686 | 190.5 |
| C | 5 | 250 | 178176 | 931.89 | 692 | 686 | 190.5 |
| D | 2 | 249 | 1055009 | 5459.4 | 675 | 643 | 193.1 |
| D | 3 | 12 | 535276 | 2768.28 | 675 | 643 | 193.1 |
| D | 7 | 77 | 294329 | 1520.68 | 675 | 643 | 193.1 |
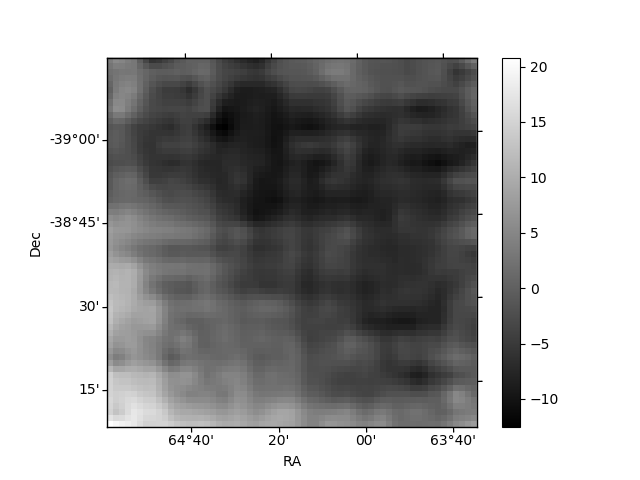
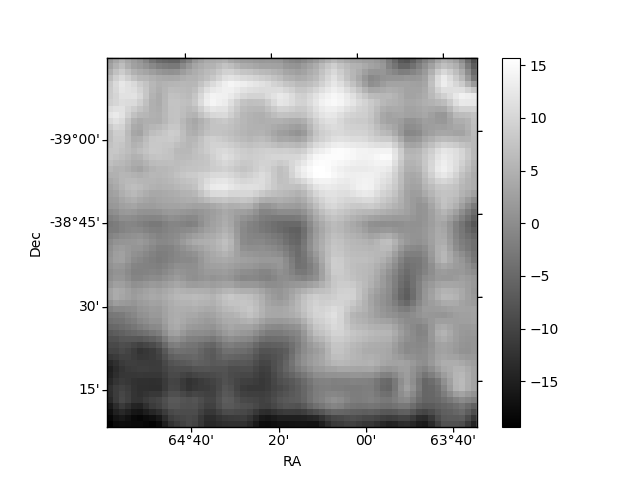
Histogram calculated using DETX and DETY for each event in the final _common_clean file
| Quadrant A | 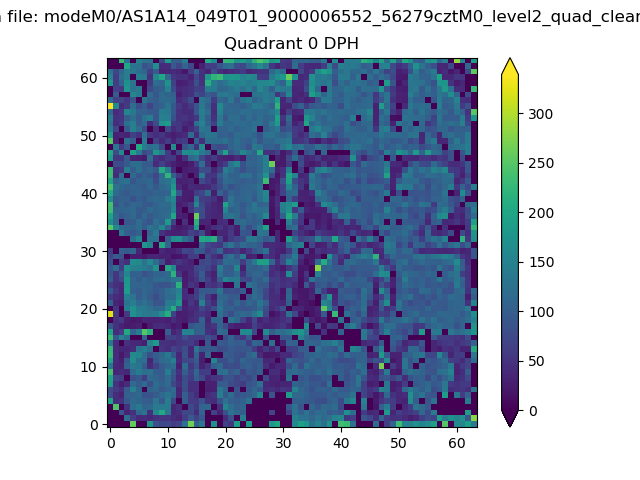 |
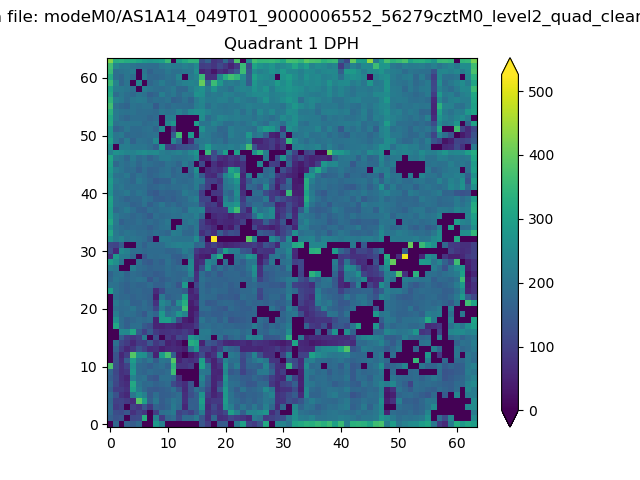 |
Quadrant B |
|---|---|---|---|
| Quadrant D | 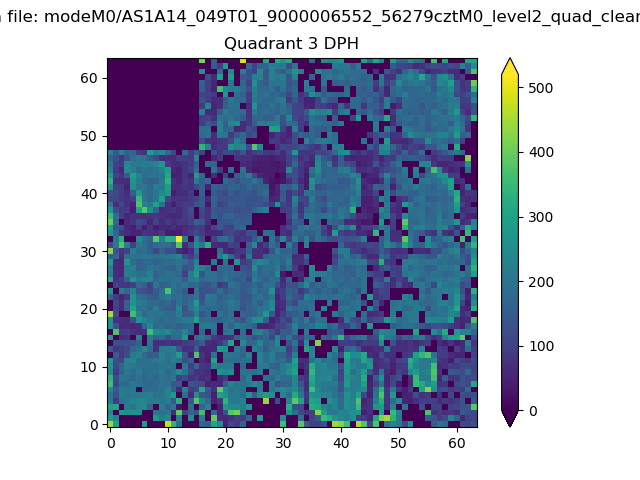 |
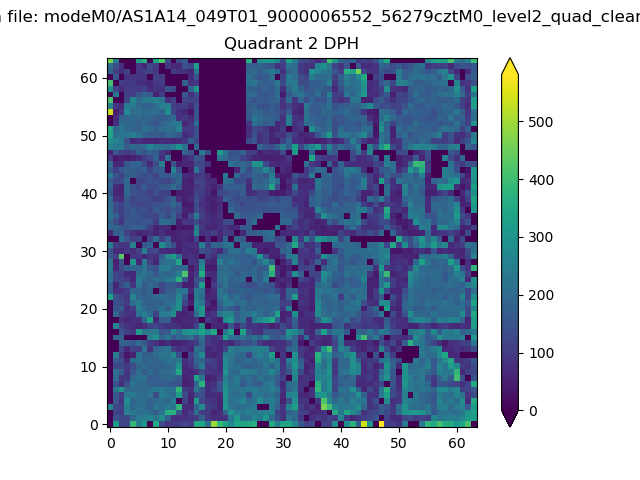 |
Quadrant C |
| Plot type | Count rate plots | Images |
|---|---|---|
| Comparison with Poisson distribution Blue bars denote a histogram of data divided into 1 sec bins. Red curve is a Poisson curve with rate = median count rate of data. |
 |
 |
| Quadrant-wise count rates Data is divided into 100 sec bins |
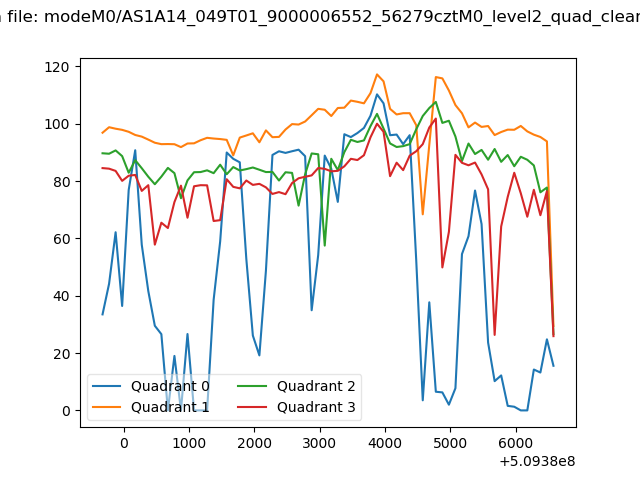 |
|
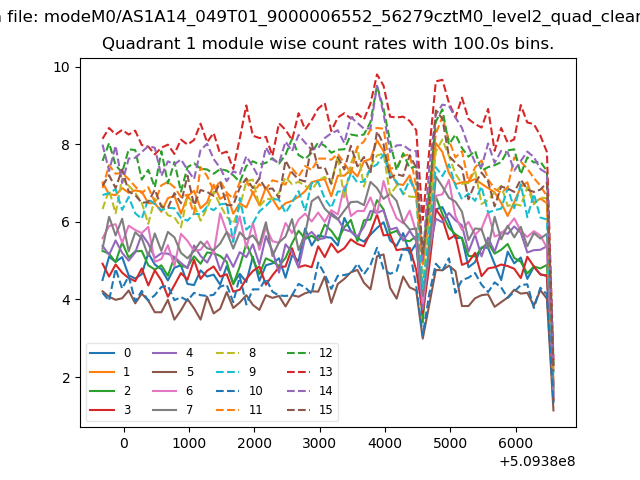
| Module-wise count rates for Quadrant A Data is divided into 100 sec bins |
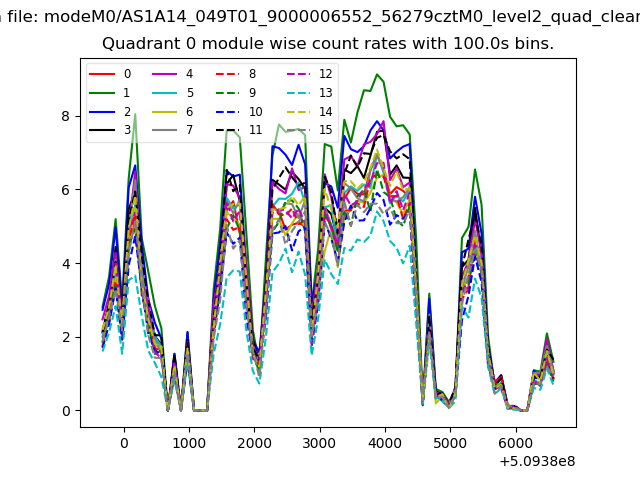 |
 |
| Module-wise count rates for Quadrant B Data is divided into 100 sec bins |
 |
 |
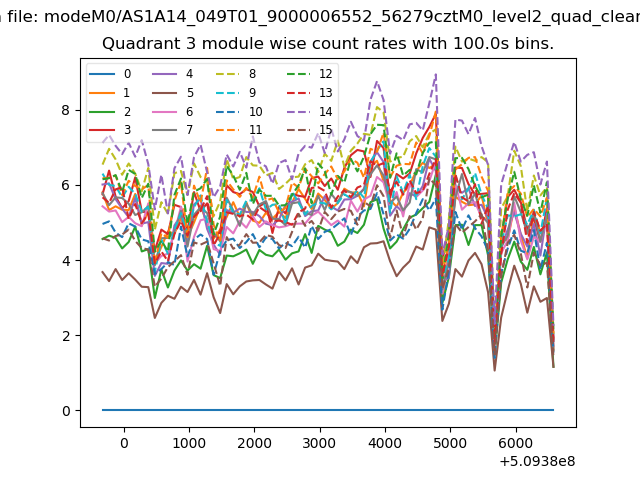
| Module-wise count rates for Quadrant C Data is divided into 100 sec bins |
 |
 |
| Module-wise count rates for Quadrant D Data is divided into 100 sec bins |
 |
 |
| Parameter | Plot |
|---|---|
| CZT HV Monitor |  |
| D_VDD |  |
| Temperature 1 | 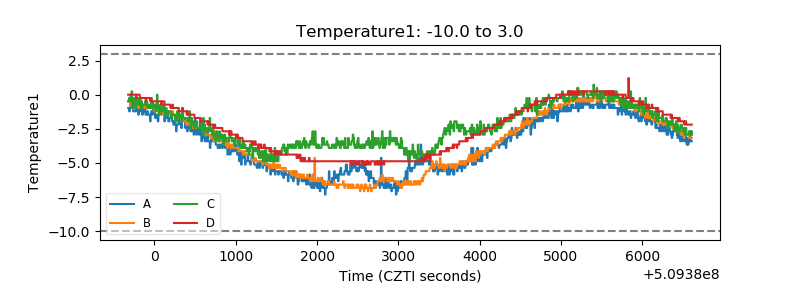 |
| Veto HV Monitor | 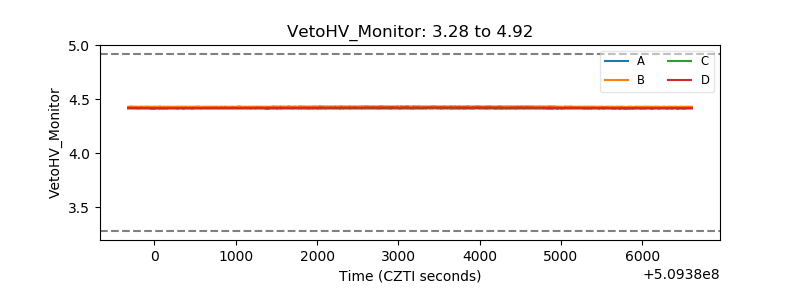 |
| Veto LLD |  |
| Alpha Counter |  |
| _CPM_Rate |  |
| CZT Counter | 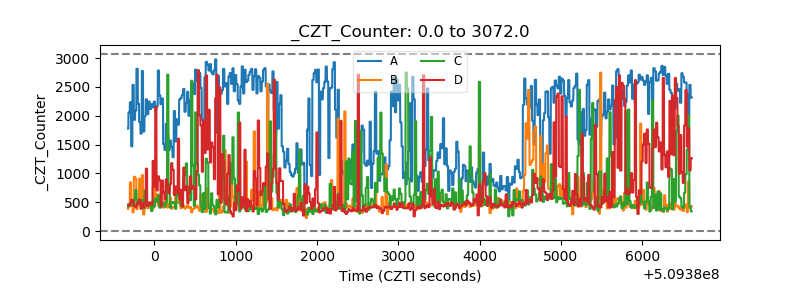 |
| +2.5 Volts monitor | 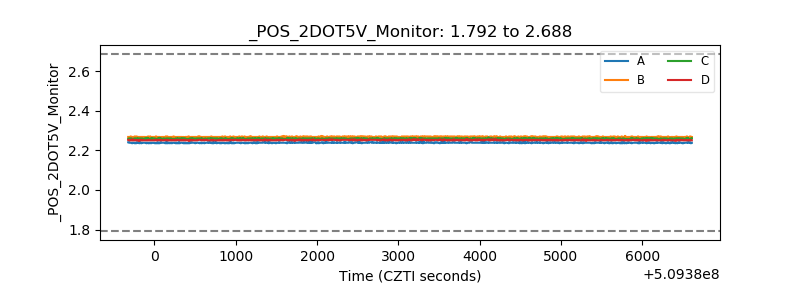 |
| +5 Volts monitor |  |
| _ROLL_ROT | 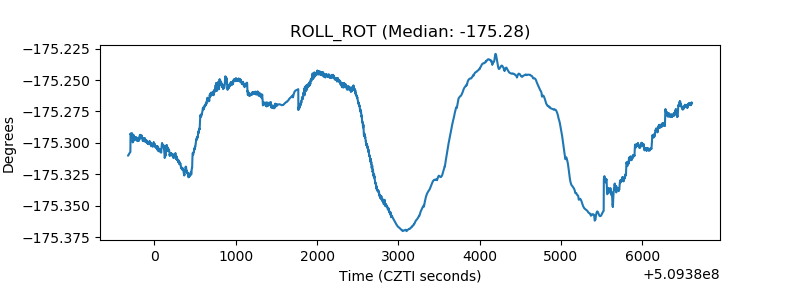 |
| _Roll_DEC | 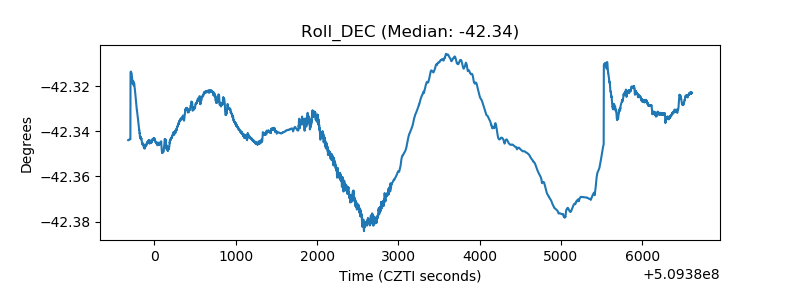 |
| _Roll_RA | 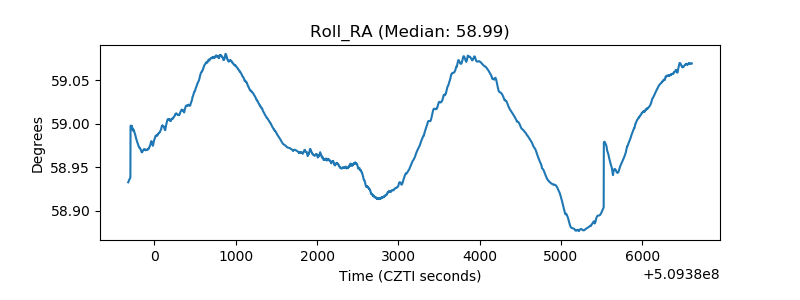 |
| Veto Counter | 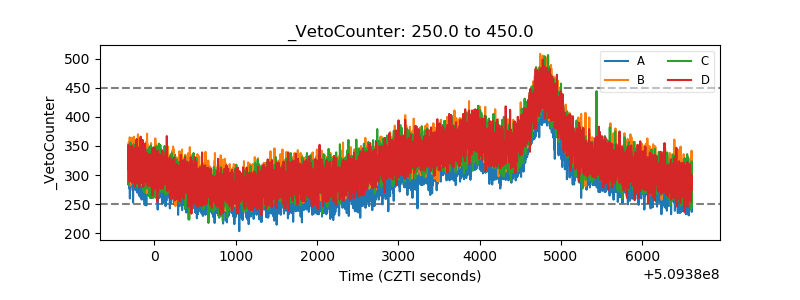 |