| Param | Original file | Final file |
|---|---|---|
| Filename | modeM0/AS1A14_049T01_9000006552_56280cztM0_level2.fits | modeM0/AS1A14_049T01_9000006552_56280cztM0_level2_quad_clean.evt |
| Size (bytes) | 728,648,640 | 93,689,280 |
| Size | 694.9 MB | 89.3 MB |
| Events in quadrant A | 12,157,339 | 410,218 |
| Events in quadrant B | 3,866,048 | 712,823 |
| Events in quadrant C | 4,386,076 | 632,768 |
| Events in quadrant D | 6,002,143 | 577,023 |
| Mode SS | |||
|---|---|---|---|
| Quadrant | BADHDUFLAG | Total packets | Discarded packets |
| A | 0 | 144 | 0 |
| B | 0 | 144 | 0 |
| C | 0 | 144 | 0 |
| D | 0 | 144 | 0 |
| Mode M0 | |||
|---|---|---|---|
| Quadrant | BADHDUFLAG | Total packets | Discarded packets |
| A | 0 | 41239 | 0 |
| B | 0 | 16760 | 0 |
| C | 0 | 18176 | 0 |
| D | 0 | 22967 | 2 |
| Quadrant | Total seconds | Saturated seconds | Saturation percentage |
|---|---|---|---|
| A | 7236 | 3052 | 42.177999% |
| B | 7236 | 137 | 1.893311% |
| C | 7236 | 171 | 2.363184% |
| D | 7235 | 398 | 5.501037% |
Noise dominated data is calculated using 1-second bins in cleaned event files. If a bin has >2000 counts, and if more than 50% of those come from <1% of pixels, then it is considered to be noise-dominated and hence unusable.
| Quadrant | # 1 sec bins | Bins with >0 counts | Bins with >2000 counts | High rate bins dominated by noise | Noise dominated (total time) | Noise dominated (detector-on time) | Marked lightcurve |
|---|---|---|---|---|---|---|---|
| A | 7236 | 7236 | 3120 | 3120 | 43.12% | 43.12% | 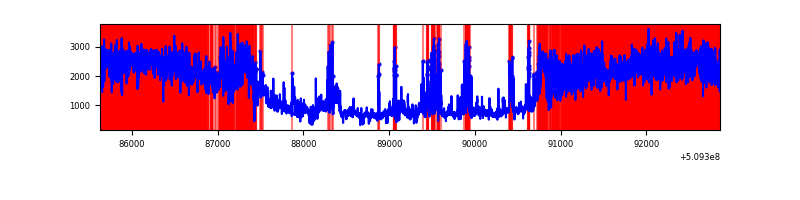 |
| B | 7236 | 7236 | 105 | 105 | 1.45% | 1.45% |  |
| C | 7236 | 7236 | 175 | 175 | 2.42% | 2.42% | 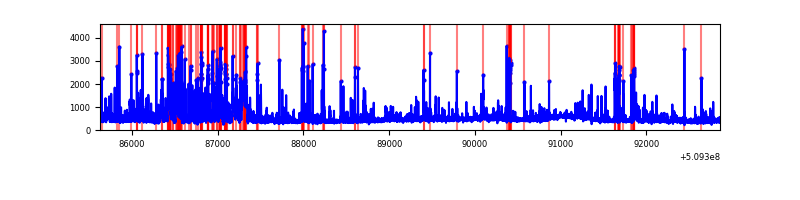 |
| D | 7235 | 7235 | 442 | 442 | 6.11% | 6.11% | 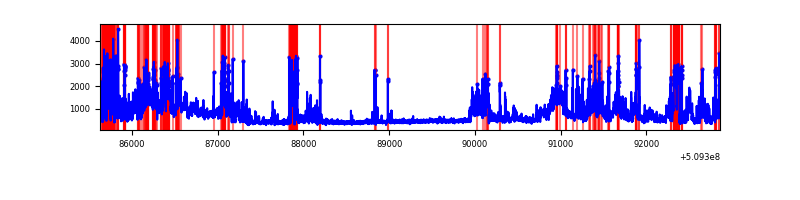 |
Top three noisy pixels from each quadrant. If the there are fewer than three noisy pixels in the level2.evt file, extra rows are filled as -1
| Pixel properties | Quadrant properties | ||||||
|---|---|---|---|---|---|---|---|
| Quadrant | DetID | PixID | Counts | Sigma | Mean | Median | Sigma |
| A | 8 | 176 | 5437492 | 32950.23 | 644 | 627 | 165.0 |
| A | 15 | 32 | 2405269 | 14573.38 | 644 | 627 | 165.0 |
| A | 3 | 14 | 867952 | 5256.44 | 644 | 627 | 165.0 |
| B | 5 | 185 | 270043 | 1700.59 | 747 | 722 | 158.4 |
| B | 0 | 231 | 140643 | 883.51 | 747 | 722 | 158.4 |
| B | 0 | 171 | 63119 | 394.0 | 747 | 722 | 158.4 |
| C | 12 | 254 | 465389 | 2320.65 | 724 | 720 | 200.2 |
| C | 12 | 252 | 297299 | 1481.17 | 724 | 720 | 200.2 |
| C | 5 | 250 | 260891 | 1299.34 | 724 | 720 | 200.2 |
| D | 2 | 249 | 772481 | 3780.88 | 711 | 681 | 204.1 |
| D | 7 | 77 | 726060 | 3553.47 | 711 | 681 | 204.1 |
| D | 11 | 129 | 420183 | 2055.05 | 711 | 681 | 204.1 |
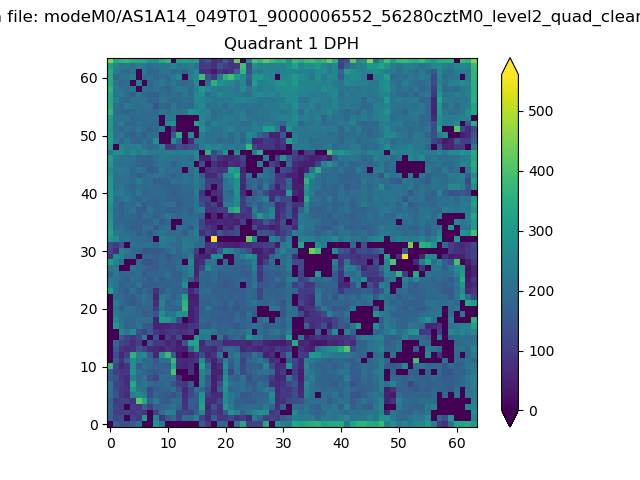
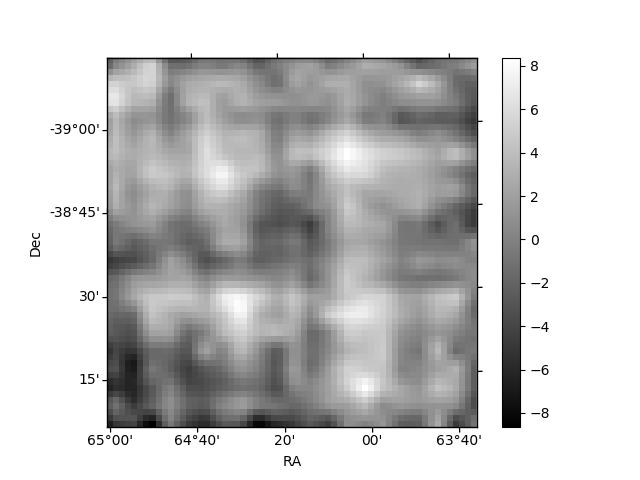
Histogram calculated using DETX and DETY for each event in the final _common_clean file
| Quadrant A | 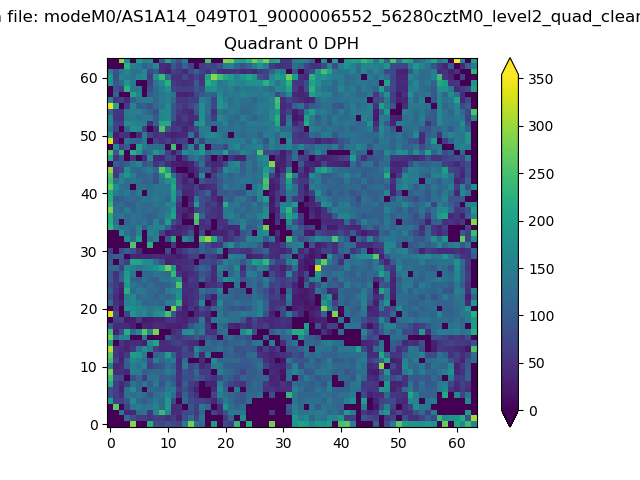 |
 |
Quadrant B |
|---|---|---|---|
| Quadrant D |  |
 |
Quadrant C |
| Plot type | Count rate plots | Images |
|---|---|---|
| Comparison with Poisson distribution Blue bars denote a histogram of data divided into 1 sec bins. Red curve is a Poisson curve with rate = median count rate of data. |
 |
 |
| Quadrant-wise count rates Data is divided into 100 sec bins |
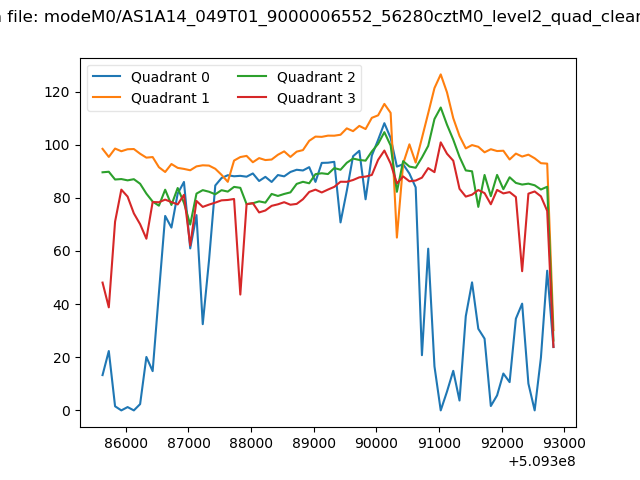 |
|
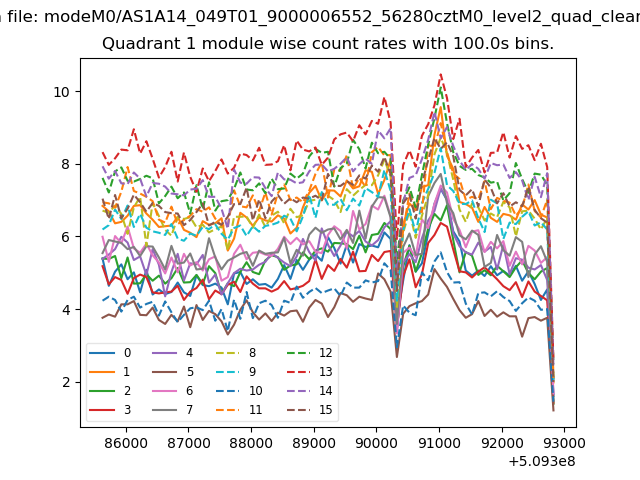
| Module-wise count rates for Quadrant A Data is divided into 100 sec bins |
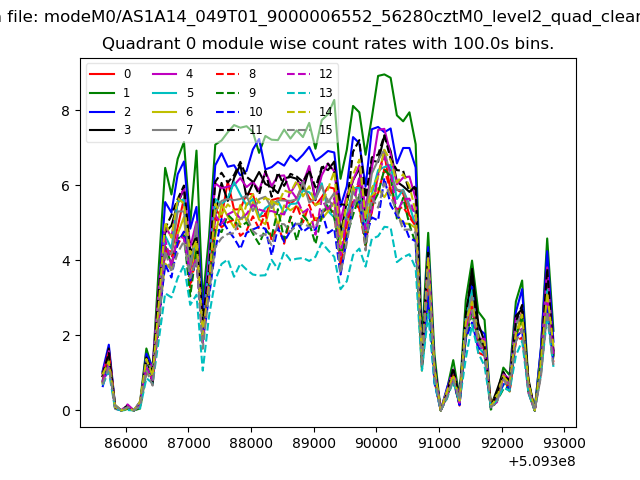 |
 |
| Module-wise count rates for Quadrant B Data is divided into 100 sec bins |
 |
 |
| Module-wise count rates for Quadrant C Data is divided into 100 sec bins |
 |
 |
| Module-wise count rates for Quadrant D Data is divided into 100 sec bins |
 |
 |
| Parameter | Plot |
|---|---|
| CZT HV Monitor | 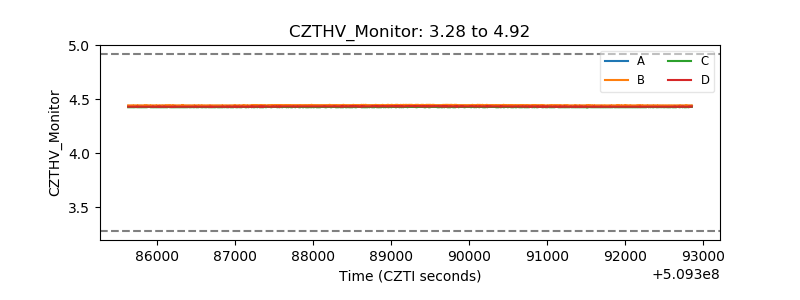 |
| D_VDD |  |
| Temperature 1 | 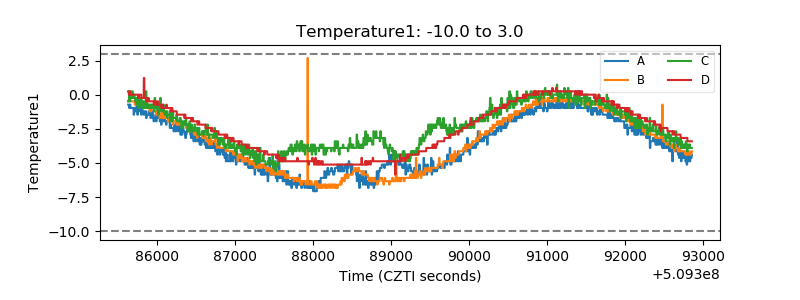 |
| Veto HV Monitor |  |
| Veto LLD | 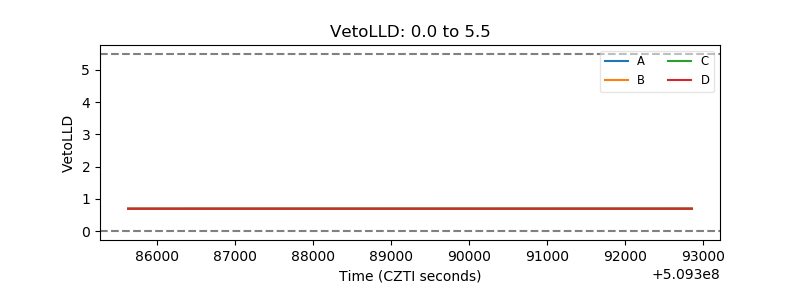 |
| Alpha Counter | 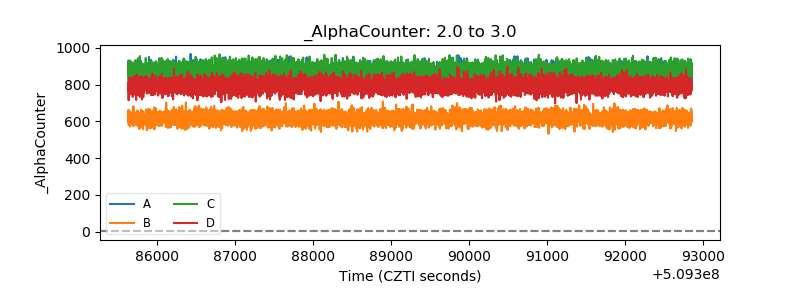 |
| _CPM_Rate |  |
| CZT Counter | 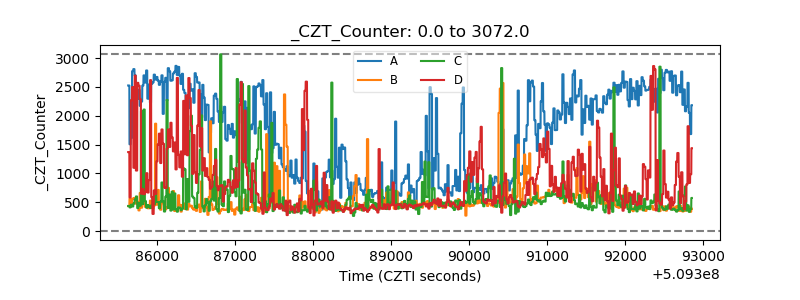 |
| +2.5 Volts monitor | 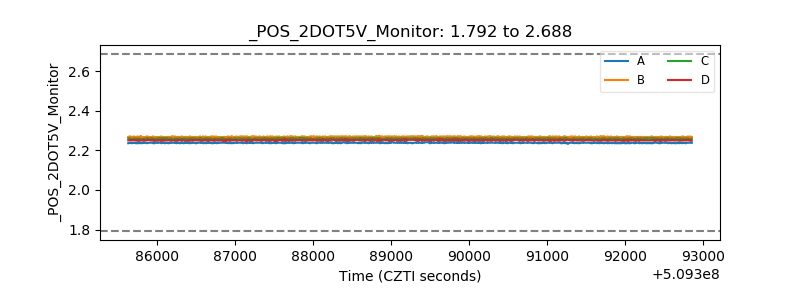 |
| +5 Volts monitor | 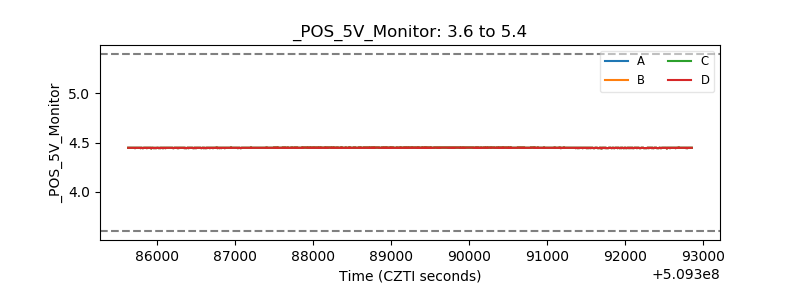 |
| _ROLL_ROT | 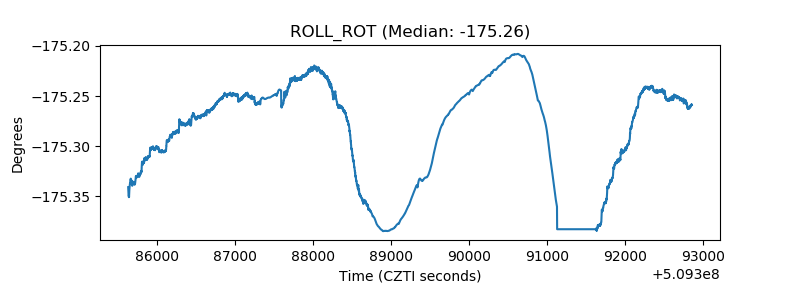 |
| _Roll_DEC | 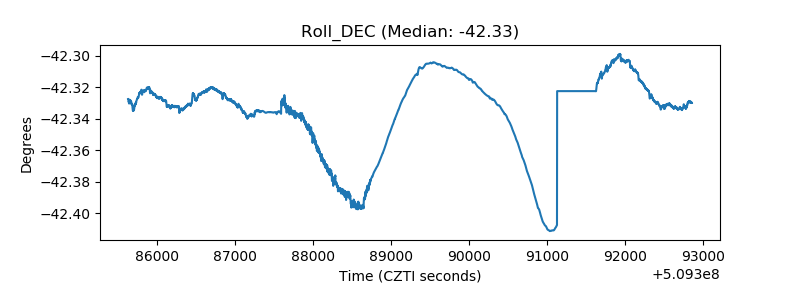 |
| _Roll_RA |  |
| Veto Counter |  |