| Param | Original file | Final file |
|---|---|---|
| Filename | modeM0/AS1A14_049T01_9000006552_56283cztM0_level2.fits | modeM0/AS1A14_049T01_9000006552_56283cztM0_level2_quad_clean.evt |
| Size (bytes) | 2,155,861,440 | 178,289,280 |
| Size | 2.0 GB | 170.0 MB |
| Events in quadrant A | 34,635,672 | 607,249 |
| Events in quadrant B | 12,753,839 | 1,322,756 |
| Events in quadrant C | 16,844,576 | 1,063,588 |
| Events in quadrant D | 14,131,220 | 1,118,988 |
| Mode SS | |||
|---|---|---|---|
| Quadrant | BADHDUFLAG | Total packets | Discarded packets |
| A | 0 | 378 | 0 |
| B | 0 | 378 | 0 |
| C | 0 | 378 | 0 |
| D | 0 | 378 | 0 |
| Mode M9 | |||
|---|---|---|---|
| Quadrant | BADHDUFLAG | Total packets | Discarded packets |
| A | 0 | 14 | 0 |
| B | 0 | 14 | 0 |
| C | 0 | 14 | 0 |
| D | 0 | 14 | 0 |
| Mode M0 | |||
|---|---|---|---|
| Quadrant | BADHDUFLAG | Total packets | Discarded packets |
| A | 0 | 116076 | 3 |
| B | 0 | 51224 | 3 |
| C | 0 | 63418 | 3 |
| D | 0 | 55052 | 3 |
| Quadrant | Total seconds | Saturated seconds | Saturation percentage |
|---|---|---|---|
| A | 18630 | 10907 | 58.545357% |
| B | 18630 | 1388 | 7.450349% |
| C | 18630 | 3501 | 18.792271% |
| D | 18631 | 1317 | 7.068864% |
Noise dominated data is calculated using 1-second bins in cleaned event files. If a bin has >2000 counts, and if more than 50% of those come from <1% of pixels, then it is considered to be noise-dominated and hence unusable.
| Quadrant | # 1 sec bins | Bins with >0 counts | Bins with >2000 counts | High rate bins dominated by noise | Noise dominated (total time) | Noise dominated (detector-on time) | Marked lightcurve |
|---|---|---|---|---|---|---|---|
| A | 20302 | 18764 | 10072 | 10072 | 49.61% | 53.68% |  |
| B | 20303 | 18916 | 1147 | 1147 | 5.65% | 6.06% |  |
| C | 20303 | 18915 | 2930 | 2930 | 14.43% | 15.49% | 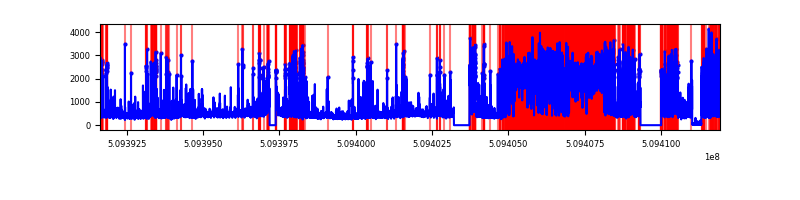 |
| D | 20304 | 18916 | 1298 | 1298 | 6.39% | 6.86% |  |
Top three noisy pixels from each quadrant. If the there are fewer than three noisy pixels in the level2.evt file, extra rows are filled as -1
| Pixel properties | Quadrant properties | ||||||
|---|---|---|---|---|---|---|---|
| Quadrant | DetID | PixID | Counts | Sigma | Mean | Median | Sigma |
| A | 15 | 32 | 18502841 | 58452.3 | 1251 | 1220 | 316.5 |
| A | 8 | 176 | 7542420 | 23824.97 | 1251 | 1220 | 316.5 |
| A | 0 | 8 | 913324 | 2881.62 | 1251 | 1220 | 316.5 |
| B | 4 | 206 | 3247213 | 8159.81 | 1874 | 1807 | 397.7 |
| B | 5 | 185 | 673513 | 1688.85 | 1874 | 1807 | 397.7 |
| B | 0 | 171 | 195254 | 486.38 | 1874 | 1807 | 397.7 |
| C | 12 | 254 | 5817645 | 12643.26 | 1670 | 1655 | 460.0 |
| C | 5 | 250 | 2399941 | 5213.58 | 1670 | 1655 | 460.0 |
| C | 12 | 252 | 655890 | 1422.23 | 1670 | 1655 | 460.0 |
| D | 2 | 249 | 2187124 | 4270.91 | 1798 | 1718 | 511.7 |
| D | 11 | 129 | 1647322 | 3215.98 | 1798 | 1718 | 511.7 |
| D | 5 | 32 | 785214 | 1531.17 | 1798 | 1718 | 511.7 |
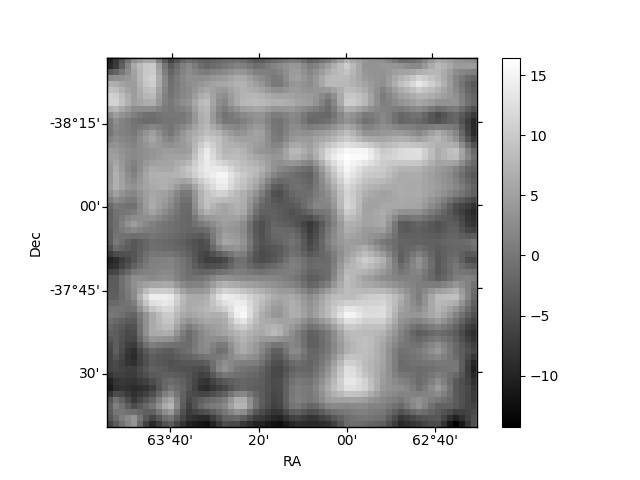
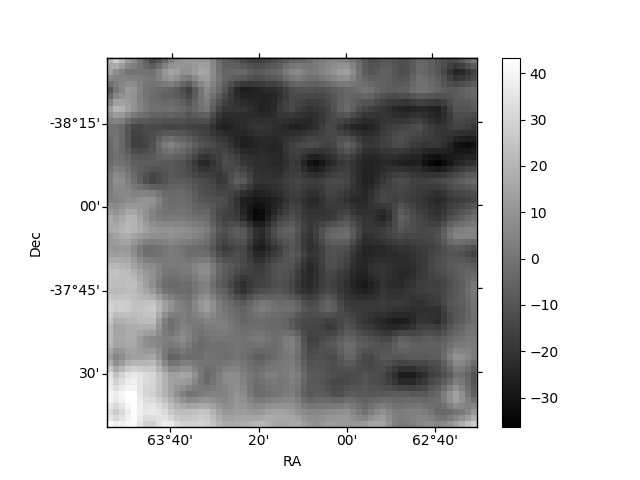
Histogram calculated using DETX and DETY for each event in the final _common_clean file
| Quadrant A | 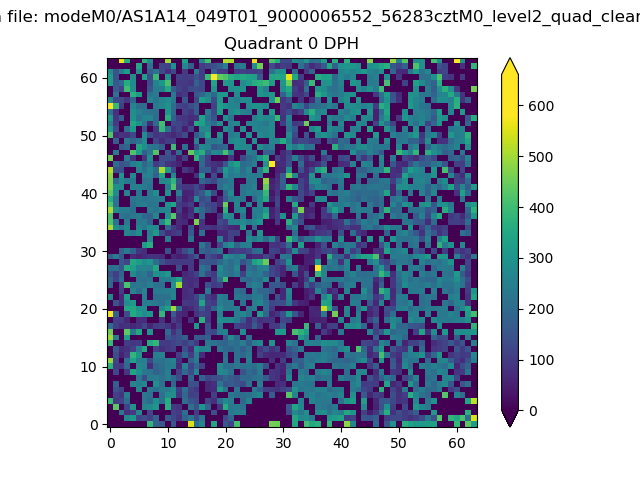 |
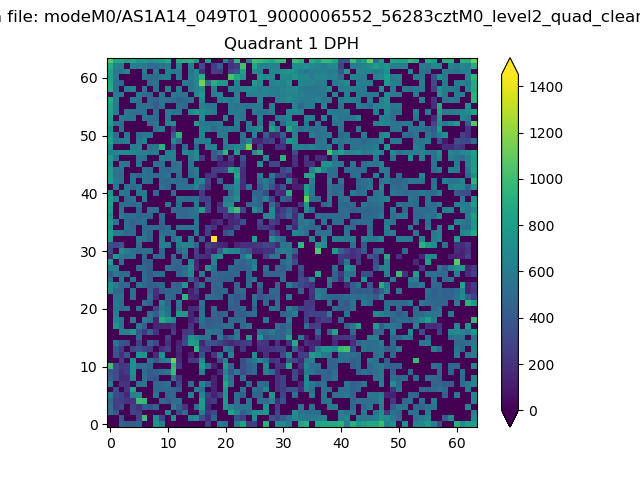 |
Quadrant B |
|---|---|---|---|
| Quadrant D |  |
 |
Quadrant C |
| Plot type | Count rate plots | Images |
|---|---|---|
| Comparison with Poisson distribution Blue bars denote a histogram of data divided into 1 sec bins. Red curve is a Poisson curve with rate = median count rate of data. |
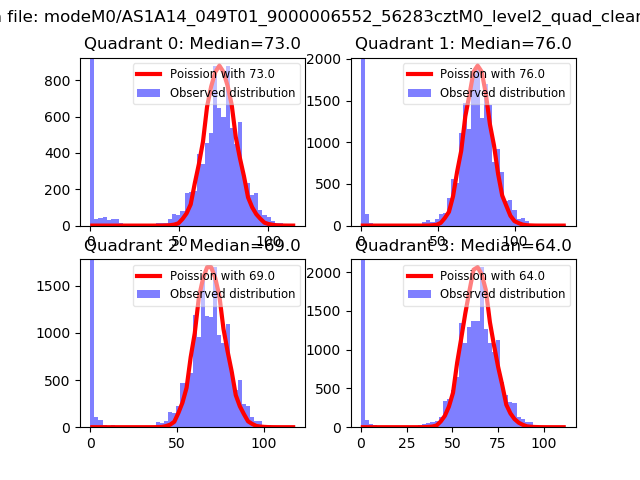 |
 |
| Quadrant-wise count rates Data is divided into 100 sec bins |
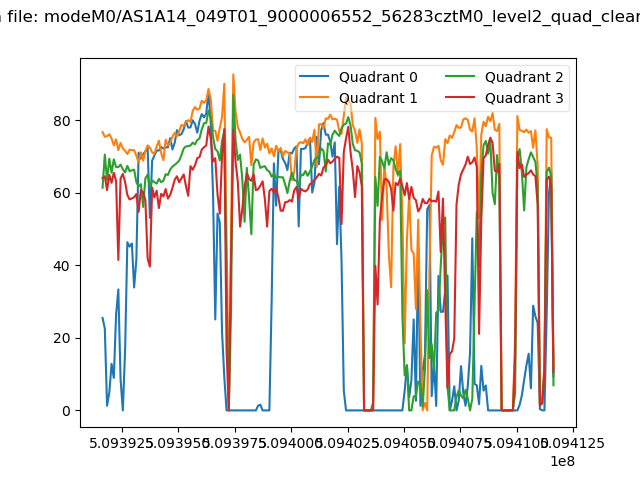 |
|
| Module-wise count rates for Quadrant A Data is divided into 100 sec bins |
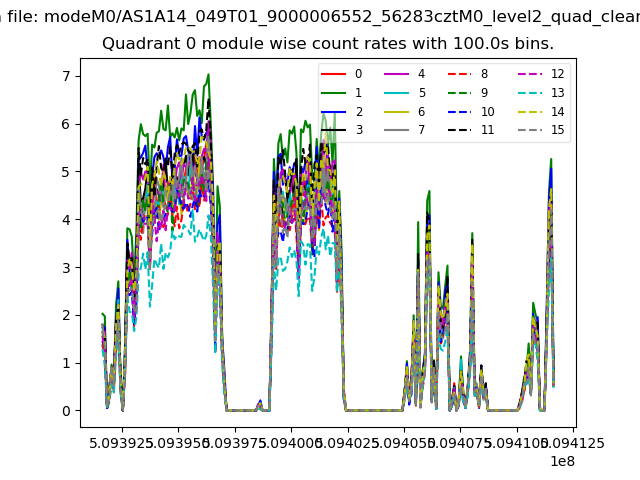 |
 |
| Module-wise count rates for Quadrant B Data is divided into 100 sec bins |
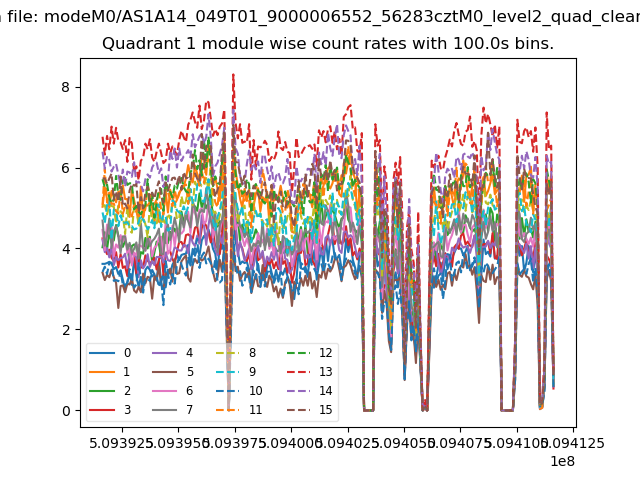 |
 |
| Module-wise count rates for Quadrant C Data is divided into 100 sec bins |
 |
 |
| Module-wise count rates for Quadrant D Data is divided into 100 sec bins |
 |
 |
| Parameter | Plot |
|---|---|
| CZT HV Monitor |  |
| D_VDD |  |
| Temperature 1 | 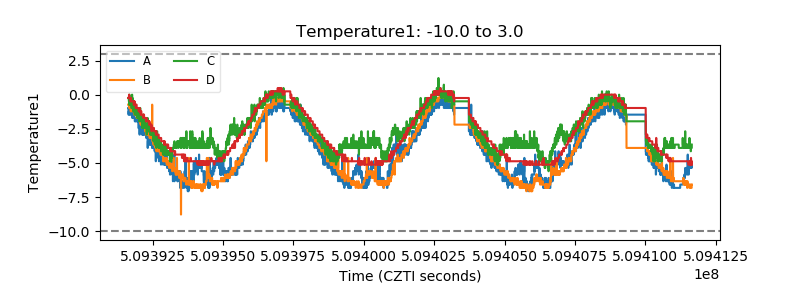 |
| Veto HV Monitor | 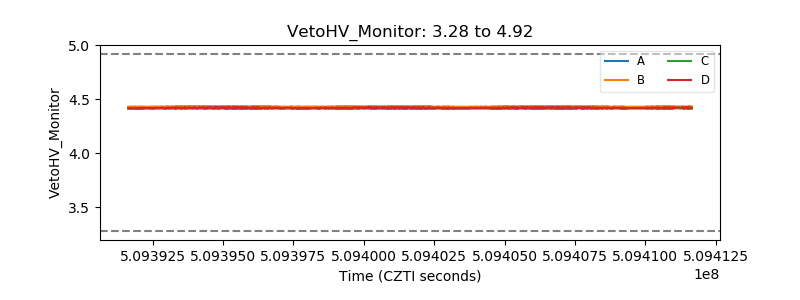 |
| Veto LLD | 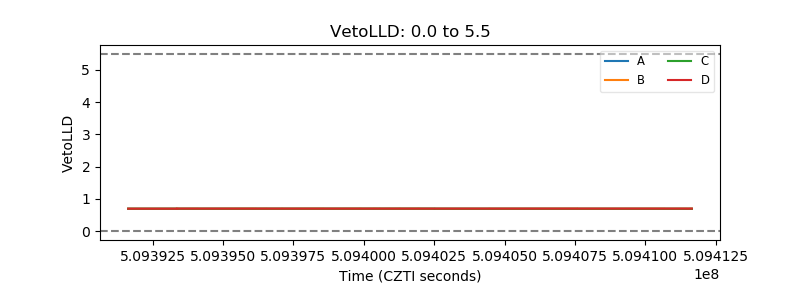 |
| Alpha Counter |  |
| _CPM_Rate | 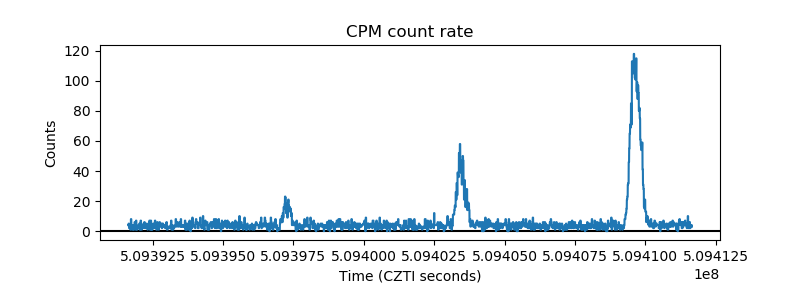 |
| CZT Counter | 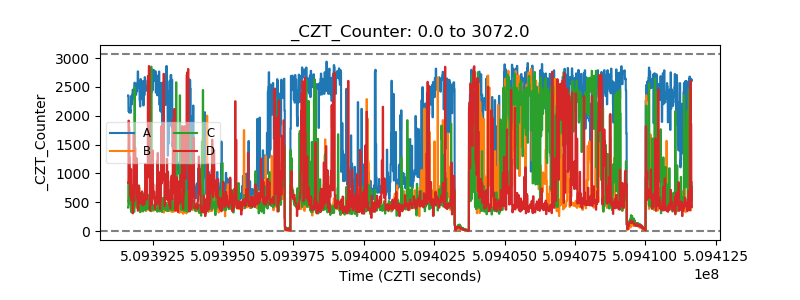 |
| +2.5 Volts monitor |  |
| +5 Volts monitor |  |
| _ROLL_ROT | 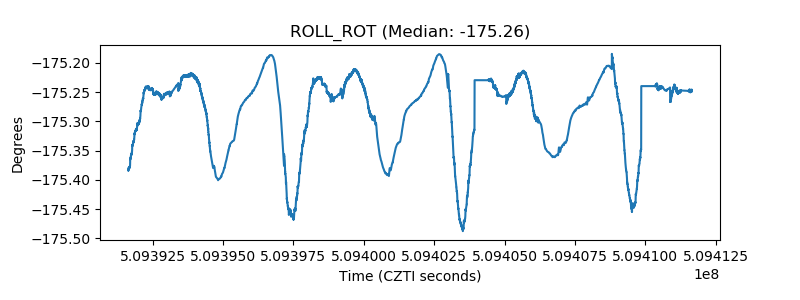 |
| _Roll_DEC | 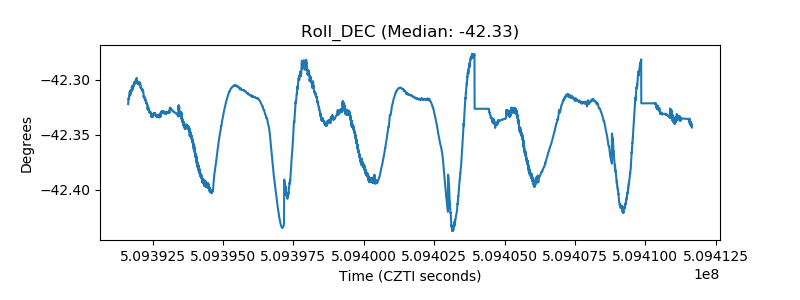 |
| _Roll_RA |  |
| Veto Counter | 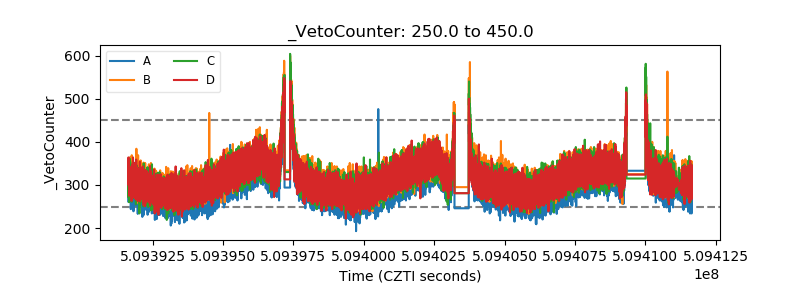 |