| Param | Original file | Final file |
|---|---|---|
| Filename | modeM0/AS1A14_049T01_9000006552_56284cztM0_level2.fits | modeM0/AS1A14_049T01_9000006552_56284cztM0_level2_quad_clean.evt |
| Size (bytes) | 765,685,440 | 70,369,920 |
| Size | 730.2 MB | 67.1 MB |
| Events in quadrant A | 14,965,645 | 151,668 |
| Events in quadrant B | 3,528,421 | 556,218 |
| Events in quadrant C | 5,532,772 | 478,424 |
| Events in quadrant D | 3,798,307 | 478,437 |
| Mode SS | |||
|---|---|---|---|
| Quadrant | BADHDUFLAG | Total packets | Discarded packets |
| A | 0 | 136 | 0 |
| B | 0 | 136 | 0 |
| C | 0 | 136 | 0 |
| D | 0 | 136 | 0 |
| Mode M9 | |||
|---|---|---|---|
| Quadrant | BADHDUFLAG | Total packets | Discarded packets |
| A | 0 | 9 | 0 |
| B | 0 | 9 | 0 |
| C | 0 | 9 | 0 |
| D | 0 | 9 | 0 |
| Mode M0 | |||
|---|---|---|---|
| Quadrant | BADHDUFLAG | Total packets | Discarded packets |
| A | 0 | 49029 | 1 |
| B | 0 | 15304 | 1 |
| C | 0 | 21186 | 1 |
| D | 0 | 16109 | 1 |
| Quadrant | Total seconds | Saturated seconds | Saturation percentage |
|---|---|---|---|
| A | 6676 | 4901 | 73.412223% |
| B | 6676 | 172 | 2.576393% |
| C | 6677 | 636 | 9.525236% |
| D | 6677 | 144 | 2.156657% |
Noise dominated data is calculated using 1-second bins in cleaned event files. If a bin has >2000 counts, and if more than 50% of those come from <1% of pixels, then it is considered to be noise-dominated and hence unusable.
| Quadrant | # 1 sec bins | Bins with >0 counts | Bins with >2000 counts | High rate bins dominated by noise | Noise dominated (total time) | Noise dominated (detector-on time) | Marked lightcurve |
|---|---|---|---|---|---|---|---|
| A | 7824 | 6811 | 4783 | 4783 | 61.13% | 70.22% |  |
| B | 7824 | 6960 | 113 | 113 | 1.44% | 1.62% | 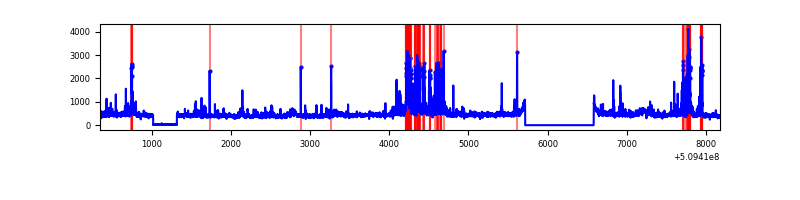 |
| C | 7825 | 6960 | 550 | 550 | 7.03% | 7.90% | 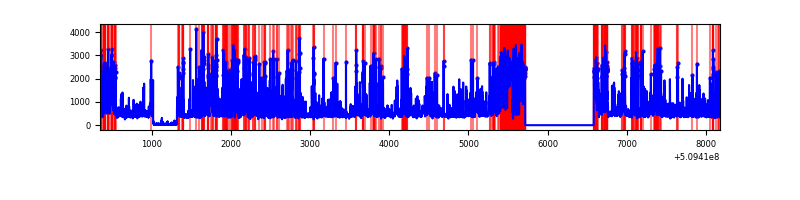 |
| D | 7825 | 6961 | 143 | 143 | 1.83% | 2.05% |  |
Top three noisy pixels from each quadrant. If the there are fewer than three noisy pixels in the level2.evt file, extra rows are filled as -1
| Pixel properties | Quadrant properties | ||||||
|---|---|---|---|---|---|---|---|
| Quadrant | DetID | PixID | Counts | Sigma | Mean | Median | Sigma |
| A | 15 | 32 | 8358243 | 76345.99 | 432 | 421 | 109.5 |
| A | 8 | 176 | 2952941 | 26970.31 | 432 | 421 | 109.5 |
| A | 12 | 115 | 774279 | 7068.94 | 432 | 421 | 109.5 |
| B | 5 | 185 | 469614 | 3150.56 | 686 | 661 | 148.8 |
| B | 0 | 63 | 68416 | 455.2 | 686 | 661 | 148.8 |
| B | 0 | 213 | 60239 | 400.26 | 686 | 661 | 148.8 |
| C | 5 | 250 | 1605547 | 9053.47 | 641 | 635 | 177.3 |
| C | 12 | 254 | 819824 | 4621.13 | 641 | 635 | 177.3 |
| C | 12 | 252 | 299694 | 1687.02 | 641 | 635 | 177.3 |
| D | 2 | 249 | 468214 | 2482.1 | 664 | 637 | 188.4 |
| D | 7 | 77 | 143127 | 756.4 | 664 | 637 | 188.4 |
| D | 8 | 129 | 92086 | 485.45 | 664 | 637 | 188.4 |
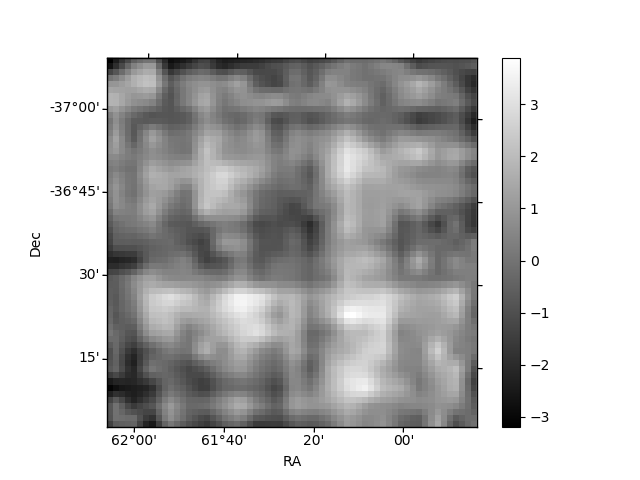
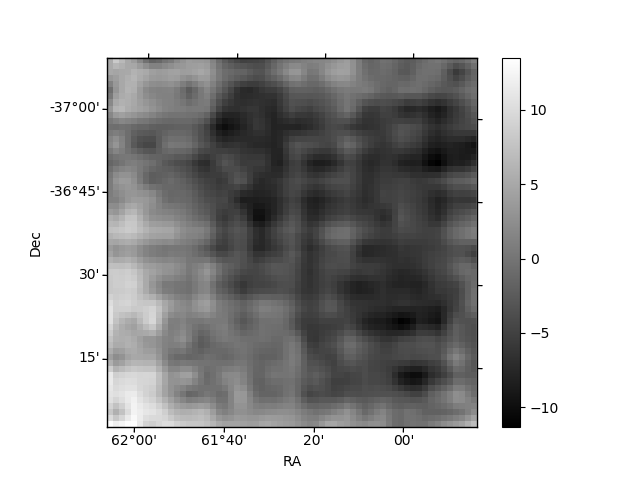
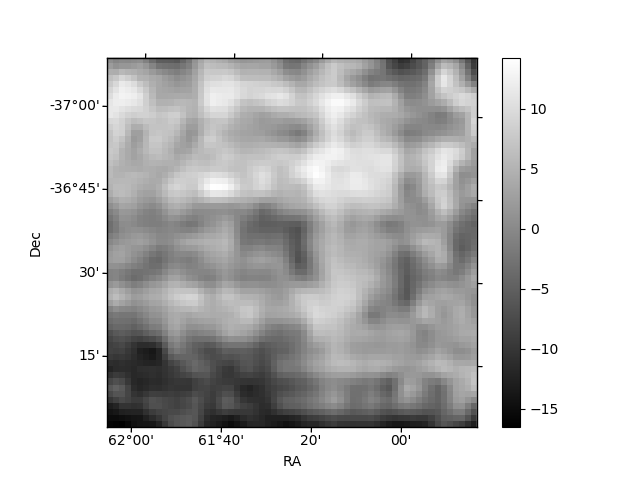
Histogram calculated using DETX and DETY for each event in the final _common_clean file
| Quadrant A | 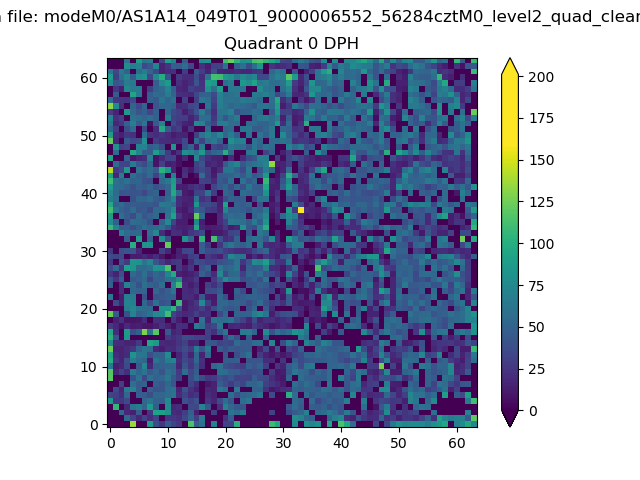 |
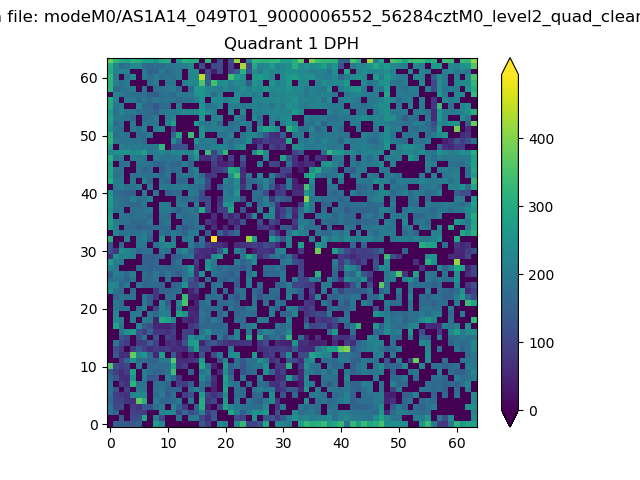 |
Quadrant B |
|---|---|---|---|
| Quadrant D | 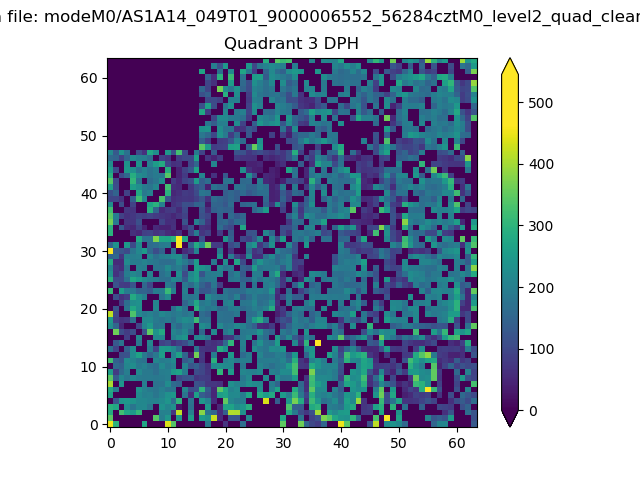 |
 |
Quadrant C |
| Plot type | Count rate plots | Images |
|---|---|---|
| Comparison with Poisson distribution Blue bars denote a histogram of data divided into 1 sec bins. Red curve is a Poisson curve with rate = median count rate of data. |
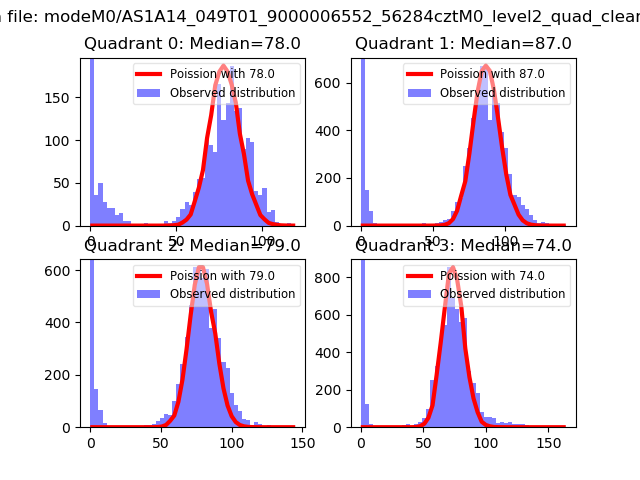 |
 |
| Quadrant-wise count rates Data is divided into 100 sec bins |
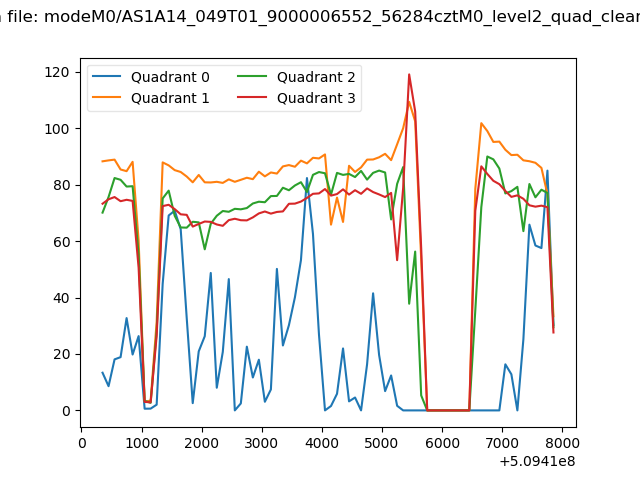 |
|
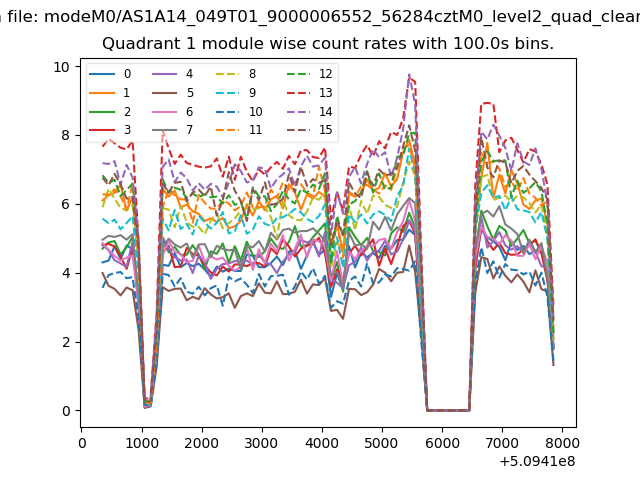
| Module-wise count rates for Quadrant A Data is divided into 100 sec bins |
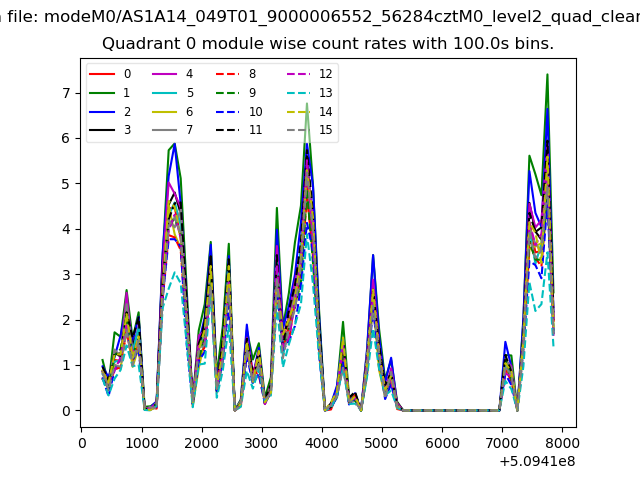 |
 |
| Module-wise count rates for Quadrant B Data is divided into 100 sec bins |
 |
 |
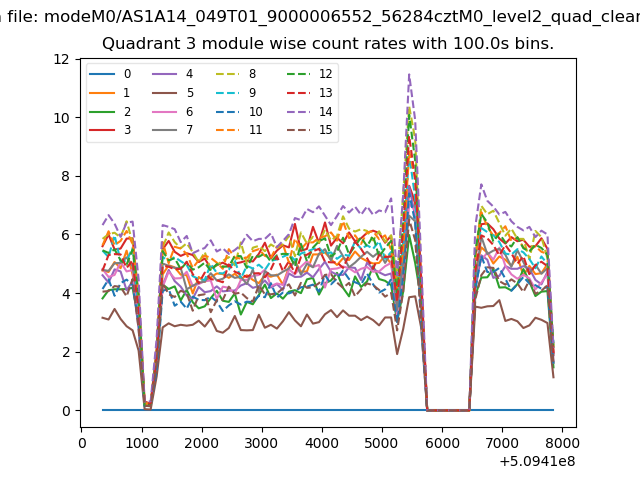
| Module-wise count rates for Quadrant C Data is divided into 100 sec bins |
 |
 |
| Module-wise count rates for Quadrant D Data is divided into 100 sec bins |
 |
 |
| Parameter | Plot |
|---|---|
| CZT HV Monitor |  |
| D_VDD | 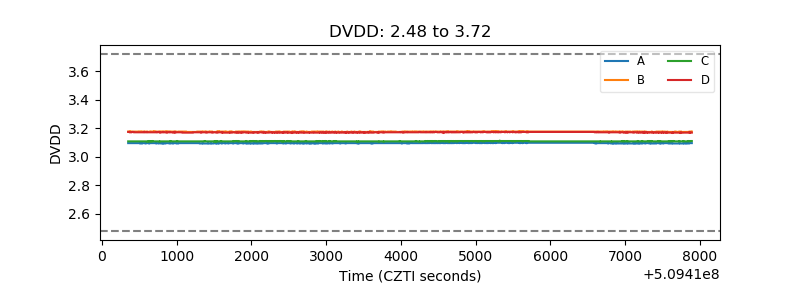 |
| Temperature 1 |  |
| Veto HV Monitor | 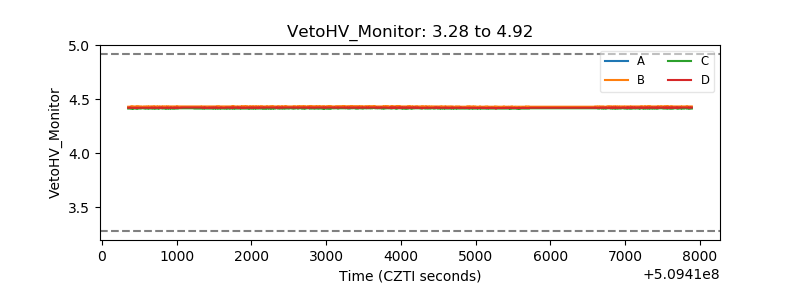 |
| Veto LLD | 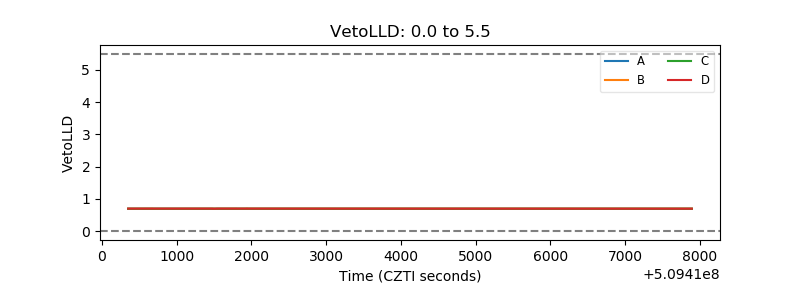 |
| Alpha Counter |  |
| _CPM_Rate | 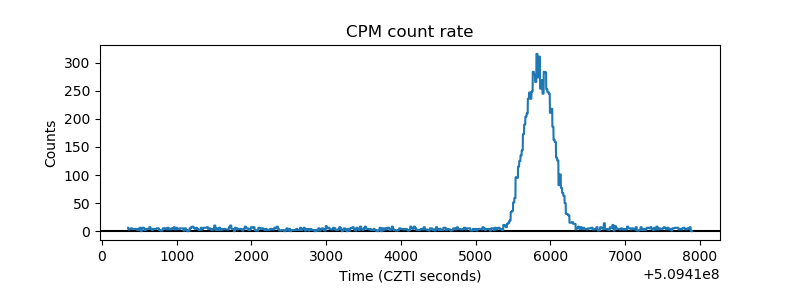 |
| CZT Counter | 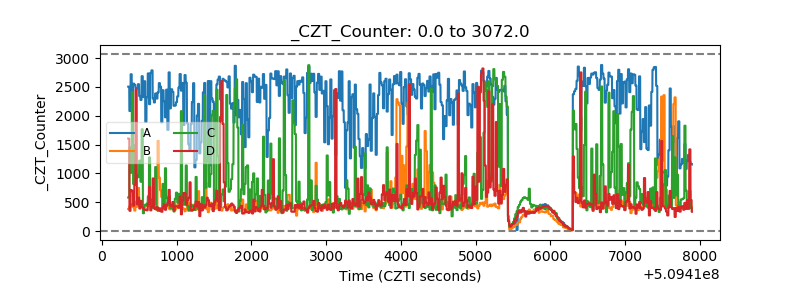 |
| +2.5 Volts monitor |  |
| +5 Volts monitor |  |
| _ROLL_ROT | 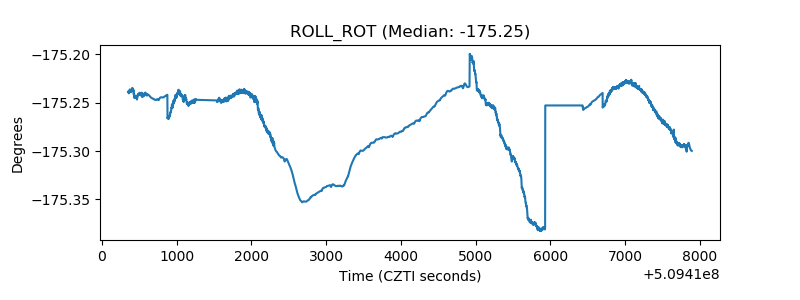 |
| _Roll_DEC | 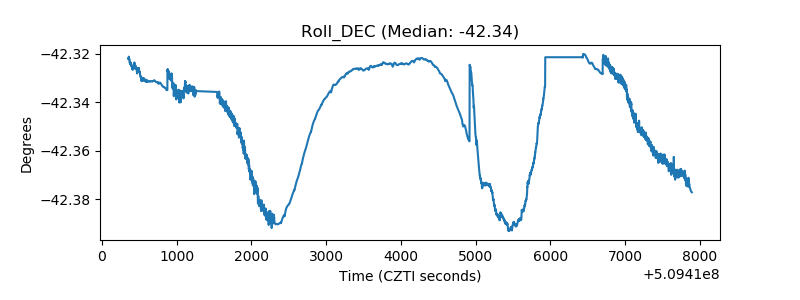 |
| _Roll_RA | 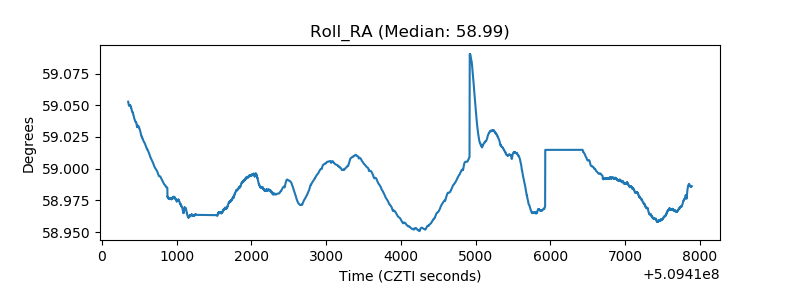 |
| Veto Counter | 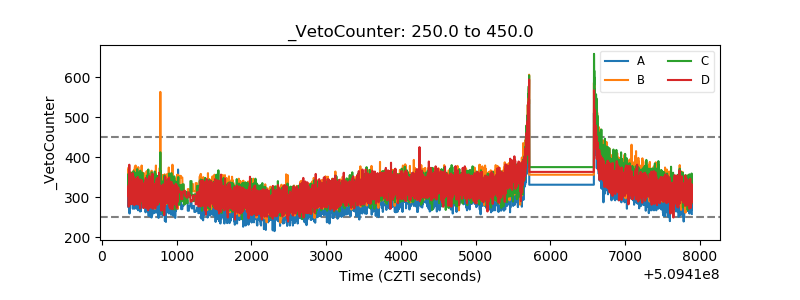 |