| Param | Original file | Final file |
|---|---|---|
| Filename | modeM0/AS1A14_049T01_9000006552_56287cztM0_level2.fits | modeM0/AS1A14_049T01_9000006552_56287cztM0_level2_quad_clean.evt |
| Size (bytes) | 748,523,520 | 81,048,960 |
| Size | 713.8 MB | 77.3 MB |
| Events in quadrant A | 13,295,104 | 259,031 |
| Events in quadrant B | 3,801,100 | 663,548 |
| Events in quadrant C | 5,896,121 | 553,908 |
| Events in quadrant D | 4,217,524 | 528,682 |
| Mode SS | |||
|---|---|---|---|
| Quadrant | BADHDUFLAG | Total packets | Discarded packets |
| A | 0 | 132 | 0 |
| B | 0 | 132 | 0 |
| C | 0 | 132 | 0 |
| D | 0 | 132 | 0 |
| Mode M9 | |||
|---|---|---|---|
| Quadrant | BADHDUFLAG | Total packets | Discarded packets |
| A | 0 | 10 | 0 |
| B | 0 | 10 | 0 |
| C | 0 | 10 | 0 |
| D | 0 | 10 | 0 |
| Mode M0 | |||
|---|---|---|---|
| Quadrant | BADHDUFLAG | Total packets | Discarded packets |
| A | 0 | 43933 | 1 |
| B | 0 | 15749 | 1 |
| C | 0 | 21960 | 3 |
| D | 0 | 17226 | 1 |
| Quadrant | Total seconds | Saturated seconds | Saturation percentage |
|---|---|---|---|
| A | 6426 | 4090 | 63.647681% |
| B | 6426 | 206 | 3.205727% |
| C | 6425 | 639 | 9.945525% |
| D | 6426 | 419 | 6.520386% |
Noise dominated data is calculated using 1-second bins in cleaned event files. If a bin has >2000 counts, and if more than 50% of those come from <1% of pixels, then it is considered to be noise-dominated and hence unusable.
| Quadrant | # 1 sec bins | Bins with >0 counts | Bins with >2000 counts | High rate bins dominated by noise | Noise dominated (total time) | Noise dominated (detector-on time) | Marked lightcurve |
|---|---|---|---|---|---|---|---|
| A | 7481 | 6426 | 4017 | 4017 | 53.70% | 62.51% |  |
| B | 7481 | 6426 | 75 | 75 | 1.00% | 1.17% |  |
| C | 7480 | 6425 | 532 | 532 | 7.11% | 8.28% | 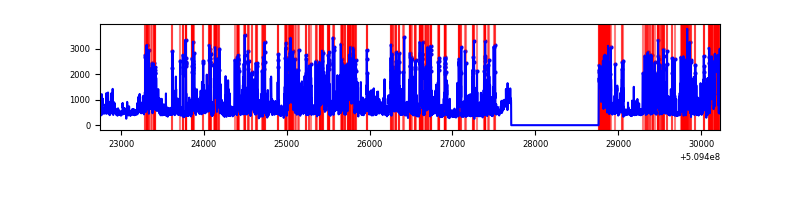 |
| D | 7481 | 6426 | 373 | 373 | 4.99% | 5.80% | 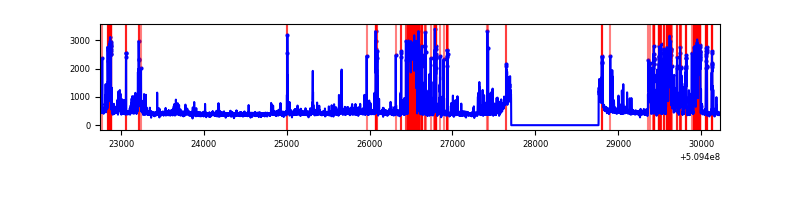 |
Top three noisy pixels from each quadrant. If the there are fewer than three noisy pixels in the level2.evt file, extra rows are filled as -1
| Pixel properties | Quadrant properties | ||||||
|---|---|---|---|---|---|---|---|
| Quadrant | DetID | PixID | Counts | Sigma | Mean | Median | Sigma |
| A | 15 | 32 | 4190351 | 33500.06 | 495 | 482 | 125.1 |
| A | 4 | 95 | 3206662 | 25634.99 | 495 | 482 | 125.1 |
| A | 8 | 176 | 3081876 | 24637.26 | 495 | 482 | 125.1 |
| B | 4 | 206 | 487914 | 3314.25 | 689 | 663 | 147.0 |
| B | 5 | 185 | 314387 | 2133.93 | 689 | 663 | 147.0 |
| B | 8 | 128 | 47476 | 318.42 | 689 | 663 | 147.0 |
| C | 5 | 250 | 2044860 | 11503.66 | 656 | 651 | 177.7 |
| C | 12 | 254 | 676279 | 3802.05 | 656 | 651 | 177.7 |
| C | 12 | 252 | 211372 | 1185.82 | 656 | 651 | 177.7 |
| D | 12 | 31 | 607131 | 3256.27 | 662 | 633 | 186.3 |
| D | 11 | 129 | 346162 | 1855.13 | 662 | 633 | 186.3 |
| D | 2 | 249 | 253262 | 1356.36 | 662 | 633 | 186.3 |
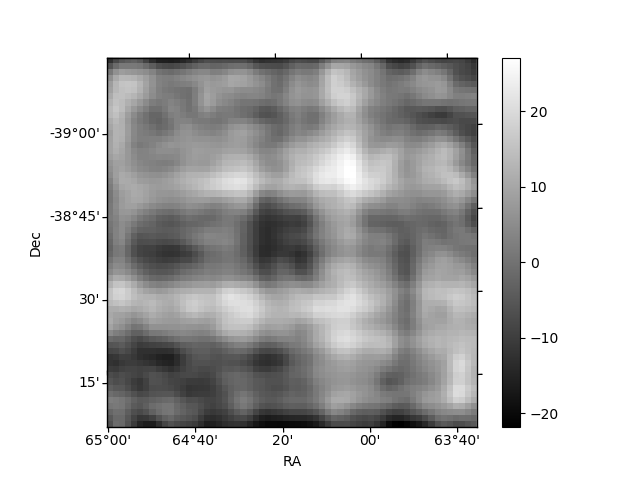
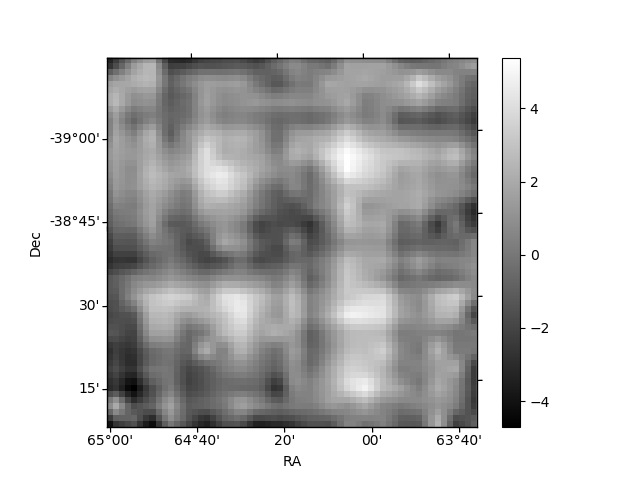
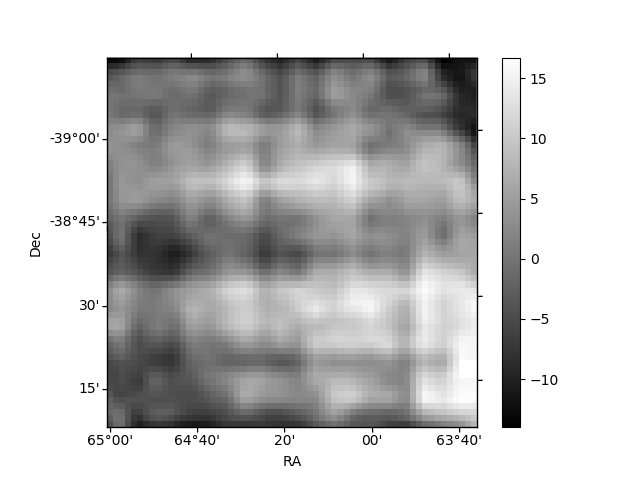
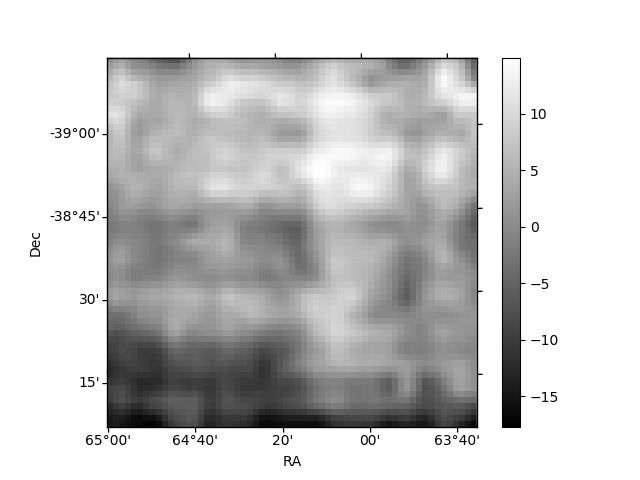
Histogram calculated using DETX and DETY for each event in the final _common_clean file
| Quadrant A |  |
 |
Quadrant B |
|---|---|---|---|
| Quadrant D | 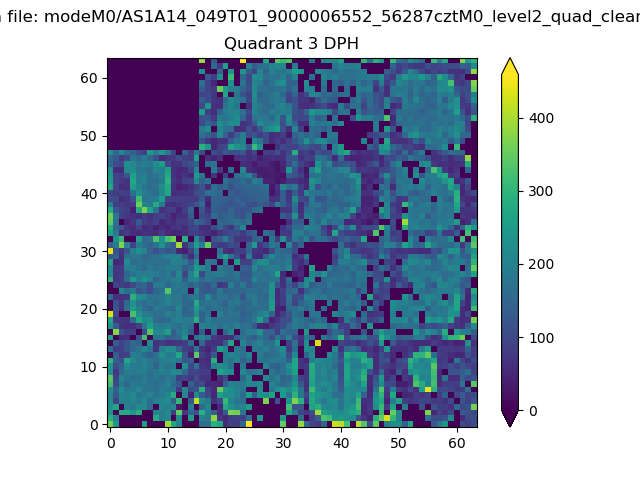 |
 |
Quadrant C |
| Plot type | Count rate plots | Images |
|---|---|---|
| Comparison with Poisson distribution Blue bars denote a histogram of data divided into 1 sec bins. Red curve is a Poisson curve with rate = median count rate of data. |
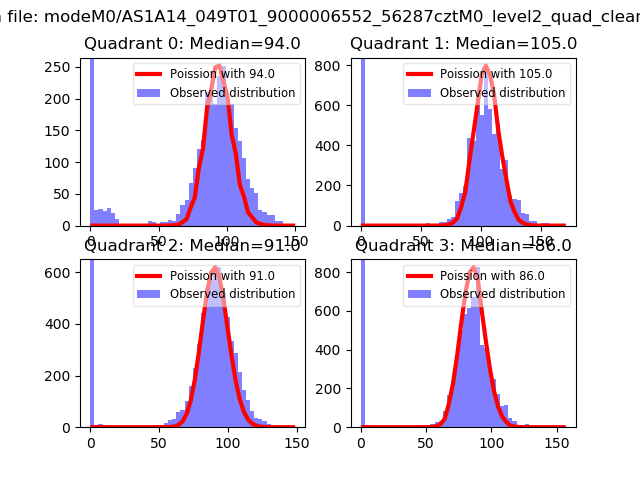 |
 |
| Quadrant-wise count rates Data is divided into 100 sec bins |
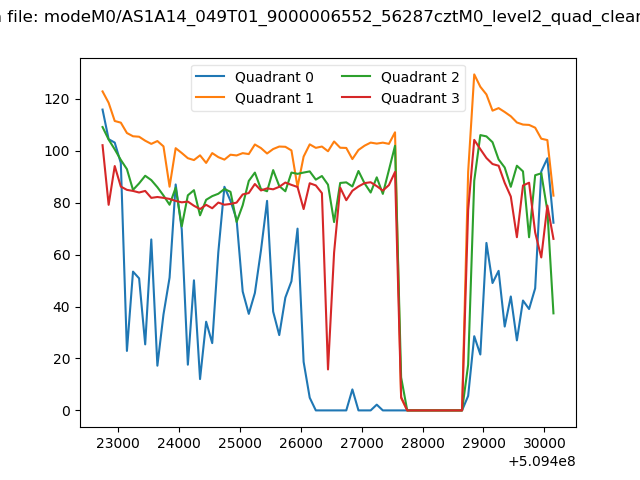 |
|
| Module-wise count rates for Quadrant A Data is divided into 100 sec bins |
 |
 |
| Module-wise count rates for Quadrant B Data is divided into 100 sec bins |
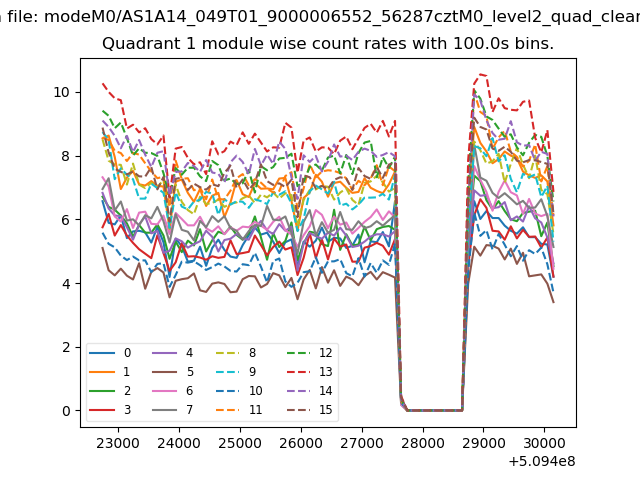 |
 |
| Module-wise count rates for Quadrant C Data is divided into 100 sec bins |
 |
 |
| Module-wise count rates for Quadrant D Data is divided into 100 sec bins |
 |
 |
| Parameter | Plot |
|---|---|
| CZT HV Monitor | 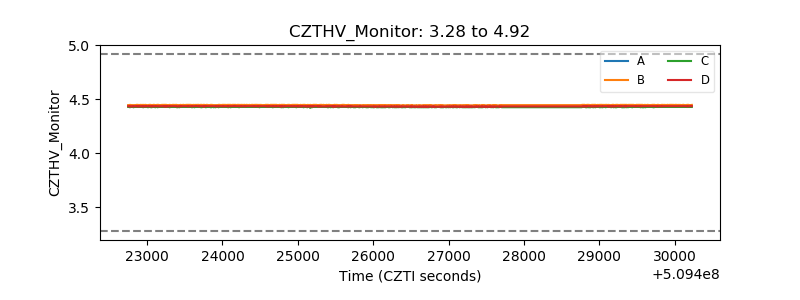 |
| D_VDD |  |
| Temperature 1 | 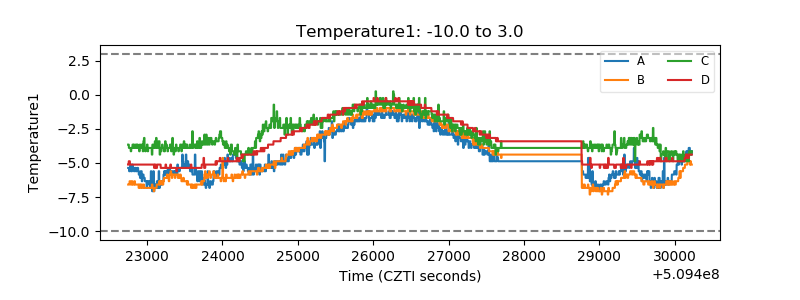 |
| Veto HV Monitor | 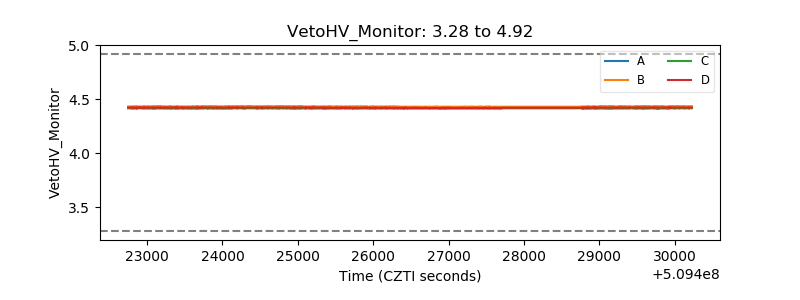 |
| Veto LLD | 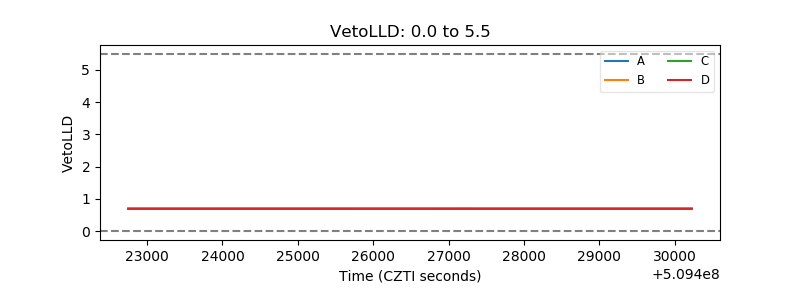 |
| Alpha Counter | 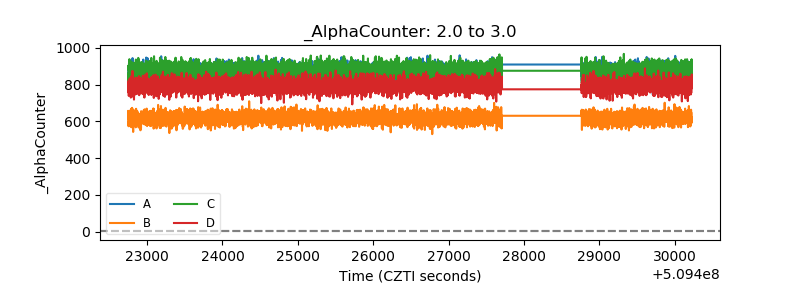 |
| _CPM_Rate | 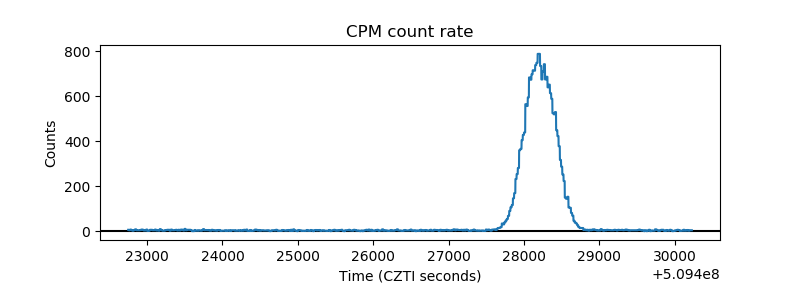 |
| CZT Counter |  |
| +2.5 Volts monitor |  |
| +5 Volts monitor | 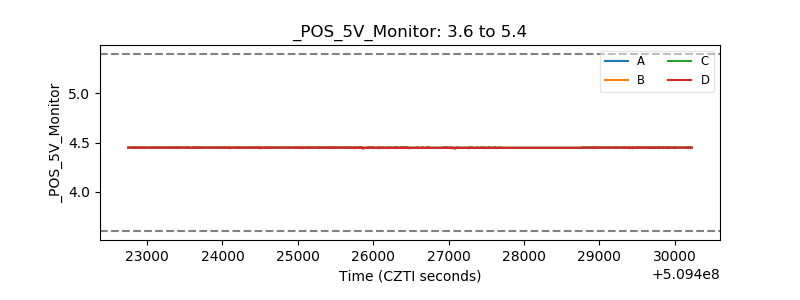 |
| _ROLL_ROT | 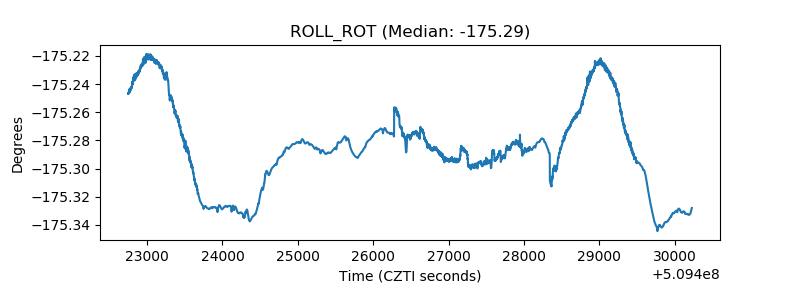 |
| _Roll_DEC | 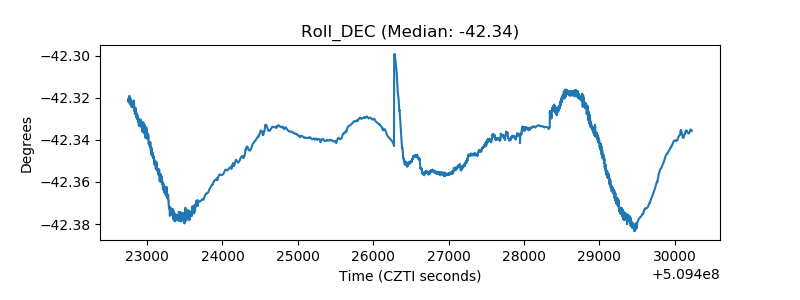 |
| _Roll_RA |  |
| Veto Counter | 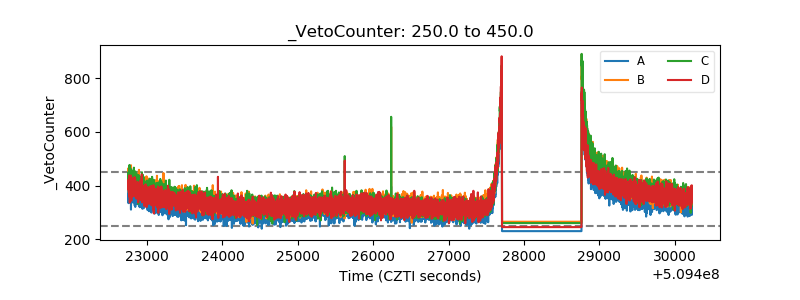 |