| Param | Original file | Final file |
|---|---|---|
| Filename | modeM0/AS1A14_049T01_9000006552_56288cztM0_level2.fits | modeM0/AS1A14_049T01_9000006552_56288cztM0_level2_quad_clean.evt |
| Size (bytes) | 739,100,160 | 82,517,760 |
| Size | 704.9 MB | 78.7 MB |
| Events in quadrant A | 12,382,243 | 300,189 |
| Events in quadrant B | 3,652,222 | 671,418 |
| Events in quadrant C | 5,851,986 | 564,601 |
| Events in quadrant D | 4,981,583 | 519,925 |
| Mode SS | |||
|---|---|---|---|
| Quadrant | BADHDUFLAG | Total packets | Discarded packets |
| A | 0 | 128 | 0 |
| B | 0 | 128 | 0 |
| C | 0 | 128 | 0 |
| D | 0 | 128 | 0 |
| Mode M9 | |||
|---|---|---|---|
| Quadrant | BADHDUFLAG | Total packets | Discarded packets |
| A | 0 | 11 | 0 |
| B | 0 | 11 | 0 |
| C | 0 | 11 | 0 |
| D | 0 | 11 | 0 |
| Mode M0 | |||
|---|---|---|---|
| Quadrant | BADHDUFLAG | Total packets | Discarded packets |
| A | 0 | 41128 | 1 |
| B | 0 | 15066 | 1 |
| C | 0 | 21716 | 1 |
| D | 0 | 19165 | 1 |
| Quadrant | Total seconds | Saturated seconds | Saturation percentage |
|---|---|---|---|
| A | 6338 | 3644 | 57.494478% |
| B | 6338 | 216 | 3.408015% |
| C | 6338 | 671 | 10.586936% |
| D | 6338 | 612 | 9.656043% |
Noise dominated data is calculated using 1-second bins in cleaned event files. If a bin has >2000 counts, and if more than 50% of those come from <1% of pixels, then it is considered to be noise-dominated and hence unusable.
| Quadrant | # 1 sec bins | Bins with >0 counts | Bins with >2000 counts | High rate bins dominated by noise | Noise dominated (total time) | Noise dominated (detector-on time) | Marked lightcurve |
|---|---|---|---|---|---|---|---|
| A | 7483 | 6338 | 3513 | 3513 | 46.95% | 55.43% | 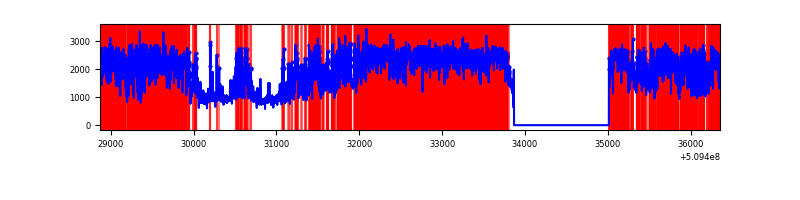 |
| B | 7483 | 6338 | 77 | 77 | 1.03% | 1.21% |  |
| C | 7483 | 6338 | 540 | 540 | 7.22% | 8.52% | 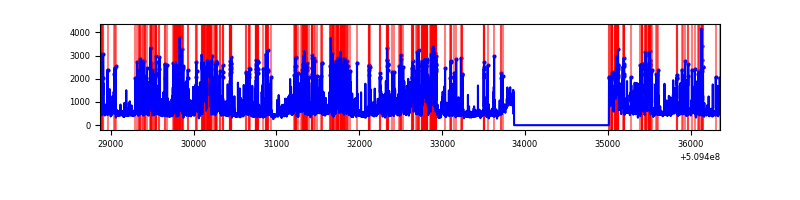 |
| D | 7483 | 6338 | 602 | 602 | 8.04% | 9.50% |  |
Top three noisy pixels from each quadrant. If the there are fewer than three noisy pixels in the level2.evt file, extra rows are filled as -1
| Pixel properties | Quadrant properties | ||||||
|---|---|---|---|---|---|---|---|
| Quadrant | DetID | PixID | Counts | Sigma | Mean | Median | Sigma |
| A | 8 | 176 | 4368330 | 30945.58 | 564 | 551 | 141.1 |
| A | 15 | 32 | 2502642 | 17727.24 | 564 | 551 | 141.1 |
| A | 4 | 95 | 2282265 | 16165.87 | 564 | 551 | 141.1 |
| B | 4 | 206 | 235512 | 1606.24 | 691 | 669 | 146.2 |
| B | 5 | 185 | 203950 | 1390.37 | 691 | 669 | 146.2 |
| B | 8 | 128 | 135495 | 922.16 | 691 | 669 | 146.2 |
| C | 12 | 254 | 1277085 | 7050.52 | 664 | 658 | 181.0 |
| C | 5 | 250 | 1092637 | 6031.69 | 664 | 658 | 181.0 |
| C | 12 | 252 | 331145 | 1825.49 | 664 | 658 | 181.0 |
| D | 12 | 31 | 839099 | 4509.67 | 658 | 627 | 185.9 |
| D | 5 | 32 | 786569 | 4227.14 | 658 | 627 | 185.9 |
| D | 2 | 249 | 250569 | 1344.3 | 658 | 627 | 185.9 |
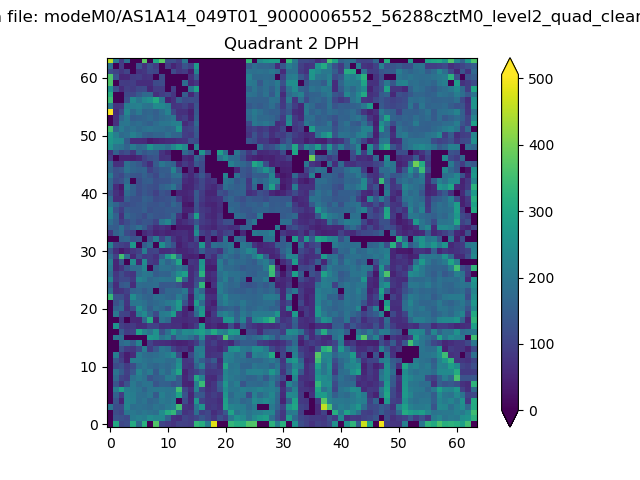
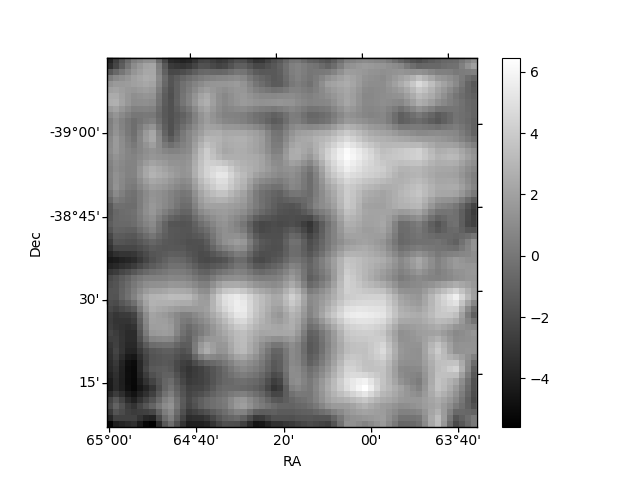
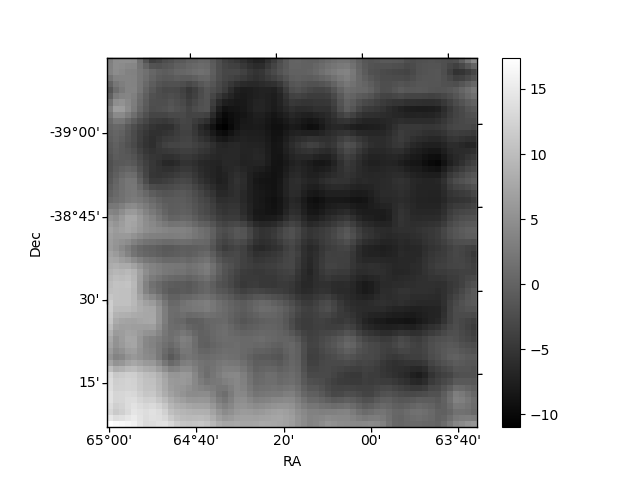
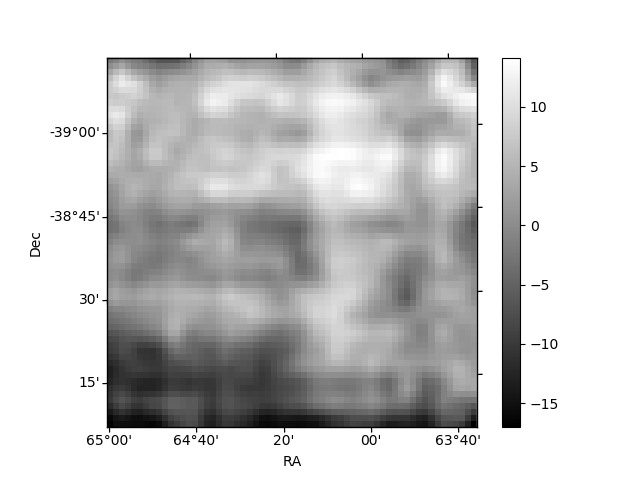
Histogram calculated using DETX and DETY for each event in the final _common_clean file
| Quadrant A | 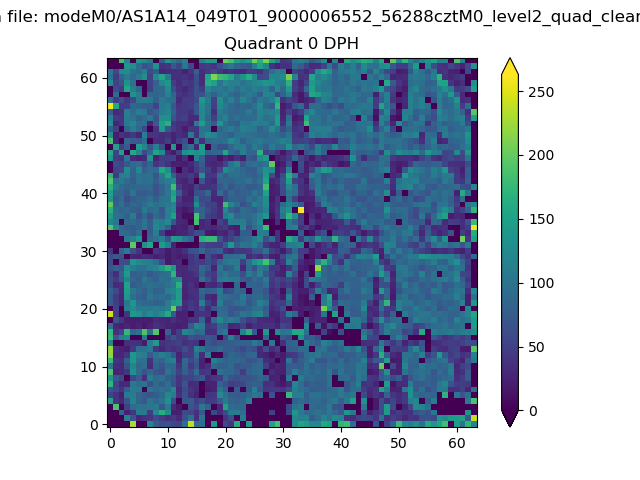 |
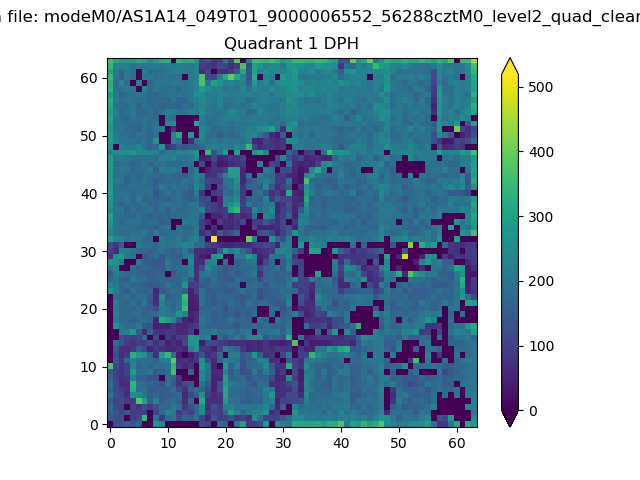 |
Quadrant B |
|---|---|---|---|
| Quadrant D | 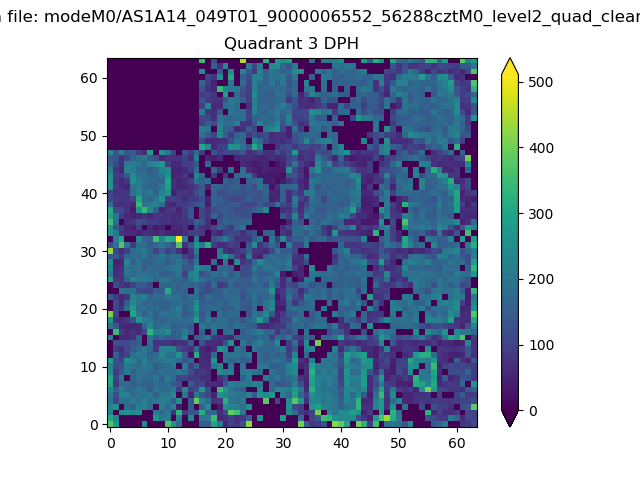 |
 |
Quadrant C |
| Plot type | Count rate plots | Images |
|---|---|---|
| Comparison with Poisson distribution Blue bars denote a histogram of data divided into 1 sec bins. Red curve is a Poisson curve with rate = median count rate of data. |
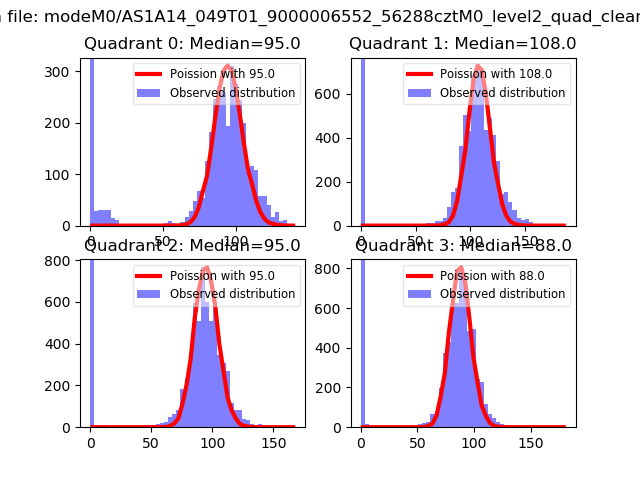 |
 |
| Quadrant-wise count rates Data is divided into 100 sec bins |
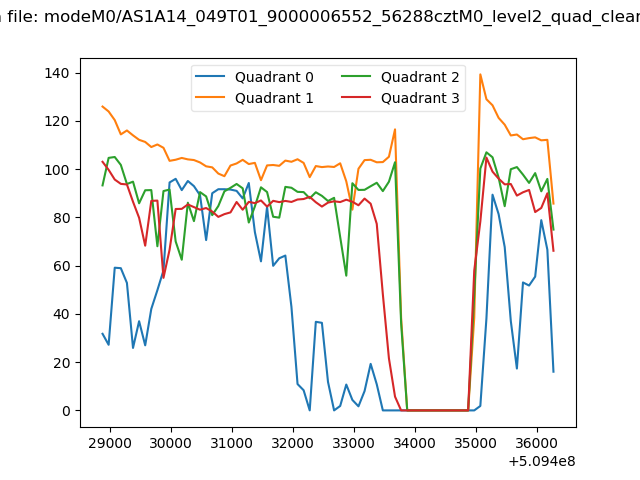 |
|
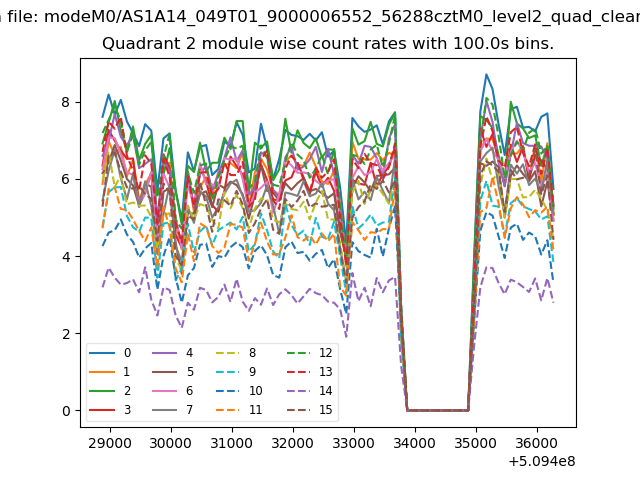
| Module-wise count rates for Quadrant A Data is divided into 100 sec bins |
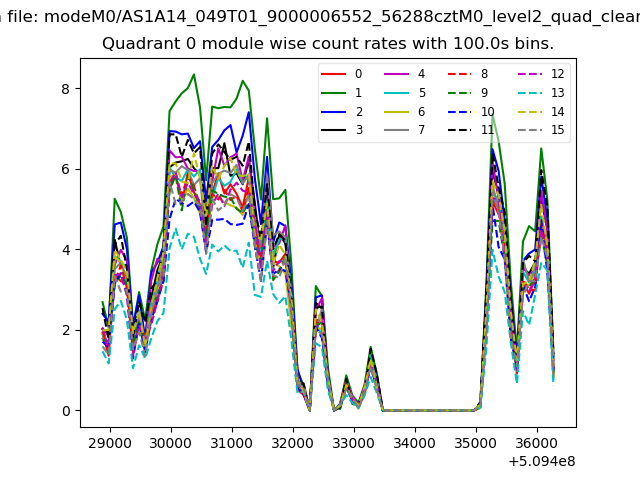 |
 |
| Module-wise count rates for Quadrant B Data is divided into 100 sec bins |
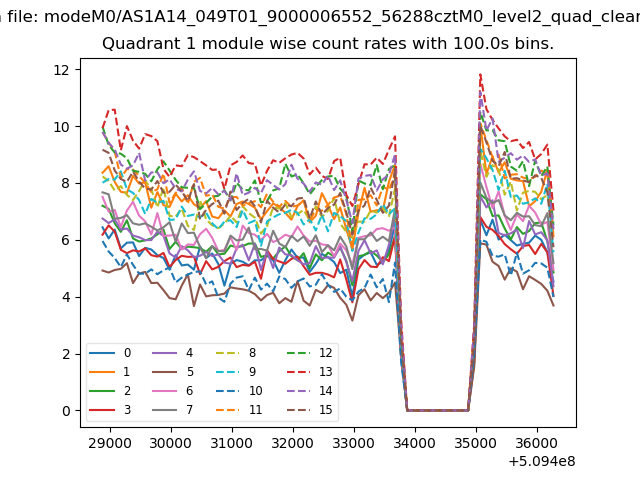 |
 |
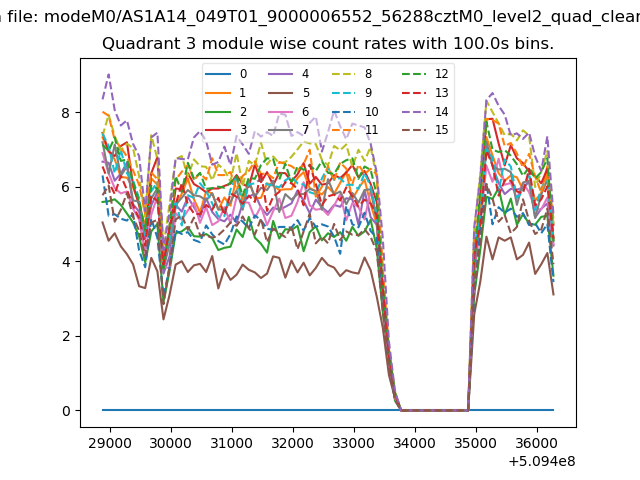
| Module-wise count rates for Quadrant C Data is divided into 100 sec bins |
 |
 |
| Module-wise count rates for Quadrant D Data is divided into 100 sec bins |
 |
 |
| Parameter | Plot |
|---|---|
| CZT HV Monitor |  |
| D_VDD | 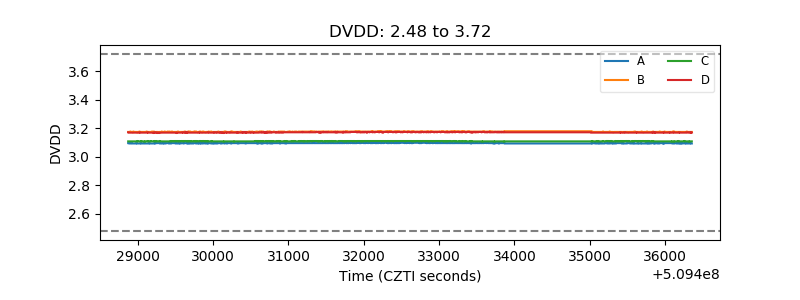 |
| Temperature 1 | 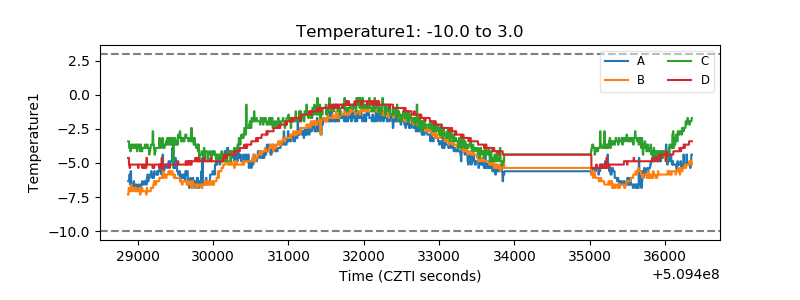 |
| Veto HV Monitor | 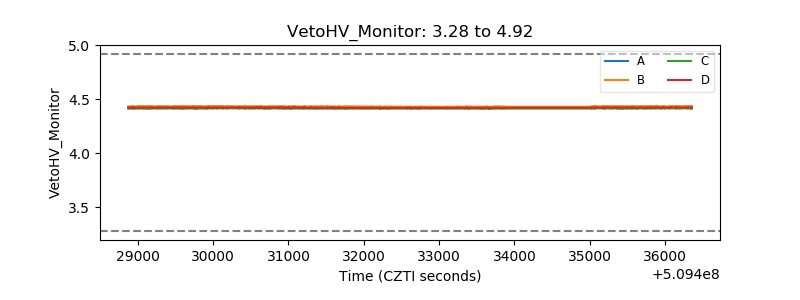 |
| Veto LLD | 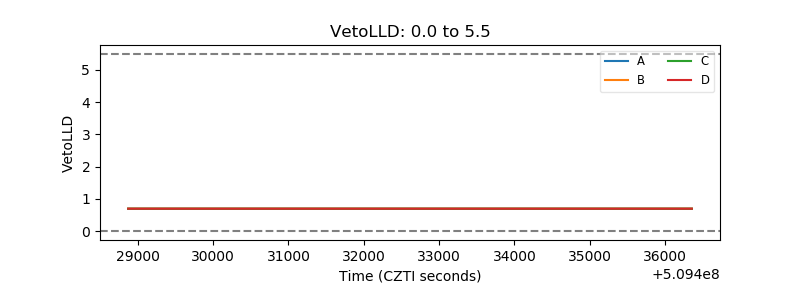 |
| Alpha Counter |  |
| _CPM_Rate |  |
| CZT Counter | 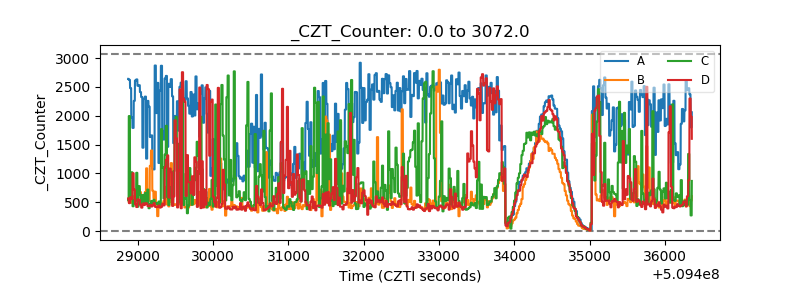 |
| +2.5 Volts monitor | 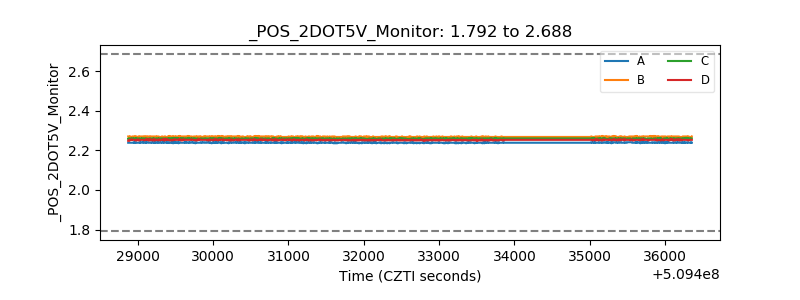 |
| +5 Volts monitor |  |
| _ROLL_ROT | 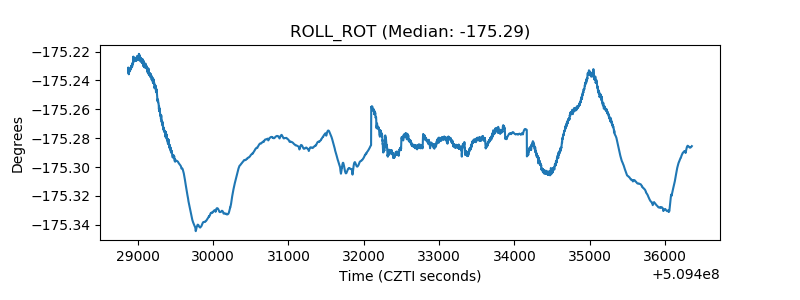 |
| _Roll_DEC | 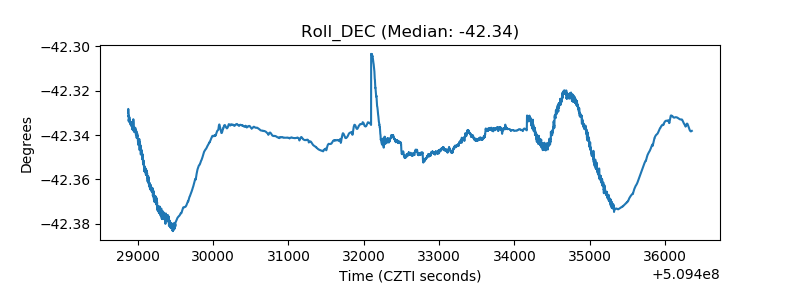 |
| _Roll_RA |  |
| Veto Counter | 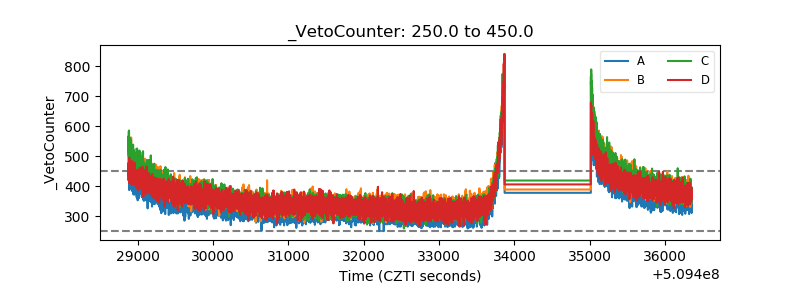 |