| Param | Original file | Final file |
|---|---|---|
| Filename | modeM0/AS1A14_049T01_9000006552_56289cztM0_level2.fits | modeM0/AS1A14_049T01_9000006552_56289cztM0_level2_quad_clean.evt |
| Size (bytes) | 762,776,640 | 85,043,520 |
| Size | 727.4 MB | 81.1 MB |
| Events in quadrant A | 11,885,280 | 365,288 |
| Events in quadrant B | 3,498,582 | 692,930 |
| Events in quadrant C | 7,198,580 | 510,961 |
| Events in quadrant D | 5,153,777 | 556,325 |
| Mode SS | |||
|---|---|---|---|
| Quadrant | BADHDUFLAG | Total packets | Discarded packets |
| A | 0 | 130 | 0 |
| B | 0 | 130 | 0 |
| C | 0 | 130 | 0 |
| D | 0 | 130 | 0 |
| Mode M9 | |||
|---|---|---|---|
| Quadrant | BADHDUFLAG | Total packets | Discarded packets |
| A | 0 | 12 | 0 |
| B | 0 | 13 | 0 |
| C | 0 | 13 | 0 |
| D | 0 | 13 | 0 |
| Mode M0 | |||
|---|---|---|---|
| Quadrant | BADHDUFLAG | Total packets | Discarded packets |
| A | 0 | 39817 | 2 |
| B | 0 | 14579 | 2 |
| C | 0 | 25830 | 2 |
| D | 0 | 19824 | 2 |
| Quadrant | Total seconds | Saturated seconds | Saturation percentage |
|---|---|---|---|
| A | 6447 | 3207 | 49.744067% |
| B | 6447 | 209 | 3.241818% |
| C | 6447 | 1443 | 22.382503% |
| D | 6447 | 506 | 7.848612% |
Noise dominated data is calculated using 1-second bins in cleaned event files. If a bin has >2000 counts, and if more than 50% of those come from <1% of pixels, then it is considered to be noise-dominated and hence unusable.
| Quadrant | # 1 sec bins | Bins with >0 counts | Bins with >2000 counts | High rate bins dominated by noise | Noise dominated (total time) | Noise dominated (detector-on time) | Marked lightcurve |
|---|---|---|---|---|---|---|---|
| A | 7566 | 6446 | 3029 | 3029 | 40.03% | 46.99% | 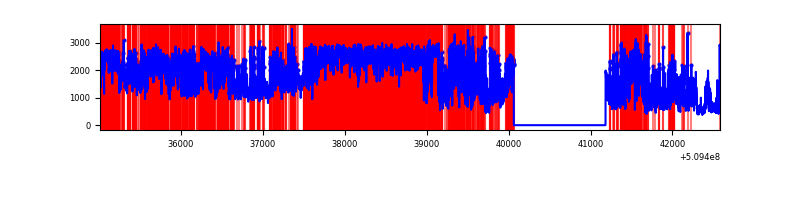 |
| B | 7567 | 6447 | 27 | 27 | 0.36% | 0.42% |  |
| C | 7566 | 6446 | 1222 | 1222 | 16.15% | 18.96% |  |
| D | 7567 | 6447 | 396 | 396 | 5.23% | 6.14% |  |
Top three noisy pixels from each quadrant. If the there are fewer than three noisy pixels in the level2.evt file, extra rows are filled as -1
| Pixel properties | Quadrant properties | ||||||
|---|---|---|---|---|---|---|---|
| Quadrant | DetID | PixID | Counts | Sigma | Mean | Median | Sigma |
| A | 8 | 176 | 3127792 | 21053.41 | 597 | 583 | 148.5 |
| A | 15 | 32 | 2958013 | 19910.4 | 597 | 583 | 148.5 |
| A | 4 | 95 | 1643929 | 11063.55 | 597 | 583 | 148.5 |
| B | 5 | 185 | 144251 | 950.97 | 714 | 690 | 151.0 |
| B | 0 | 63 | 138330 | 911.75 | 714 | 690 | 151.0 |
| B | 0 | 213 | 118498 | 780.38 | 714 | 690 | 151.0 |
| C | 12 | 254 | 3041417 | 17298.62 | 649 | 644 | 175.8 |
| C | 5 | 250 | 725998 | 4126.46 | 649 | 644 | 175.8 |
| C | 12 | 252 | 436152 | 2477.56 | 649 | 644 | 175.8 |
| D | 12 | 31 | 1429050 | 7344.49 | 692 | 659 | 194.5 |
| D | 2 | 249 | 438279 | 2250.15 | 692 | 659 | 194.5 |
| D | 5 | 32 | 129314 | 661.52 | 692 | 659 | 194.5 |
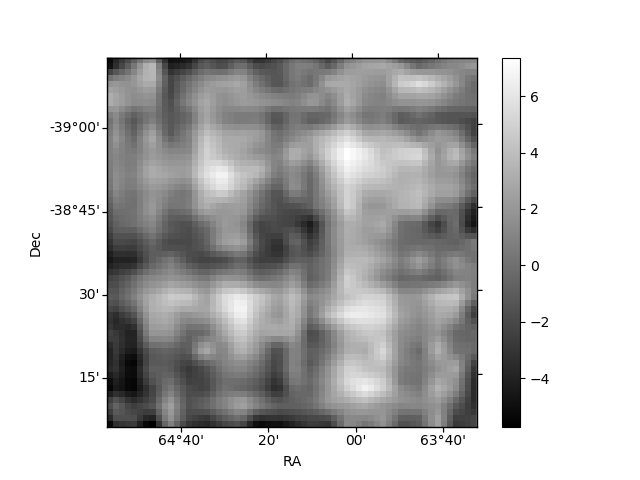
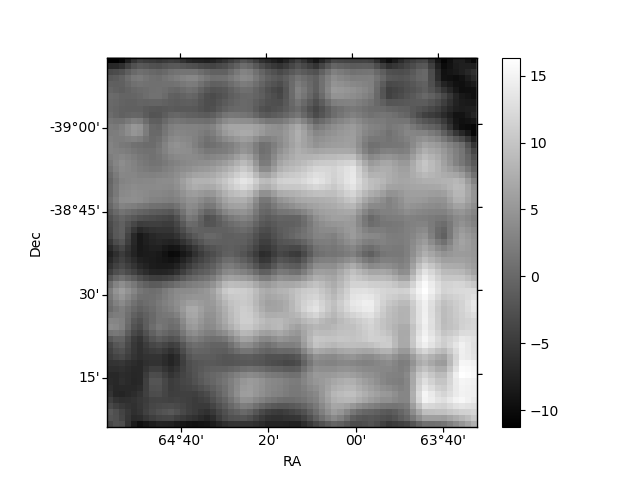
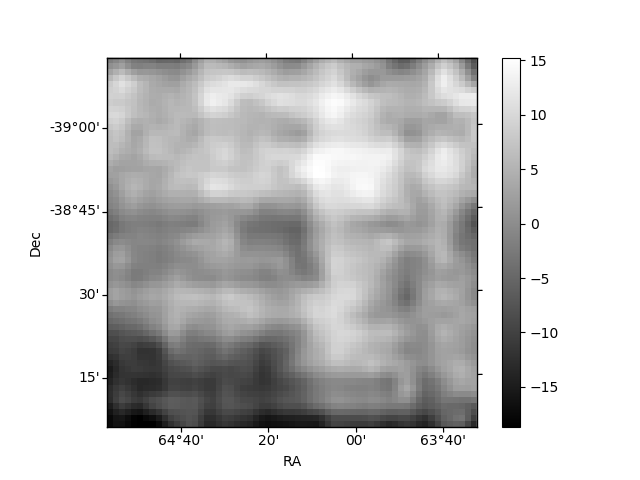
Histogram calculated using DETX and DETY for each event in the final _common_clean file
| Quadrant A | 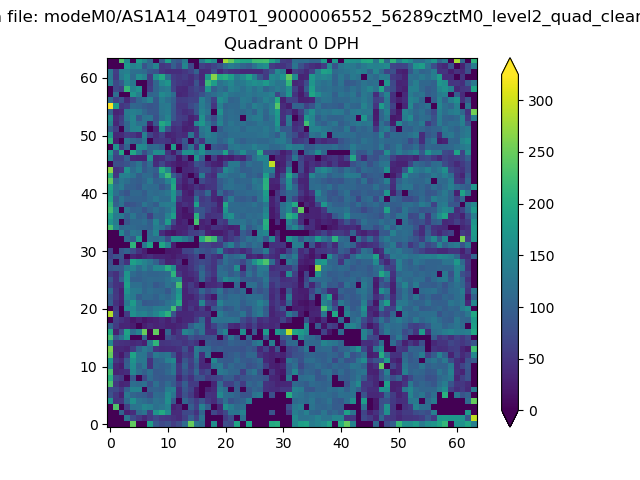 |
 |
Quadrant B |
|---|---|---|---|
| Quadrant D | 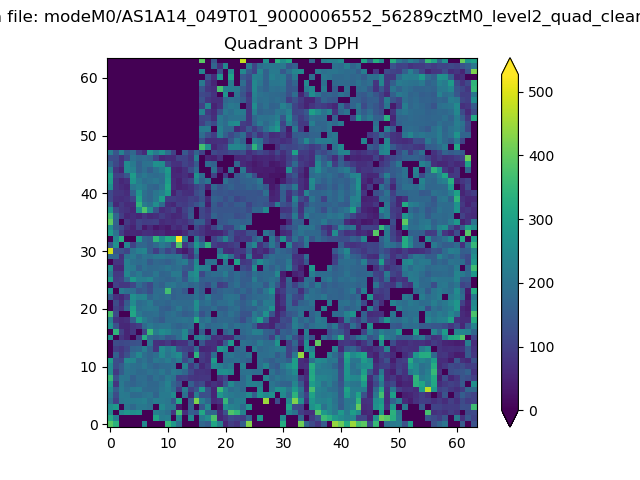 |
 |
Quadrant C |
| Plot type | Count rate plots | Images |
|---|---|---|
| Comparison with Poisson distribution Blue bars denote a histogram of data divided into 1 sec bins. Red curve is a Poisson curve with rate = median count rate of data. |
 |
 |
| Quadrant-wise count rates Data is divided into 100 sec bins |
 |
|
| Module-wise count rates for Quadrant A Data is divided into 100 sec bins |
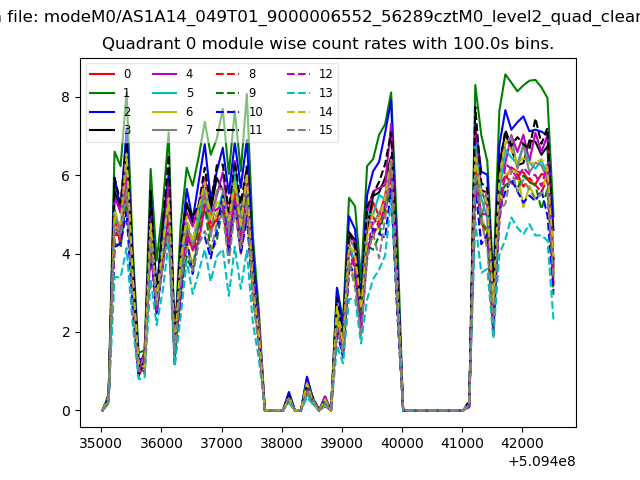 |
 |
| Module-wise count rates for Quadrant B Data is divided into 100 sec bins |
 |
 |
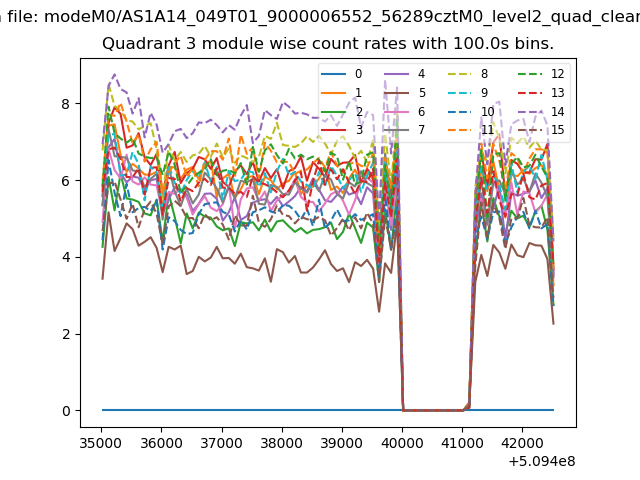
| Module-wise count rates for Quadrant C Data is divided into 100 sec bins |
 |
 |
| Module-wise count rates for Quadrant D Data is divided into 100 sec bins |
 |
 |
| Parameter | Plot |
|---|---|
| CZT HV Monitor | 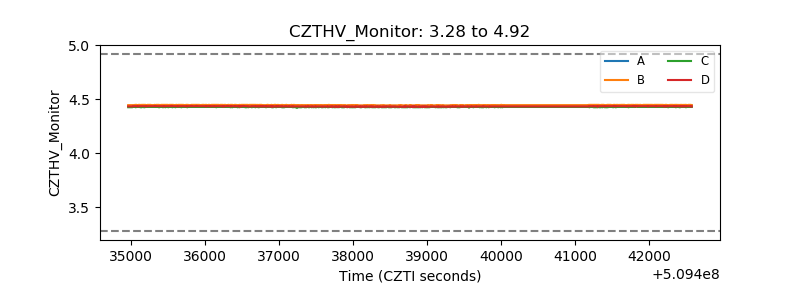 |
| D_VDD |  |
| Temperature 1 | 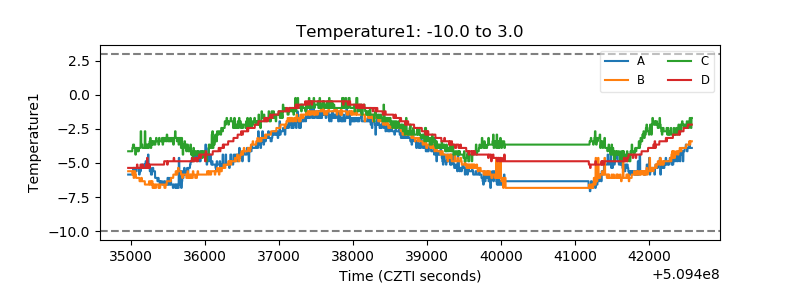 |
| Veto HV Monitor | 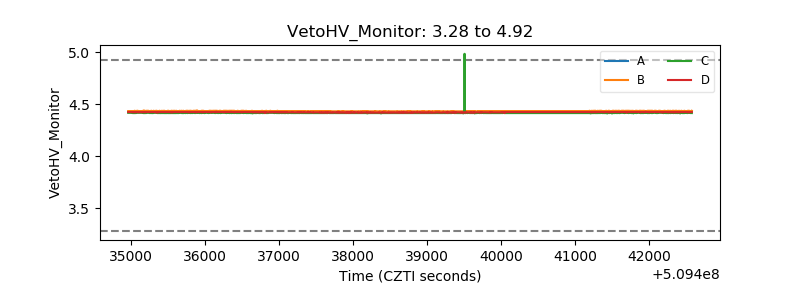 |
| Veto LLD |  |
| Alpha Counter |  |
| _CPM_Rate |  |
| CZT Counter | 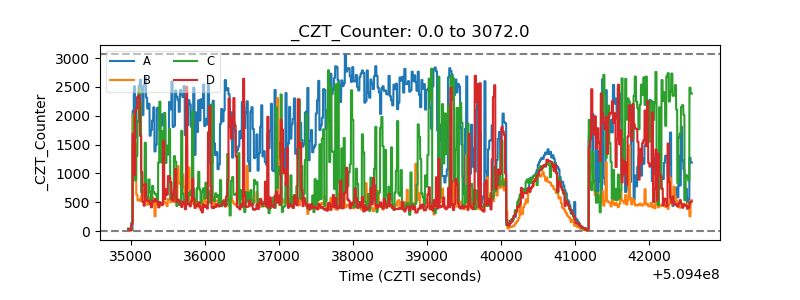 |
| +2.5 Volts monitor | 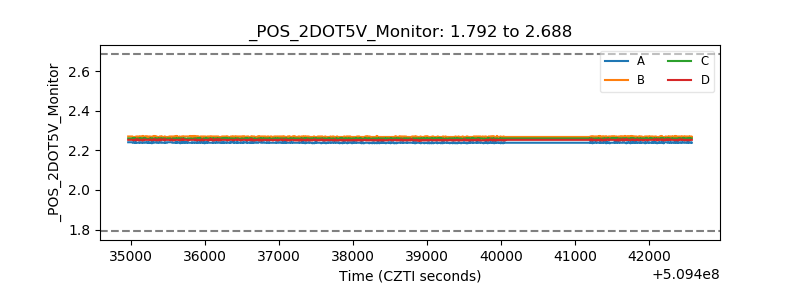 |
| +5 Volts monitor | 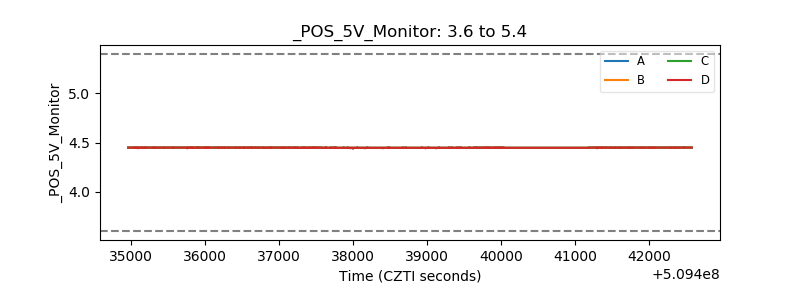 |
| _ROLL_ROT | 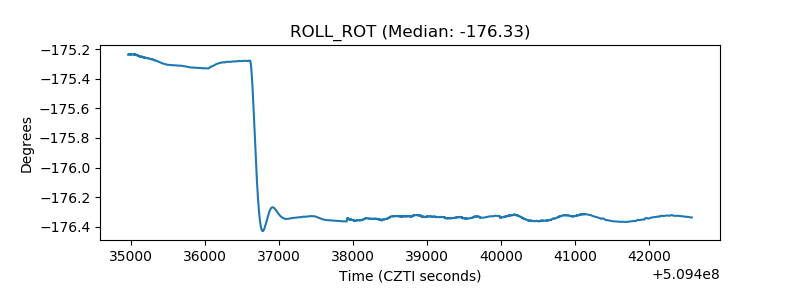 |
| _Roll_DEC | 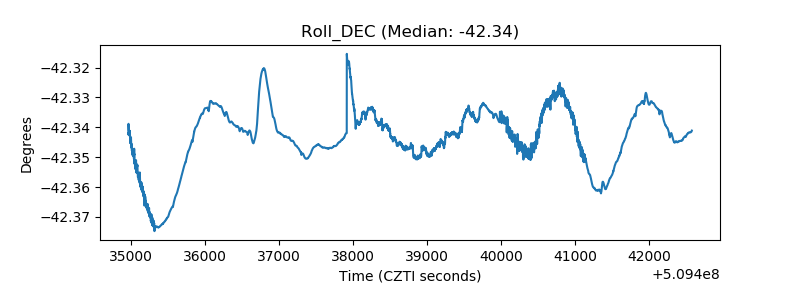 |
| _Roll_RA |  |
| Veto Counter | 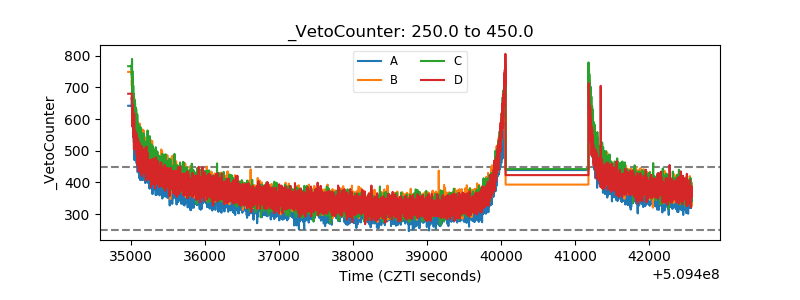 |