| Param | Original file | Final file |
|---|---|---|
| Filename | modeM0/AS1A14_049T01_9000006552_56291cztM0_level2.fits | modeM0/AS1A14_049T01_9000006552_56291cztM0_level2_quad_clean.evt |
| Size (bytes) | 779,264,640 | 69,410,880 |
| Size | 743.2 MB | 66.2 MB |
| Events in quadrant A | 14,108,610 | 102,998 |
| Events in quadrant B | 5,574,244 | 522,275 |
| Events in quadrant C | 4,635,217 | 535,182 |
| Events in quadrant D | 4,054,753 | 514,926 |
| Mode SS | |||
|---|---|---|---|
| Quadrant | BADHDUFLAG | Total packets | Discarded packets |
| A | 0 | 126 | 0 |
| B | 0 | 126 | 0 |
| C | 0 | 126 | 0 |
| D | 0 | 126 | 0 |
| Mode M9 | |||
|---|---|---|---|
| Quadrant | BADHDUFLAG | Total packets | Discarded packets |
| A | 0 | 8 | 0 |
| B | 0 | 8 | 0 |
| C | 0 | 8 | 0 |
| D | 0 | 8 | 0 |
| Mode M0 | |||
|---|---|---|---|
| Quadrant | BADHDUFLAG | Total packets | Discarded packets |
| A | 0 | 46066 | 1 |
| B | 0 | 20815 | 1 |
| C | 0 | 18103 | 1 |
| D | 0 | 16171 | 1 |
| Quadrant | Total seconds | Saturated seconds | Saturation percentage |
|---|---|---|---|
| A | 6093 | 5228 | 85.803381% |
| B | 6093 | 1186 | 19.464960% |
| C | 6093 | 455 | 7.467586% |
| D | 6093 | 283 | 4.644674% |
Noise dominated data is calculated using 1-second bins in cleaned event files. If a bin has >2000 counts, and if more than 50% of those come from <1% of pixels, then it is considered to be noise-dominated and hence unusable.
| Quadrant | # 1 sec bins | Bins with >0 counts | Bins with >2000 counts | High rate bins dominated by noise | Noise dominated (total time) | Noise dominated (detector-on time) | Marked lightcurve |
|---|---|---|---|---|---|---|---|
| A | 6912 | 6092 | 4834 | 4834 | 69.94% | 79.35% |  |
| B | 6913 | 6093 | 575 | 575 | 8.32% | 9.44% |  |
| C | 6913 | 6093 | 325 | 325 | 4.70% | 5.33% | 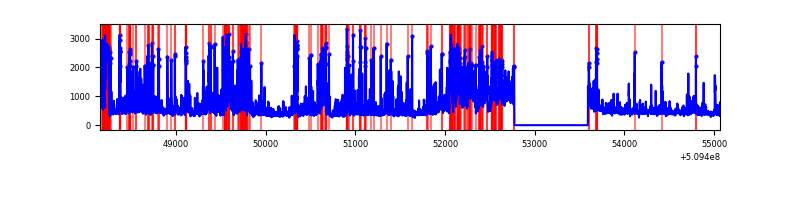 |
| D | 6913 | 6093 | 206 | 206 | 2.98% | 3.38% |  |
Top three noisy pixels from each quadrant. If the there are fewer than three noisy pixels in the level2.evt file, extra rows are filled as -1
| Pixel properties | Quadrant properties | ||||||
|---|---|---|---|---|---|---|---|
| Quadrant | DetID | PixID | Counts | Sigma | Mean | Median | Sigma |
| A | 15 | 32 | 8016677 | 87973.6 | 358 | 348 | 91.1 |
| A | 4 | 95 | 2251304 | 24702.67 | 358 | 348 | 91.1 |
| A | 7 | 64 | 998427 | 10953.22 | 358 | 348 | 91.1 |
| B | 5 | 172 | 2291833 | 18030.99 | 591 | 570 | 127.1 |
| B | 5 | 185 | 308014 | 2419.42 | 591 | 570 | 127.1 |
| B | 1 | 159 | 149954 | 1175.57 | 591 | 570 | 127.1 |
| C | 12 | 254 | 1064744 | 6177.11 | 623 | 616 | 172.3 |
| C | 13 | 3 | 576601 | 3343.51 | 623 | 616 | 172.3 |
| C | 12 | 252 | 229387 | 1327.98 | 623 | 616 | 172.3 |
| D | 8 | 129 | 322940 | 1799.93 | 636 | 608 | 179.1 |
| D | 12 | 31 | 282769 | 1575.62 | 636 | 608 | 179.1 |
| D | 2 | 249 | 222771 | 1240.58 | 636 | 608 | 179.1 |
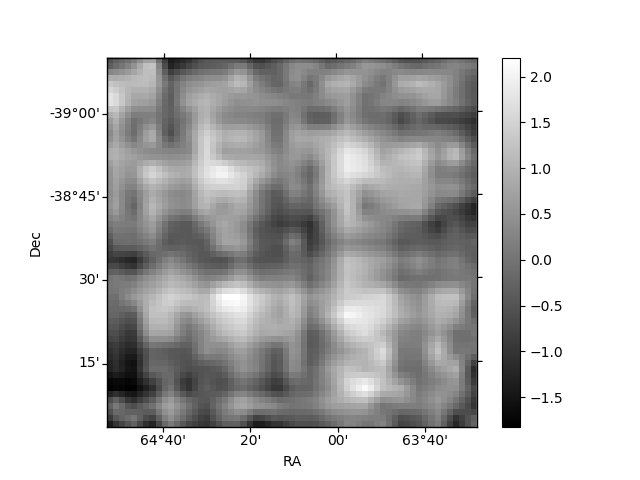
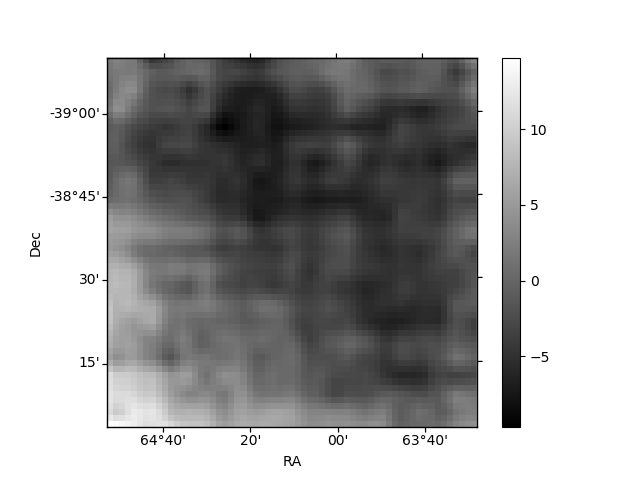
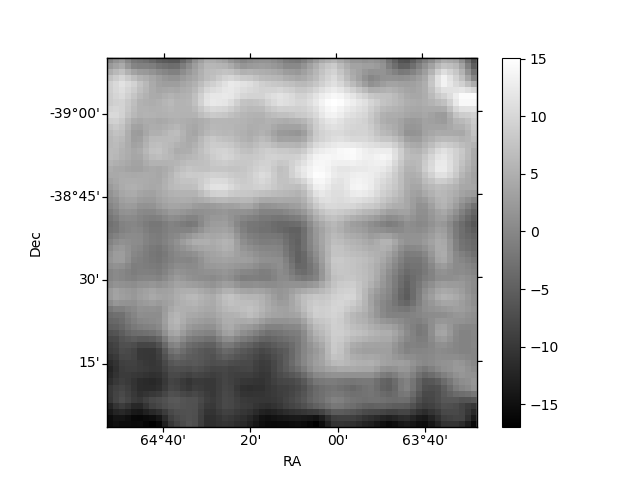
Histogram calculated using DETX and DETY for each event in the final _common_clean file
| Quadrant A | 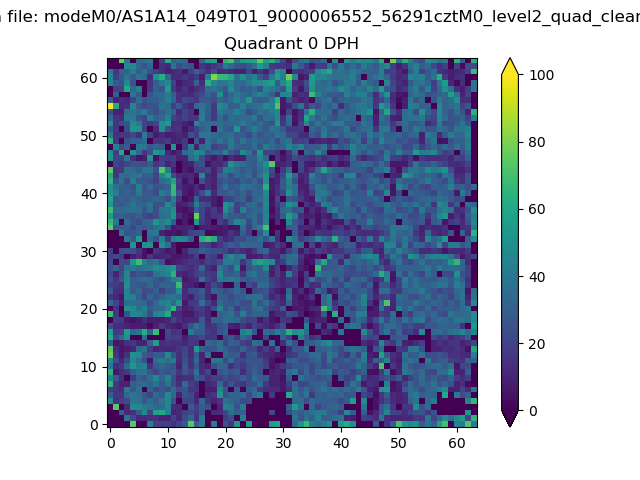 |
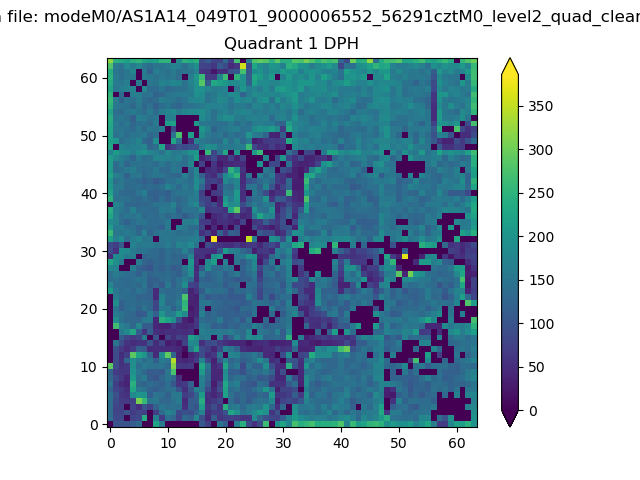 |
Quadrant B |
|---|---|---|---|
| Quadrant D | 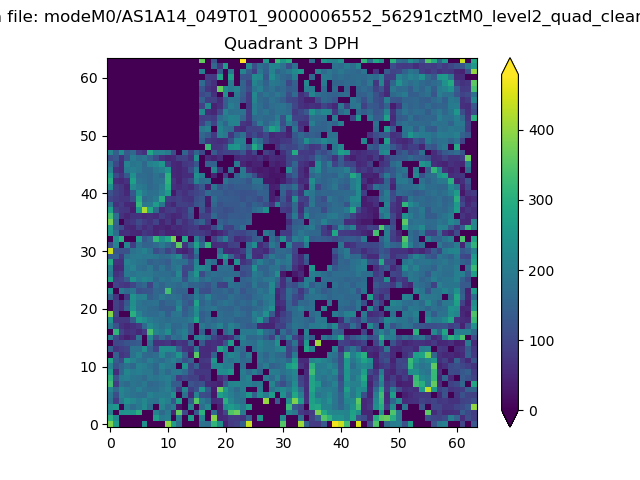 |
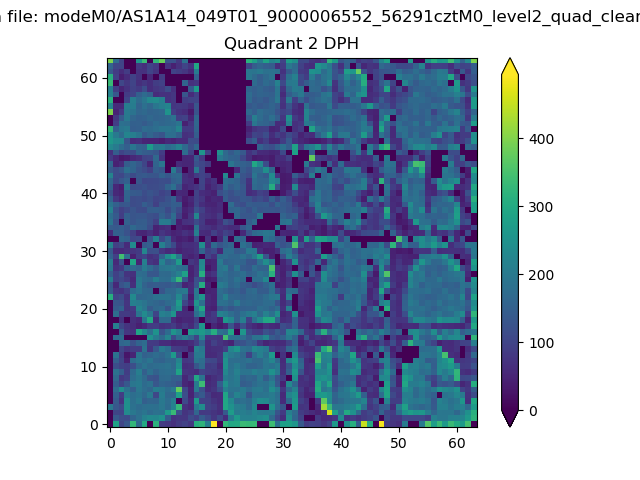 |
Quadrant C |
| Plot type | Count rate plots | Images |
|---|---|---|
| Comparison with Poisson distribution Blue bars denote a histogram of data divided into 1 sec bins. Red curve is a Poisson curve with rate = median count rate of data. |
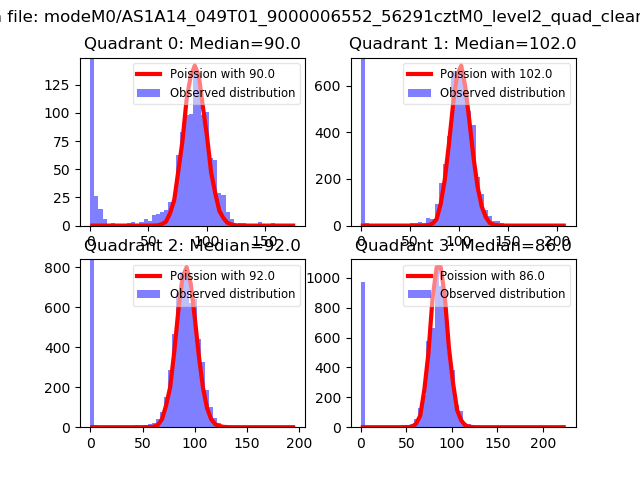 |
 |
| Quadrant-wise count rates Data is divided into 100 sec bins |
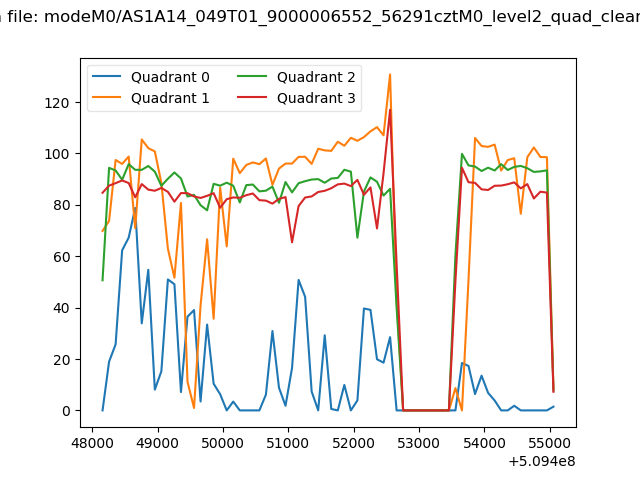 |
|
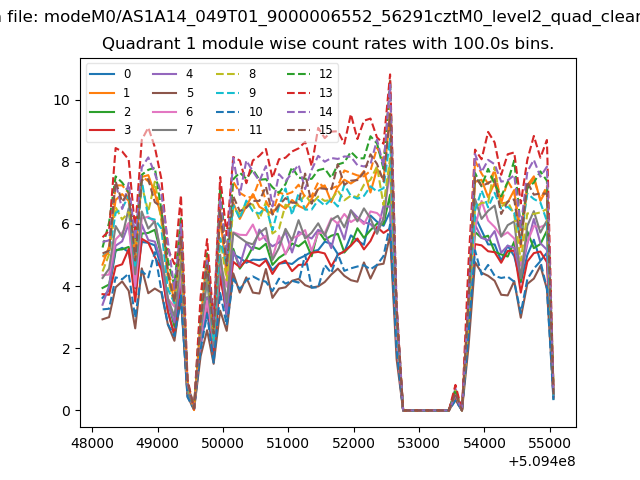
| Module-wise count rates for Quadrant A Data is divided into 100 sec bins |
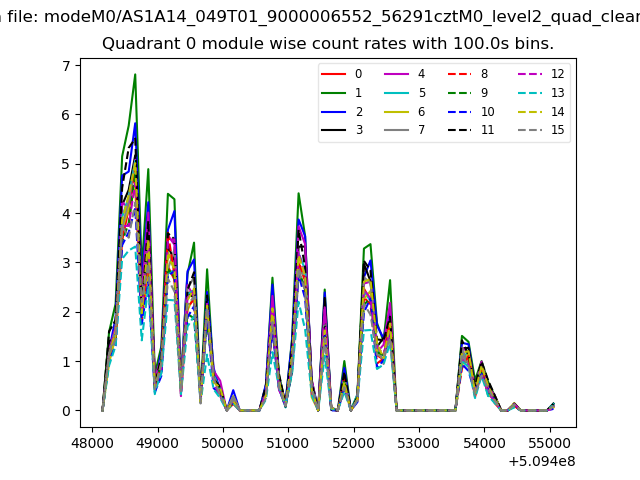 |
 |
| Module-wise count rates for Quadrant B Data is divided into 100 sec bins |
 |
 |
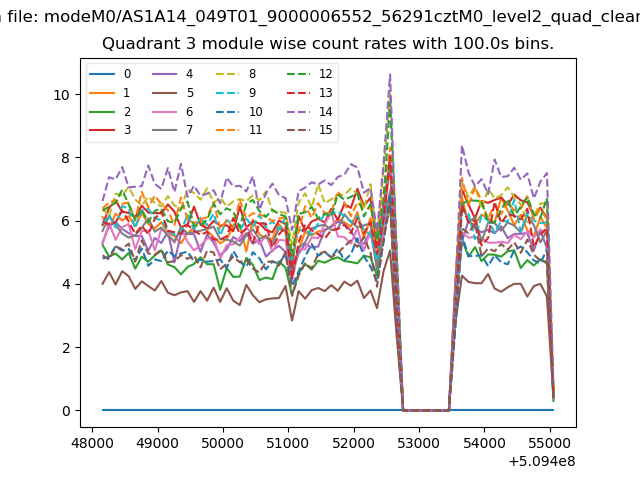
| Module-wise count rates for Quadrant C Data is divided into 100 sec bins |
 |
 |
| Module-wise count rates for Quadrant D Data is divided into 100 sec bins |
 |
 |
| Parameter | Plot |
|---|---|
| CZT HV Monitor |  |
| D_VDD | 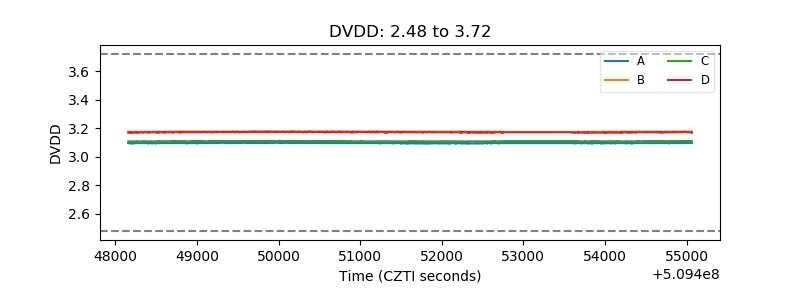 |
| Temperature 1 | 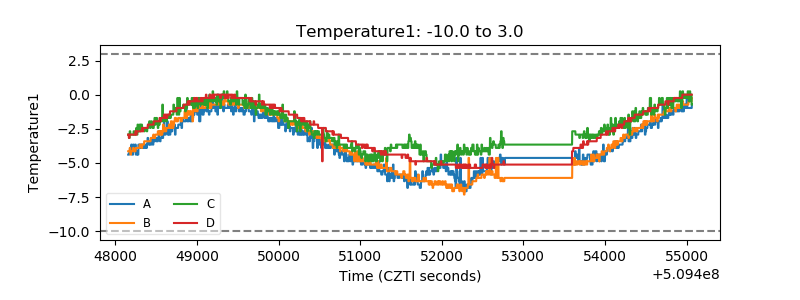 |
| Veto HV Monitor | 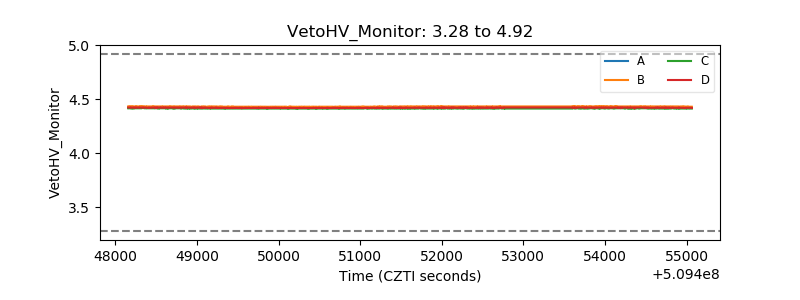 |
| Veto LLD | 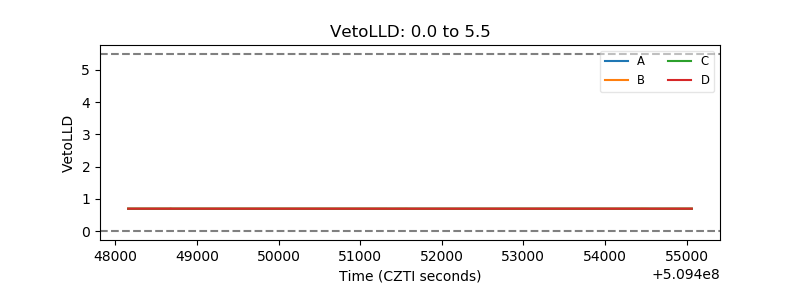 |
| Alpha Counter |  |
| _CPM_Rate |  |
| CZT Counter | 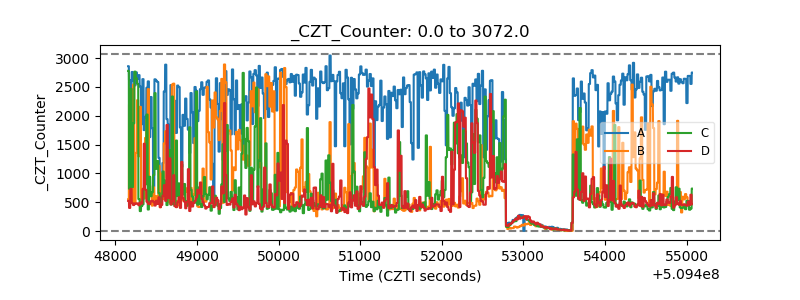 |
| +2.5 Volts monitor | 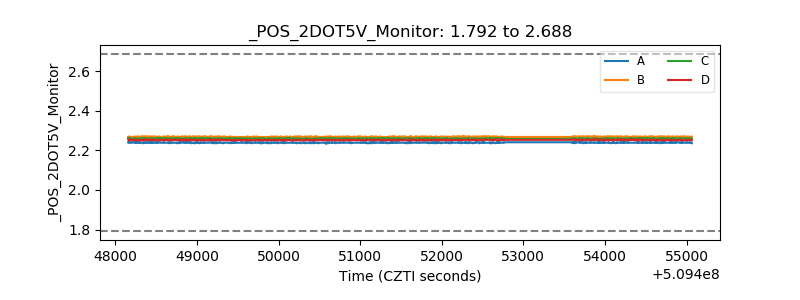 |
| +5 Volts monitor |  |
| _ROLL_ROT | 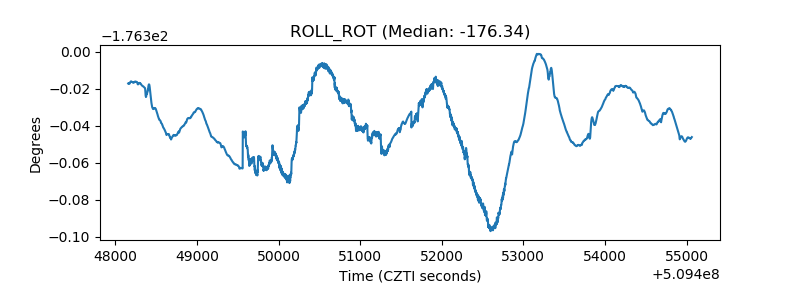 |
| _Roll_DEC | 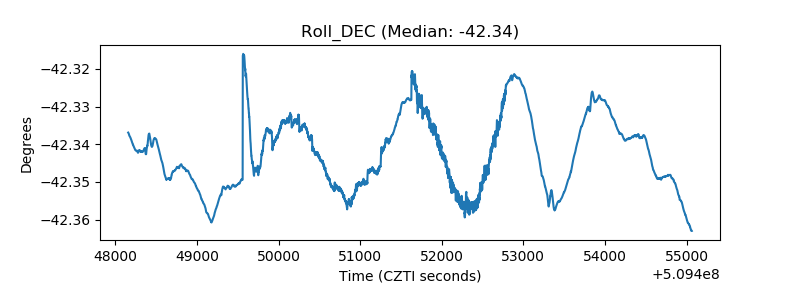 |
| _Roll_RA |  |
| Veto Counter | 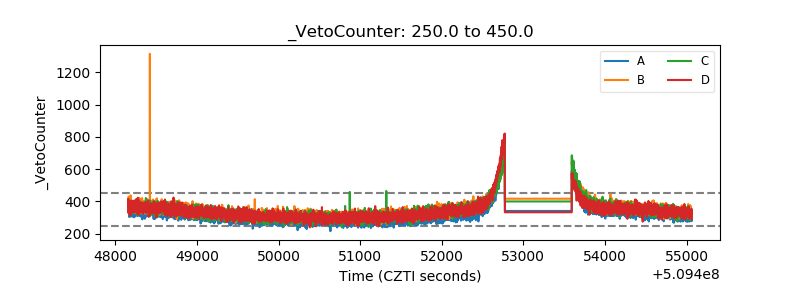 |