| Param | Original file | Final file |
|---|---|---|
| Filename | modeM0/AS1A14_049T01_9000006552_56292cztM0_level2.fits | modeM0/AS1A14_049T01_9000006552_56292cztM0_level2_quad_clean.evt |
| Size (bytes) | 799,914,240 | 82,183,680 |
| Size | 762.9 MB | 78.4 MB |
| Events in quadrant A | 16,679,419 | 72,544 |
| Events in quadrant B | 4,440,494 | 692,889 |
| Events in quadrant C | 3,580,952 | 640,606 |
| Events in quadrant D | 4,367,759 | 596,619 |
| Mode SS | |||
|---|---|---|---|
| Quadrant | BADHDUFLAG | Total packets | Discarded packets |
| A | 0 | 142 | 0 |
| B | 0 | 142 | 0 |
| C | 0 | 142 | 0 |
| D | 0 | 142 | 0 |
| Mode M9 | |||
|---|---|---|---|
| Quadrant | BADHDUFLAG | Total packets | Discarded packets |
| A | 0 | 4 | 0 |
| B | 0 | 4 | 0 |
| C | 0 | 4 | 0 |
| D | 0 | 4 | 0 |
| Mode M0 | |||
|---|---|---|---|
| Quadrant | BADHDUFLAG | Total packets | Discarded packets |
| A | 0 | 54342 | 1 |
| B | 0 | 18171 | 1 |
| C | 0 | 15853 | 1 |
| D | 0 | 17872 | 1 |
| Quadrant | Total seconds | Saturated seconds | Saturation percentage |
|---|---|---|---|
| A | 6967 | 6333 | 90.899957% |
| B | 6967 | 405 | 5.813119% |
| C | 6968 | 84 | 1.205511% |
| D | 6968 | 192 | 2.755454% |
Noise dominated data is calculated using 1-second bins in cleaned event files. If a bin has >2000 counts, and if more than 50% of those come from <1% of pixels, then it is considered to be noise-dominated and hence unusable.
| Quadrant | # 1 sec bins | Bins with >0 counts | Bins with >2000 counts | High rate bins dominated by noise | Noise dominated (total time) | Noise dominated (detector-on time) | Marked lightcurve |
|---|---|---|---|---|---|---|---|
| A | 7376 | 6966 | 6079 | 6079 | 82.42% | 87.27% |  |
| B | 7377 | 6967 | 215 | 215 | 2.91% | 3.09% |  |
| C | 7378 | 6968 | 54 | 54 | 0.73% | 0.77% | 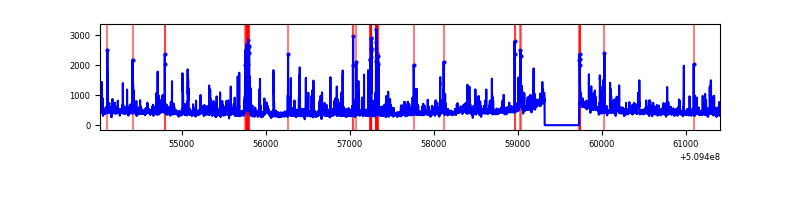 |
| D | 7378 | 6968 | 160 | 160 | 2.17% | 2.30% |  |
Top three noisy pixels from each quadrant. If the there are fewer than three noisy pixels in the level2.evt file, extra rows are filled as -1
| Pixel properties | Quadrant properties | ||||||
|---|---|---|---|---|---|---|---|
| Quadrant | DetID | PixID | Counts | Sigma | Mean | Median | Sigma |
| A | 15 | 32 | 10516107 | 117208.51 | 351 | 342 | 89.7 |
| A | 4 | 95 | 2319219 | 25846.16 | 351 | 342 | 89.7 |
| A | 8 | 25 | 677735 | 7550.21 | 351 | 342 | 89.7 |
| B | 5 | 185 | 725440 | 4591.43 | 735 | 707 | 157.8 |
| B | 5 | 172 | 201638 | 1272.97 | 735 | 707 | 157.8 |
| B | 10 | 247 | 160902 | 1014.89 | 735 | 707 | 157.8 |
| C | 12 | 252 | 359624 | 1772.23 | 728 | 720 | 202.5 |
| C | 5 | 250 | 151428 | 744.18 | 728 | 720 | 202.5 |
| C | 12 | 249 | 71172 | 347.89 | 728 | 720 | 202.5 |
| D | 5 | 32 | 501922 | 2428.54 | 729 | 697 | 206.4 |
| D | 2 | 249 | 380827 | 1841.81 | 729 | 697 | 206.4 |
| D | 8 | 129 | 229111 | 1106.71 | 729 | 697 | 206.4 |
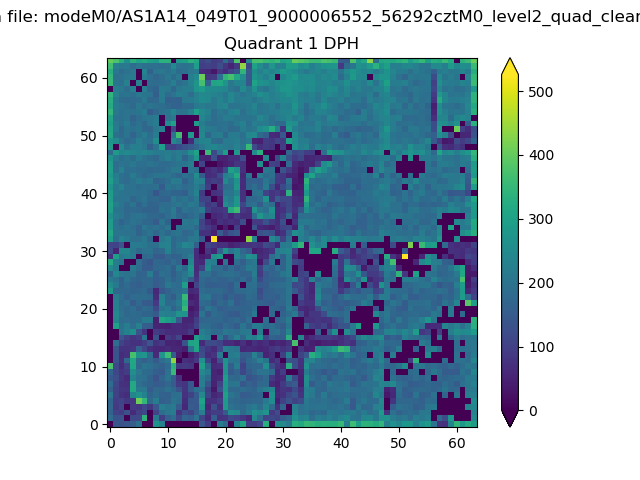
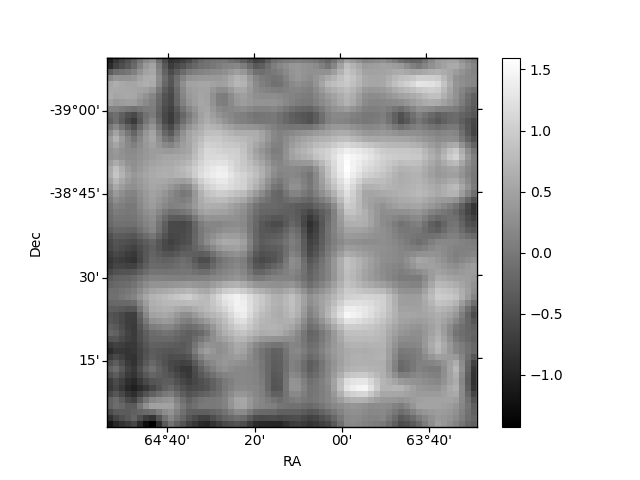
Histogram calculated using DETX and DETY for each event in the final _common_clean file
| Quadrant A |  |
 |
Quadrant B |
|---|---|---|---|
| Quadrant D |  |
 |
Quadrant C |
| Plot type | Count rate plots | Images |
|---|---|---|
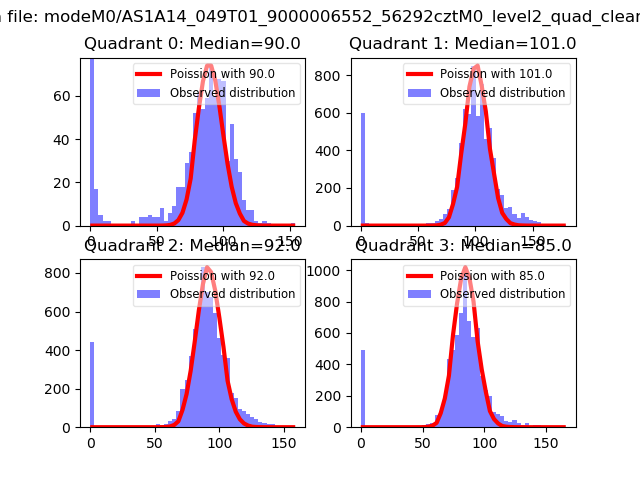
| Comparison with Poisson distribution Blue bars denote a histogram of data divided into 1 sec bins. Red curve is a Poisson curve with rate = median count rate of data. |
 |
 |
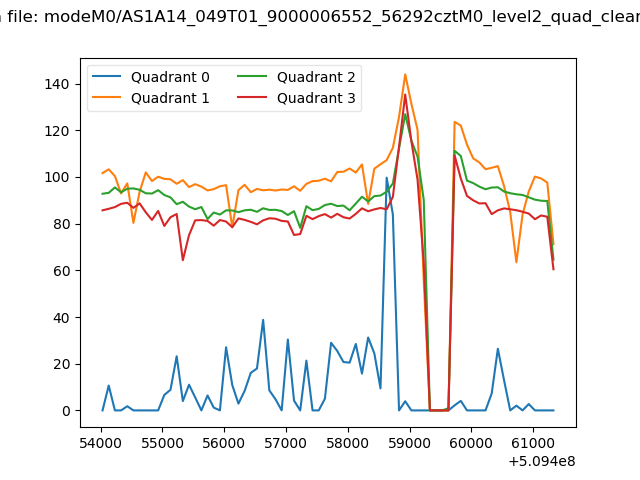
| Quadrant-wise count rates Data is divided into 100 sec bins |
 |
|
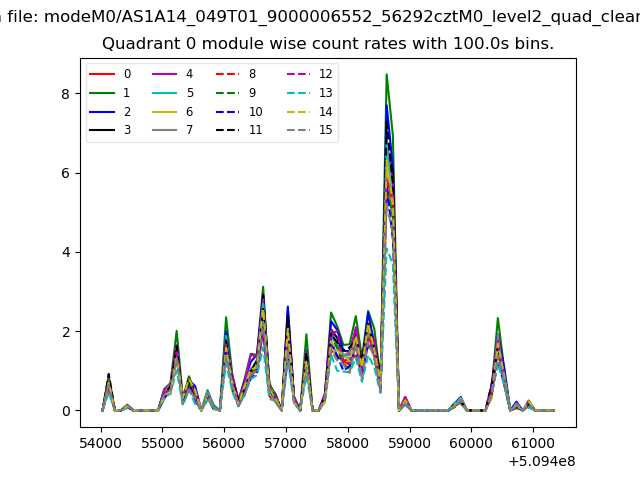
| Module-wise count rates for Quadrant A Data is divided into 100 sec bins |
 |
 |
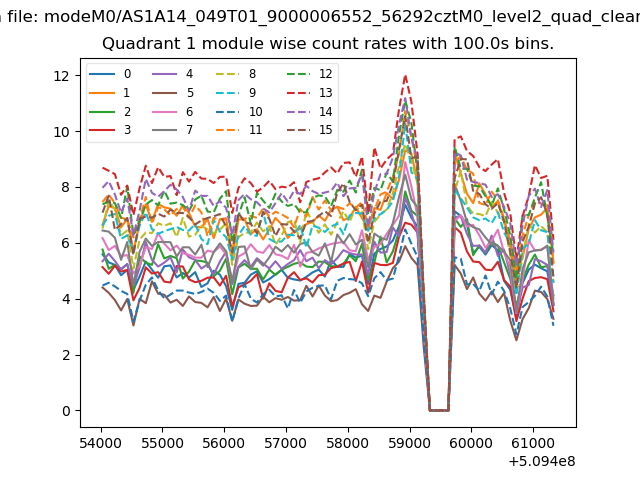
| Module-wise count rates for Quadrant B Data is divided into 100 sec bins |
 |
 |
| Module-wise count rates for Quadrant C Data is divided into 100 sec bins |
 |
 |
| Module-wise count rates for Quadrant D Data is divided into 100 sec bins |
 |
 |
| Parameter | Plot |
|---|---|
| CZT HV Monitor |  |
| D_VDD |  |
| Temperature 1 |  |
| Veto HV Monitor | 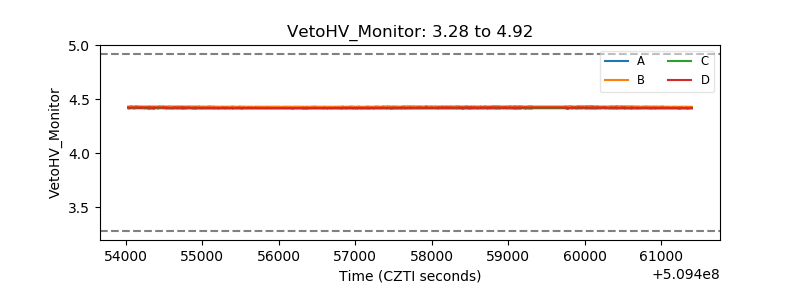 |
| Veto LLD | 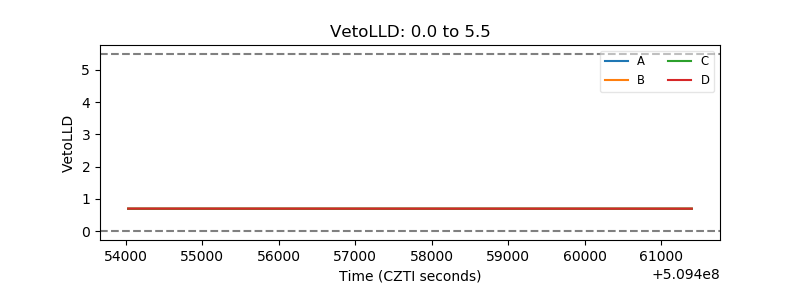 |
| Alpha Counter |  |
| _CPM_Rate | 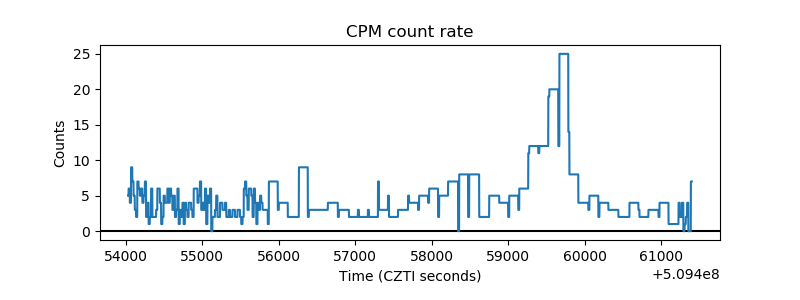 |
| CZT Counter | 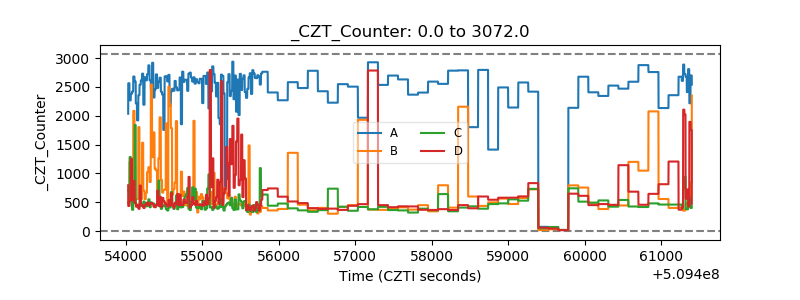 |
| +2.5 Volts monitor |  |
| +5 Volts monitor |  |
| _ROLL_ROT | 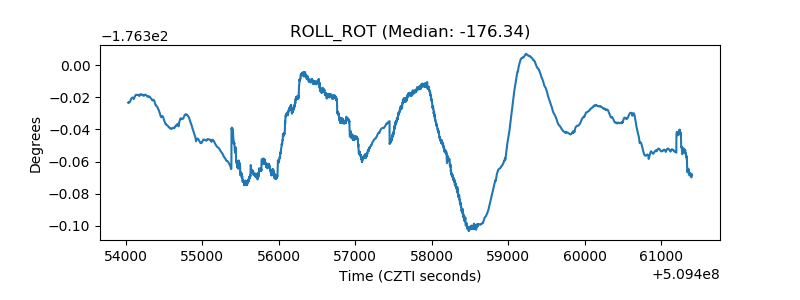 |
| _Roll_DEC | 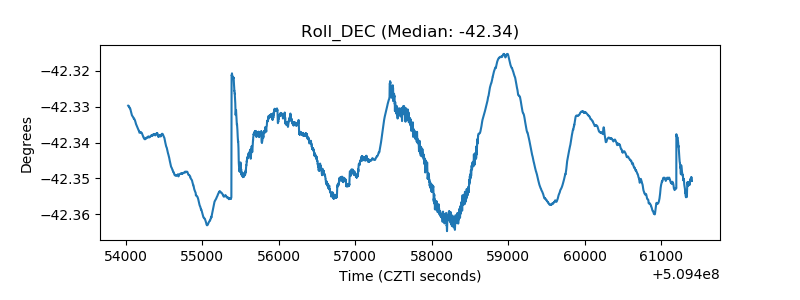 |
| _Roll_RA |  |
| Veto Counter | 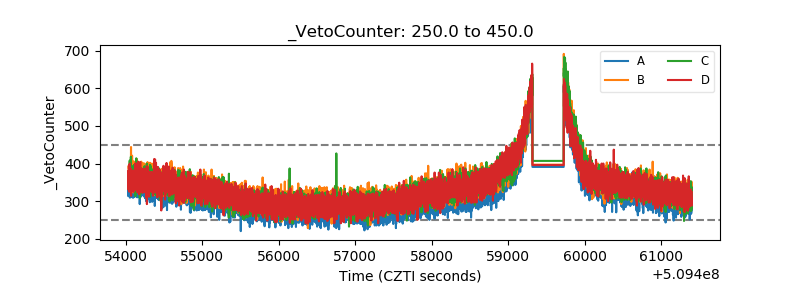 |