| Param | Original file | Final file |
|---|---|---|
| Filename | modeM0/AS1A14_049T01_9000006552_56293cztM0_level2.fits | modeM0/AS1A14_049T01_9000006552_56293cztM0_level2_quad_clean.evt |
| Size (bytes) | 868,204,800 | 85,662,720 |
| Size | 828.0 MB | 81.7 MB |
| Events in quadrant A | 16,673,228 | 129,710 |
| Events in quadrant B | 3,912,041 | 729,845 |
| Events in quadrant C | 5,313,930 | 628,360 |
| Events in quadrant D | 5,680,291 | 604,329 |
| Mode SS | |||
|---|---|---|---|
| Quadrant | BADHDUFLAG | Total packets | Discarded packets |
| A | 0 | 144 | 0 |
| B | 0 | 144 | 0 |
| C | 0 | 144 | 0 |
| D | 0 | 144 | 0 |
| Mode M0 | |||
|---|---|---|---|
| Quadrant | BADHDUFLAG | Total packets | Discarded packets |
| A | 0 | 54474 | 0 |
| B | 0 | 16962 | 0 |
| C | 0 | 21146 | 0 |
| D | 0 | 21820 | 0 |
| Quadrant | Total seconds | Saturated seconds | Saturation percentage |
|---|---|---|---|
| A | 7200 | 6205 | 86.180556% |
| B | 7200 | 178 | 2.472222% |
| C | 7200 | 506 | 7.027778% |
| D | 7200 | 379 | 5.263889% |
Noise dominated data is calculated using 1-second bins in cleaned event files. If a bin has >2000 counts, and if more than 50% of those come from <1% of pixels, then it is considered to be noise-dominated and hence unusable.
| Quadrant | # 1 sec bins | Bins with >0 counts | Bins with >2000 counts | High rate bins dominated by noise | Noise dominated (total time) | Noise dominated (detector-on time) | Marked lightcurve |
|---|---|---|---|---|---|---|---|
| A | 7199 | 7199 | 5783 | 5783 | 80.33% | 80.33% |  |
| B | 7200 | 7200 | 110 | 110 | 1.53% | 1.53% |  |
| C | 7200 | 7200 | 455 | 455 | 6.32% | 6.32% | 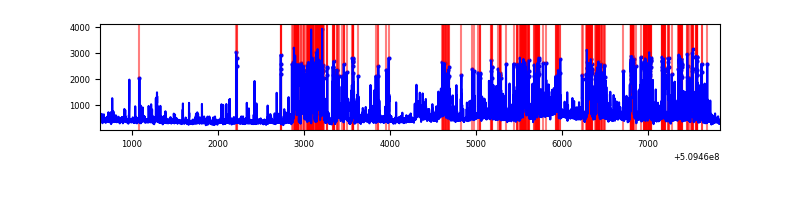 |
| D | 7200 | 7200 | 455 | 455 | 6.32% | 6.32% |  |
Top three noisy pixels from each quadrant. If the there are fewer than three noisy pixels in the level2.evt file, extra rows are filled as -1
| Pixel properties | Quadrant properties | ||||||
|---|---|---|---|---|---|---|---|
| Quadrant | DetID | PixID | Counts | Sigma | Mean | Median | Sigma |
| A | 15 | 32 | 10983859 | 113435.65 | 379 | 370 | 96.8 |
| A | 7 | 64 | 1748748 | 18056.96 | 379 | 370 | 96.8 |
| A | 9 | 250 | 555702 | 5735.38 | 379 | 370 | 96.8 |
| B | 5 | 185 | 410504 | 2516.76 | 757 | 730 | 162.8 |
| B | 0 | 231 | 118181 | 721.36 | 757 | 730 | 162.8 |
| B | 0 | 213 | 73136 | 444.71 | 757 | 730 | 162.8 |
| C | 5 | 250 | 631102 | 3147.42 | 719 | 710 | 200.3 |
| C | 13 | 3 | 531926 | 2652.26 | 719 | 710 | 200.3 |
| C | 12 | 94 | 508684 | 2536.22 | 719 | 710 | 200.3 |
| D | 2 | 249 | 975878 | 4668.25 | 732 | 699 | 208.9 |
| D | 15 | 115 | 646219 | 3090.15 | 732 | 699 | 208.9 |
| D | 8 | 129 | 584127 | 2792.91 | 732 | 699 | 208.9 |
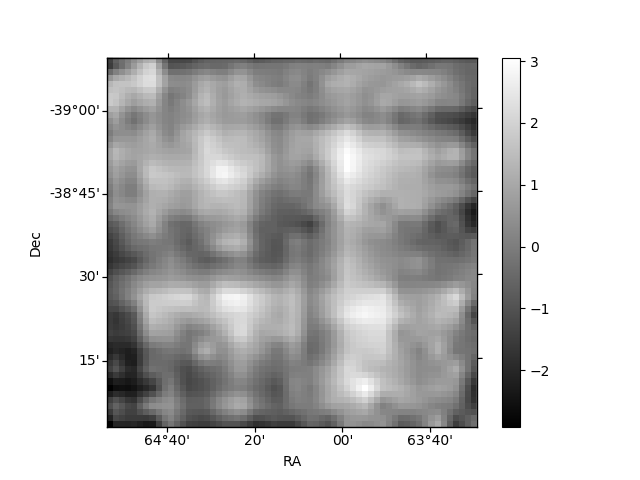
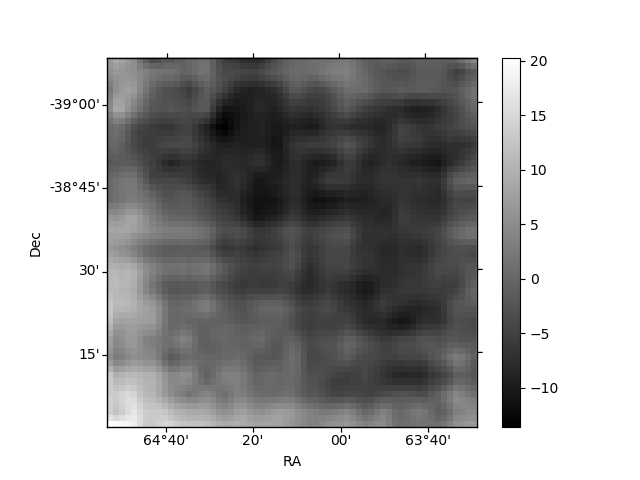
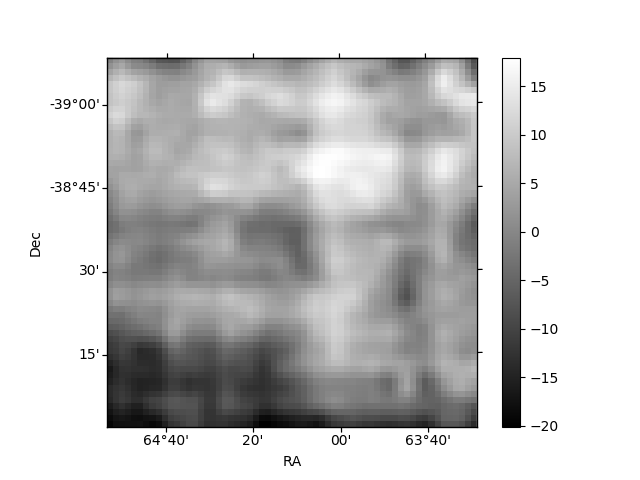
Histogram calculated using DETX and DETY for each event in the final _common_clean file
| Quadrant A | 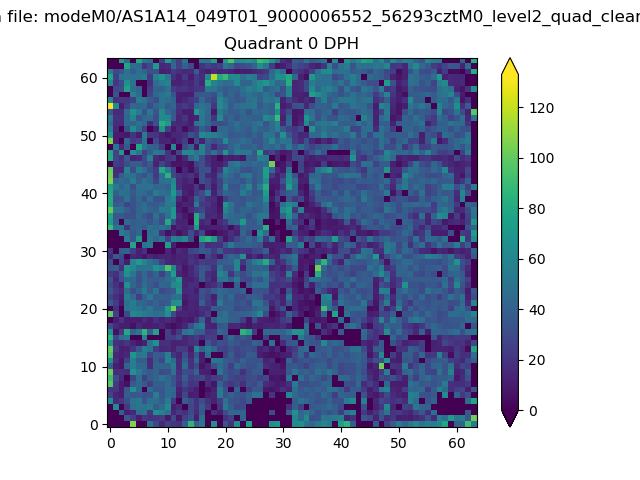 |
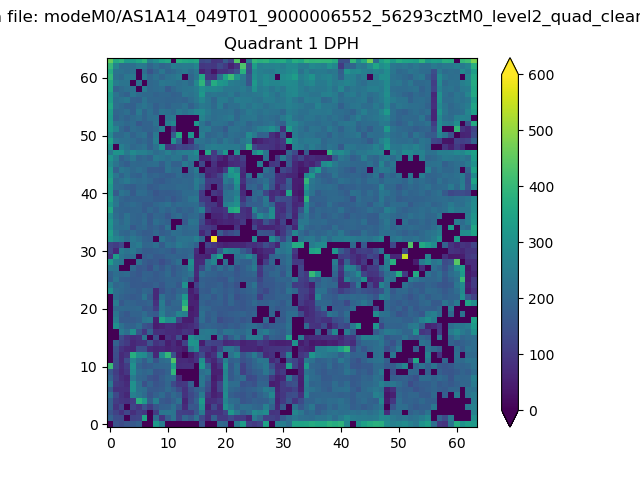 |
Quadrant B |
|---|---|---|---|
| Quadrant D | 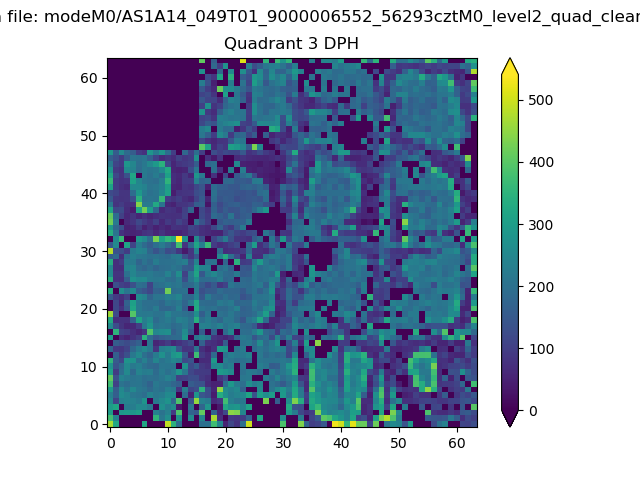 |
 |
Quadrant C |
| Plot type | Count rate plots | Images |
|---|---|---|
| Comparison with Poisson distribution Blue bars denote a histogram of data divided into 1 sec bins. Red curve is a Poisson curve with rate = median count rate of data. |
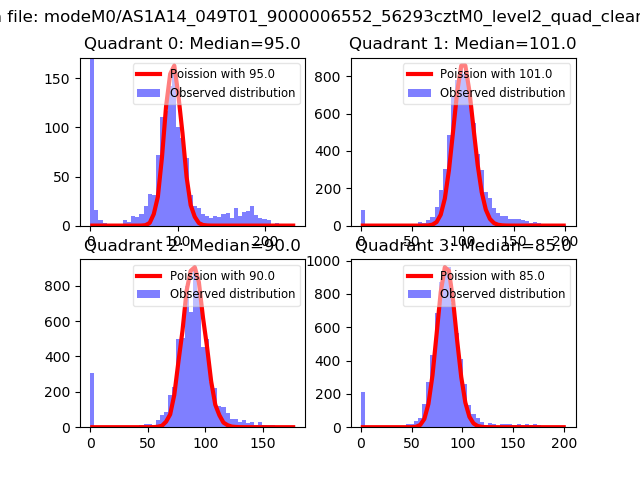 |
 |
| Quadrant-wise count rates Data is divided into 100 sec bins |
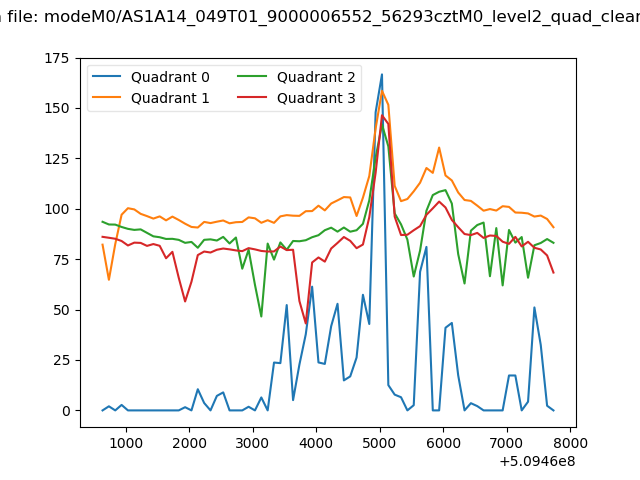 |
|
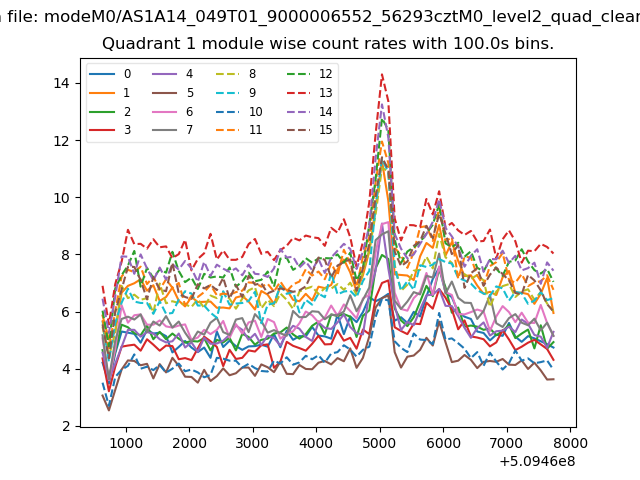
| Module-wise count rates for Quadrant A Data is divided into 100 sec bins |
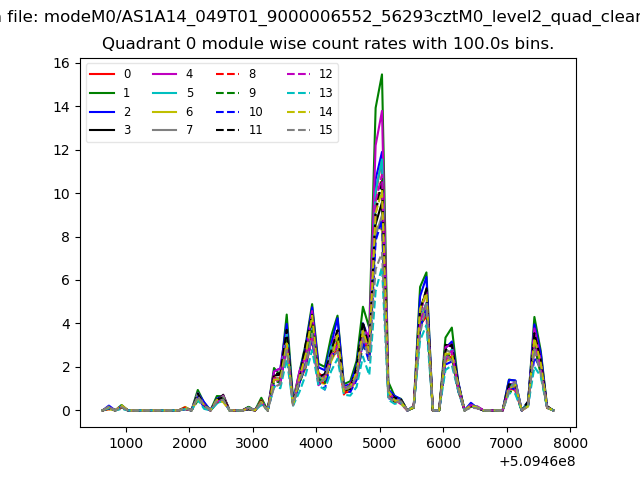 |
 |
| Module-wise count rates for Quadrant B Data is divided into 100 sec bins |
 |
 |
| Module-wise count rates for Quadrant C Data is divided into 100 sec bins |
 |
 |
| Module-wise count rates for Quadrant D Data is divided into 100 sec bins |
 |
 |
| Parameter | Plot |
|---|---|
| CZT HV Monitor |  |
| D_VDD | 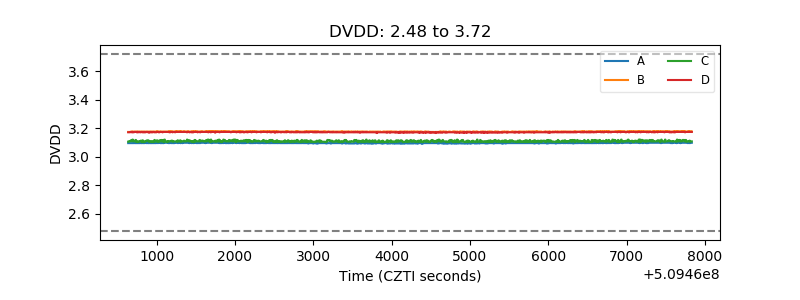 |
| Temperature 1 | 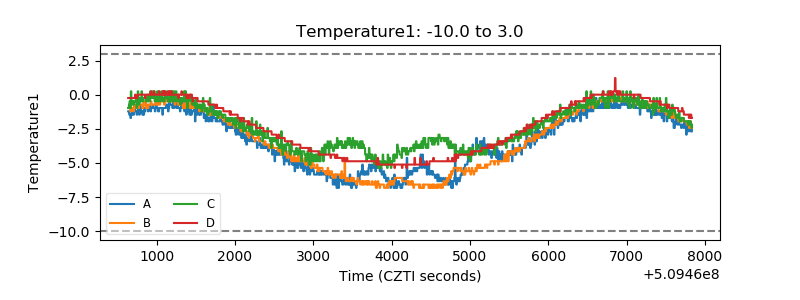 |
| Veto HV Monitor | 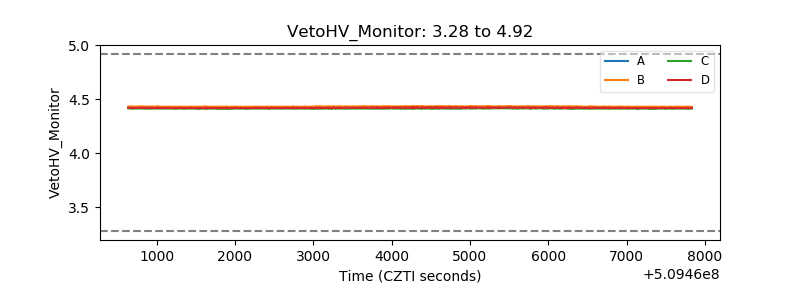 |
| Veto LLD | 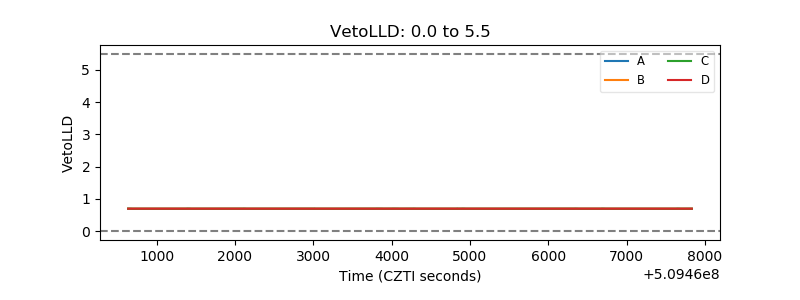 |
| Alpha Counter |  |
| _CPM_Rate | 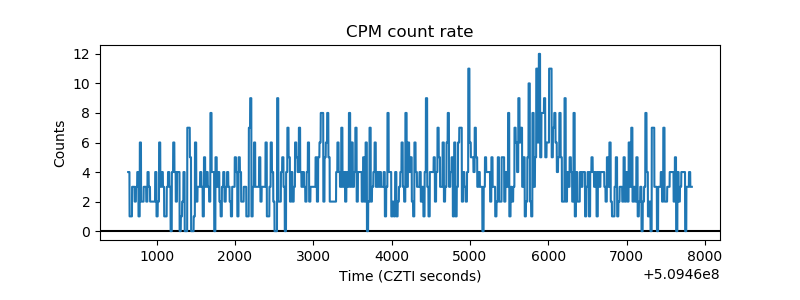 |
| CZT Counter | 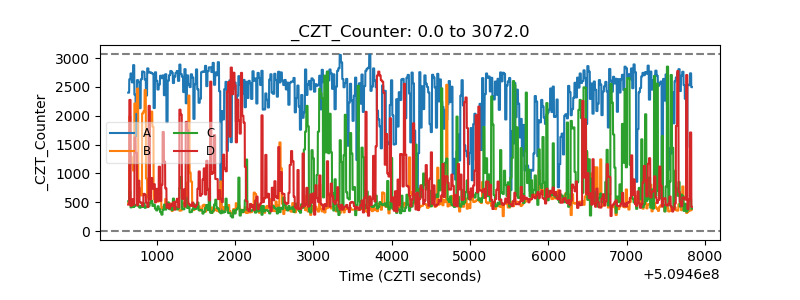 |
| +2.5 Volts monitor | 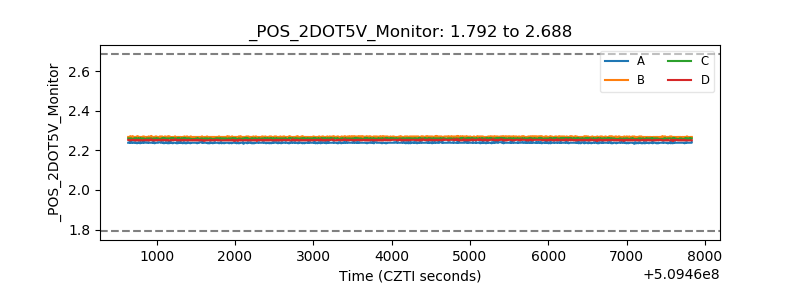 |
| +5 Volts monitor |  |
| _ROLL_ROT | 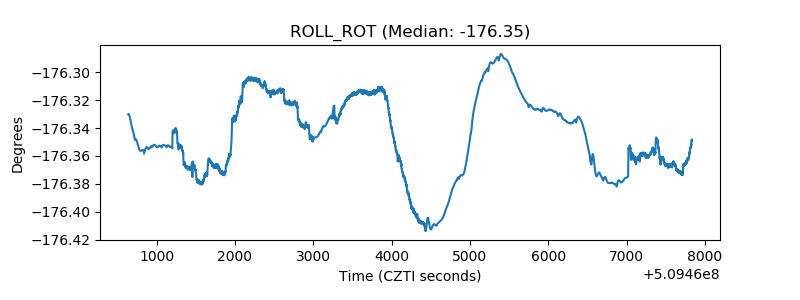 |
| _Roll_DEC | 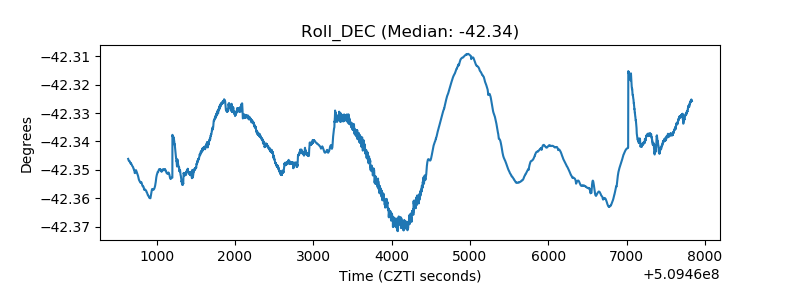 |
| _Roll_RA |  |
| Veto Counter | 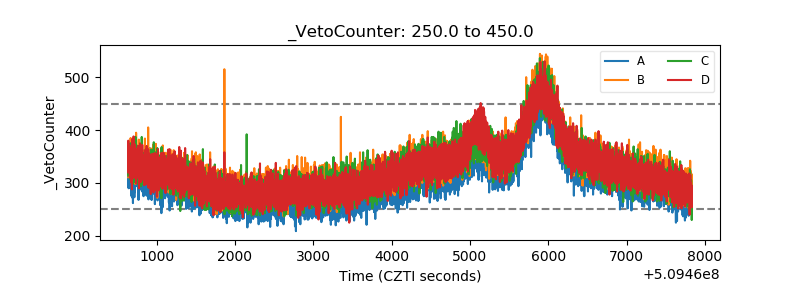 |