| Param | Original file | Final file |
|---|---|---|
| Filename | modeM0/AS1A14_049T01_9000006552_56294cztM0_level2.fits | modeM0/AS1A14_049T01_9000006552_56294cztM0_level2_quad_clean.evt |
| Size (bytes) | 780,148,800 | 85,567,680 |
| Size | 744.0 MB | 81.6 MB |
| Events in quadrant A | 14,970,972 | 217,584 |
| Events in quadrant B | 3,561,406 | 699,682 |
| Events in quadrant C | 4,718,618 | 610,941 |
| Events in quadrant D | 5,080,419 | 571,168 |
| Mode SS | |||
|---|---|---|---|
| Quadrant | BADHDUFLAG | Total packets | Discarded packets |
| A | 0 | 142 | 0 |
| B | 0 | 142 | 0 |
| C | 0 | 142 | 0 |
| D | 0 | 142 | 0 |
| Mode M0 | |||
|---|---|---|---|
| Quadrant | BADHDUFLAG | Total packets | Discarded packets |
| A | 0 | 49414 | 2 |
| B | 0 | 15815 | 0 |
| C | 0 | 19058 | 0 |
| D | 0 | 19853 | 0 |
| Quadrant | Total seconds | Saturated seconds | Saturation percentage |
|---|---|---|---|
| A | 7051 | 5028 | 71.309034% |
| B | 7051 | 142 | 2.013899% |
| C | 7051 | 284 | 4.027797% |
| D | 7052 | 298 | 4.225752% |
Noise dominated data is calculated using 1-second bins in cleaned event files. If a bin has >2000 counts, and if more than 50% of those come from <1% of pixels, then it is considered to be noise-dominated and hence unusable.
| Quadrant | # 1 sec bins | Bins with >0 counts | Bins with >2000 counts | High rate bins dominated by noise | Noise dominated (total time) | Noise dominated (detector-on time) | Marked lightcurve |
|---|---|---|---|---|---|---|---|
| A | 7050 | 7050 | 4904 | 4904 | 69.56% | 69.56% |  |
| B | 7051 | 7051 | 49 | 49 | 0.69% | 0.69% |  |
| C | 7051 | 7051 | 280 | 280 | 3.97% | 3.97% | 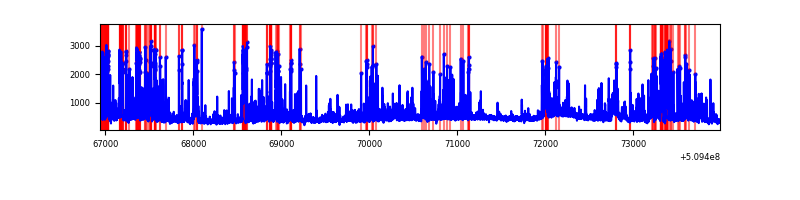 |
| D | 7052 | 7052 | 323 | 323 | 4.58% | 4.58% |  |
Top three noisy pixels from each quadrant. If the there are fewer than three noisy pixels in the level2.evt file, extra rows are filled as -1
| Pixel properties | Quadrant properties | ||||||
|---|---|---|---|---|---|---|---|
| Quadrant | DetID | PixID | Counts | Sigma | Mean | Median | Sigma |
| A | 15 | 32 | 10221280 | 91686.61 | 440 | 429 | 111.5 |
| A | 7 | 64 | 885100 | 7935.98 | 440 | 429 | 111.5 |
| A | 4 | 206 | 706971 | 6338.07 | 440 | 429 | 111.5 |
| B | 5 | 185 | 229369 | 1468.41 | 731 | 707 | 155.7 |
| B | 0 | 213 | 110405 | 704.45 | 731 | 707 | 155.7 |
| B | 7 | 252 | 87235 | 555.66 | 731 | 707 | 155.7 |
| C | 13 | 3 | 718722 | 3700.79 | 703 | 697 | 194.0 |
| C | 12 | 252 | 663985 | 3418.67 | 703 | 697 | 194.0 |
| C | 5 | 250 | 258116 | 1326.77 | 703 | 697 | 194.0 |
| D | 2 | 249 | 731473 | 3657.34 | 703 | 673 | 199.8 |
| D | 8 | 129 | 634279 | 3170.93 | 703 | 673 | 199.8 |
| D | 2 | 120 | 215277 | 1074.0 | 703 | 673 | 199.8 |
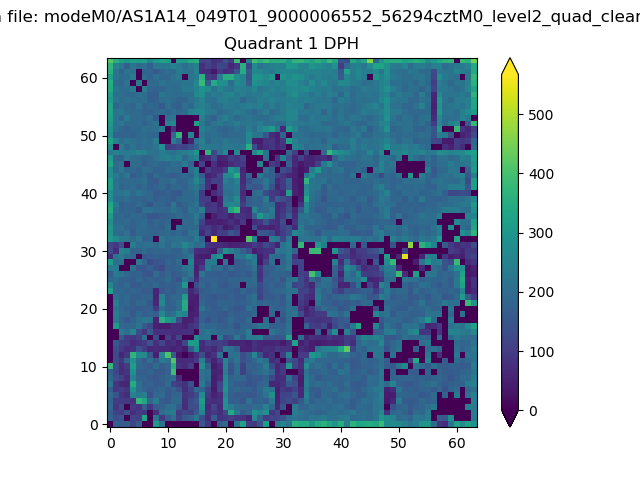
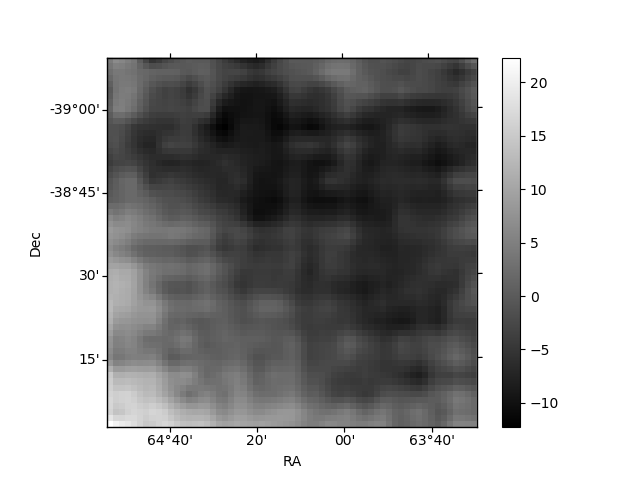
Histogram calculated using DETX and DETY for each event in the final _common_clean file
| Quadrant A |  |
 |
Quadrant B |
|---|---|---|---|
| Quadrant D | 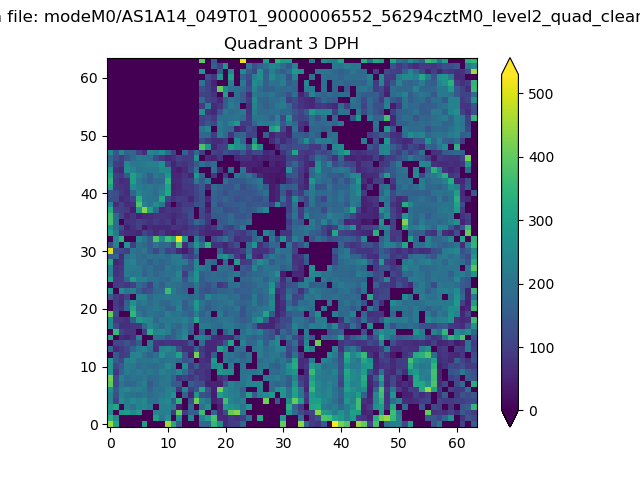 |
 |
Quadrant C |
| Plot type | Count rate plots | Images |
|---|---|---|
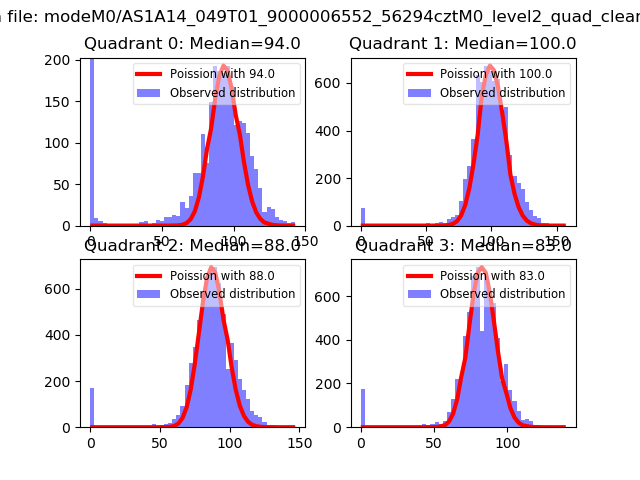
| Comparison with Poisson distribution Blue bars denote a histogram of data divided into 1 sec bins. Red curve is a Poisson curve with rate = median count rate of data. |
 |
 |
| Quadrant-wise count rates Data is divided into 100 sec bins |
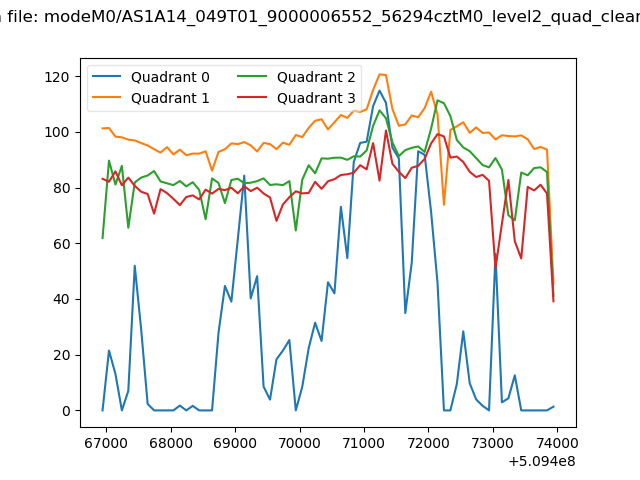 |
|
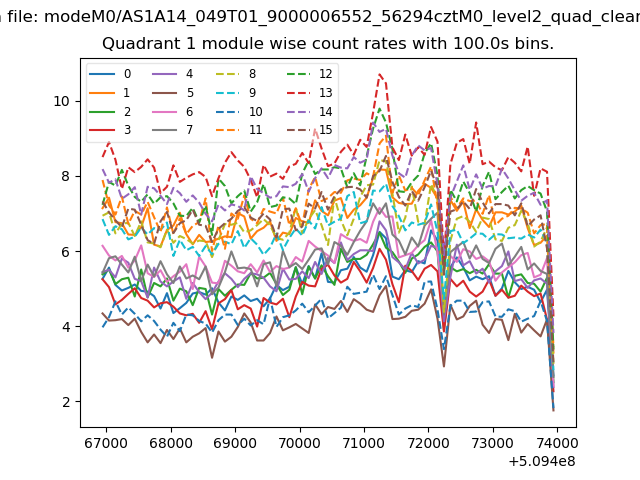
| Module-wise count rates for Quadrant A Data is divided into 100 sec bins |
 |
 |
| Module-wise count rates for Quadrant B Data is divided into 100 sec bins |
 |
 |
| Module-wise count rates for Quadrant C Data is divided into 100 sec bins |
 |
 |
| Module-wise count rates for Quadrant D Data is divided into 100 sec bins |
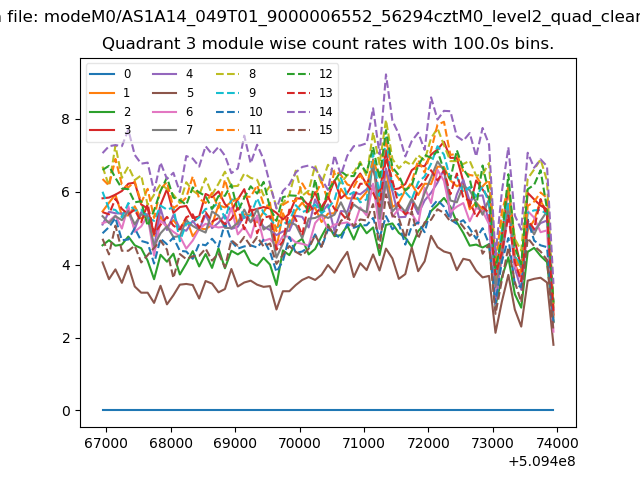 |
 |
| Parameter | Plot |
|---|---|
| CZT HV Monitor | 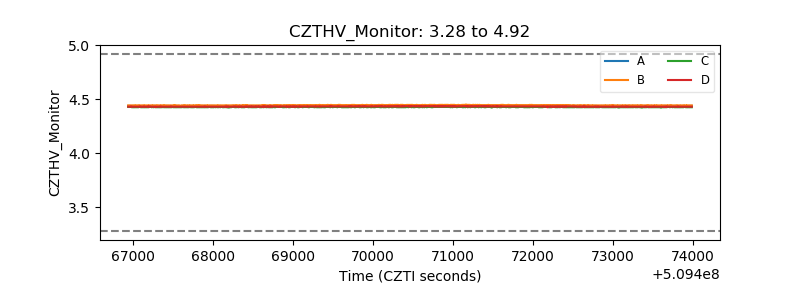 |
| D_VDD |  |
| Temperature 1 |  |
| Veto HV Monitor | 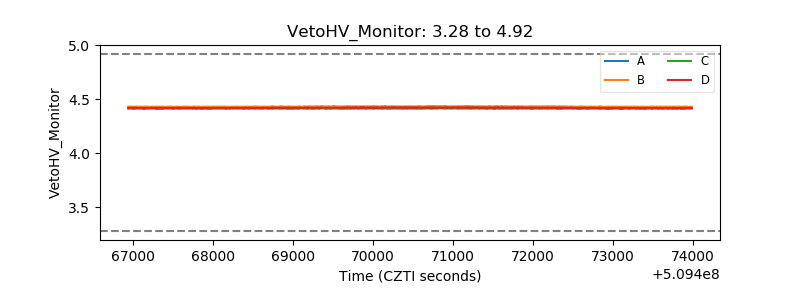 |
| Veto LLD | 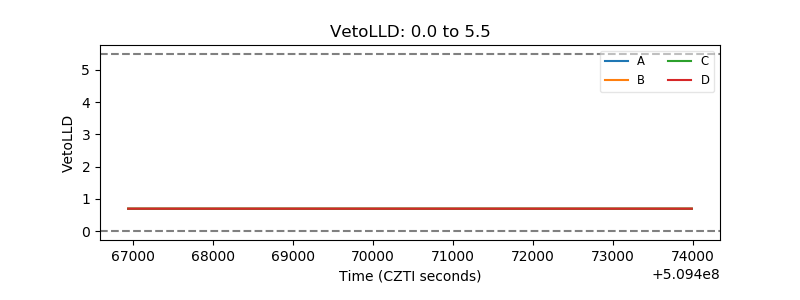 |
| Alpha Counter |  |
| _CPM_Rate | 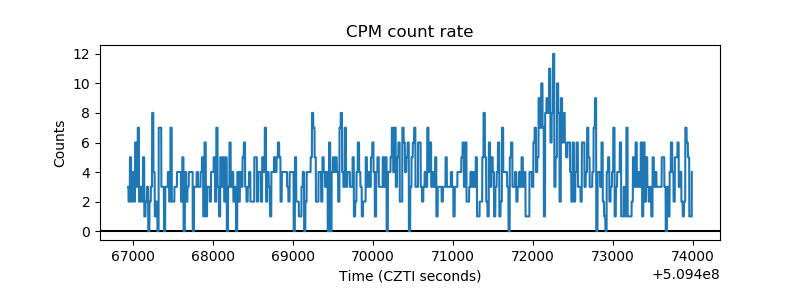 |
| CZT Counter |  |
| +2.5 Volts monitor |  |
| +5 Volts monitor | 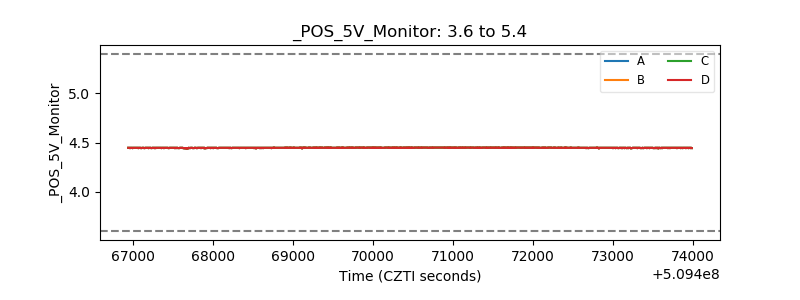 |
| _ROLL_ROT | 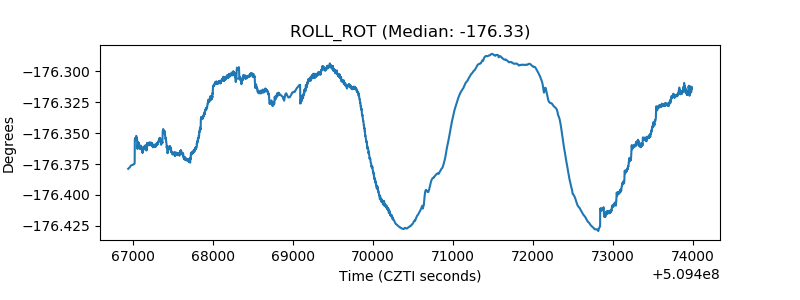 |
| _Roll_DEC | 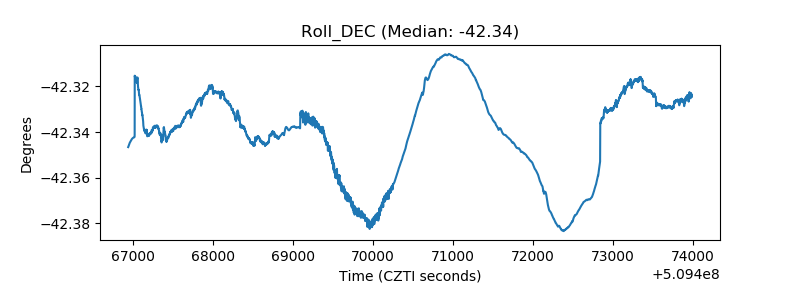 |
| _Roll_RA |  |
| Veto Counter | 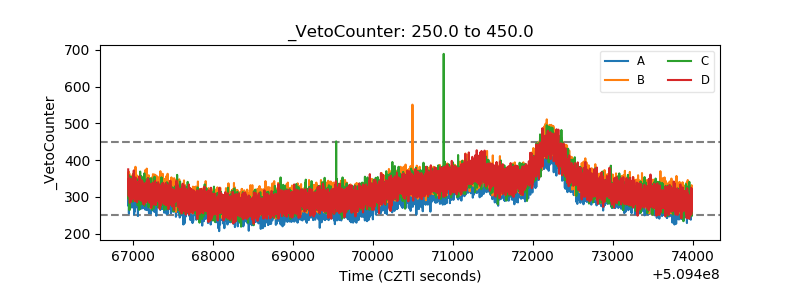 |