| Param | Original file | Final file |
|---|---|---|
| Filename | modeM0/AS1A14_049T01_9000006552_56297cztM0_level2.fits | modeM0/AS1A14_049T01_9000006552_56297cztM0_level2_quad_clean.evt |
| Size (bytes) | 1,692,774,720 | 192,525,120 |
| Size | 1.6 GB | 183.6 MB |
| Events in quadrant A | 27,775,262 | 791,185 |
| Events in quadrant B | 7,676,611 | 1,546,814 |
| Events in quadrant C | 13,832,194 | 1,182,246 |
| Events in quadrant D | 12,168,807 | 1,228,582 |
| Mode SS | |||
|---|---|---|---|
| Quadrant | BADHDUFLAG | Total packets | Discarded packets |
| A | 0 | 314 | 0 |
| B | 0 | 314 | 0 |
| C | 0 | 314 | 0 |
| D | 0 | 314 | 0 |
| Mode M9 | |||
|---|---|---|---|
| Quadrant | BADHDUFLAG | Total packets | Discarded packets |
| A | 0 | 4 | 0 |
| B | 0 | 4 | 0 |
| C | 0 | 4 | 0 |
| D | 0 | 4 | 0 |
| Mode M0 | |||
|---|---|---|---|
| Quadrant | BADHDUFLAG | Total packets | Discarded packets |
| A | 0 | 93369 | 1 |
| B | 0 | 34627 | 1 |
| C | 0 | 52286 | 1 |
| D | 0 | 47180 | 1 |
| Quadrant | Total seconds | Saturated seconds | Saturation percentage |
|---|---|---|---|
| A | 15649 | 7545 | 48.213943% |
| B | 15649 | 224 | 1.431401% |
| C | 15650 | 2242 | 14.325879% |
| D | 15649 | 906 | 5.789507% |
Noise dominated data is calculated using 1-second bins in cleaned event files. If a bin has >2000 counts, and if more than 50% of those come from <1% of pixels, then it is considered to be noise-dominated and hence unusable.
| Quadrant | # 1 sec bins | Bins with >0 counts | Bins with >2000 counts | High rate bins dominated by noise | Noise dominated (total time) | Noise dominated (detector-on time) | Marked lightcurve |
|---|---|---|---|---|---|---|---|
| A | 16014 | 15649 | 7217 | 7217 | 45.07% | 46.12% |  |
| B | 16014 | 15650 | 142 | 142 | 0.89% | 0.91% | 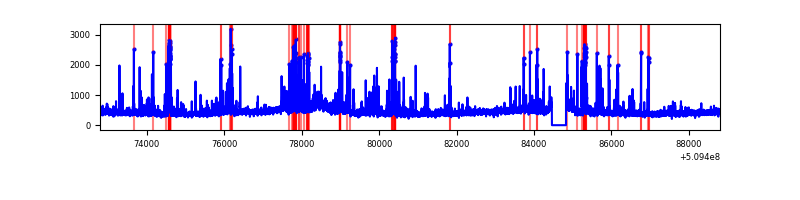 |
| C | 16014 | 15650 | 1923 | 1923 | 12.01% | 12.29% |  |
| D | 16014 | 15650 | 1001 | 1001 | 6.25% | 6.40% |  |
Top three noisy pixels from each quadrant. If the there are fewer than three noisy pixels in the level2.evt file, extra rows are filled as -1
| Pixel properties | Quadrant properties | ||||||
|---|---|---|---|---|---|---|---|
| Quadrant | DetID | PixID | Counts | Sigma | Mean | Median | Sigma |
| A | 15 | 32 | 16104762 | 50359.52 | 1262 | 1233 | 319.8 |
| A | 3 | 98 | 1593463 | 4979.28 | 1262 | 1233 | 319.8 |
| A | 4 | 206 | 1441840 | 4505.12 | 1262 | 1233 | 319.8 |
| B | 5 | 185 | 319368 | 926.69 | 1613 | 1553 | 343.0 |
| B | 10 | 247 | 236863 | 686.12 | 1613 | 1553 | 343.0 |
| B | 7 | 252 | 194175 | 561.65 | 1613 | 1553 | 343.0 |
| C | 5 | 250 | 2706827 | 6650.37 | 1467 | 1453 | 406.8 |
| C | 12 | 252 | 1795490 | 4410.11 | 1467 | 1453 | 406.8 |
| C | 15 | 198 | 1306380 | 3207.78 | 1467 | 1453 | 406.8 |
| D | 8 | 129 | 1889307 | 4284.91 | 1537 | 1470 | 440.6 |
| D | 5 | 32 | 1194160 | 2707.11 | 1537 | 1470 | 440.6 |
| D | 2 | 249 | 981327 | 2224.03 | 1537 | 1470 | 440.6 |
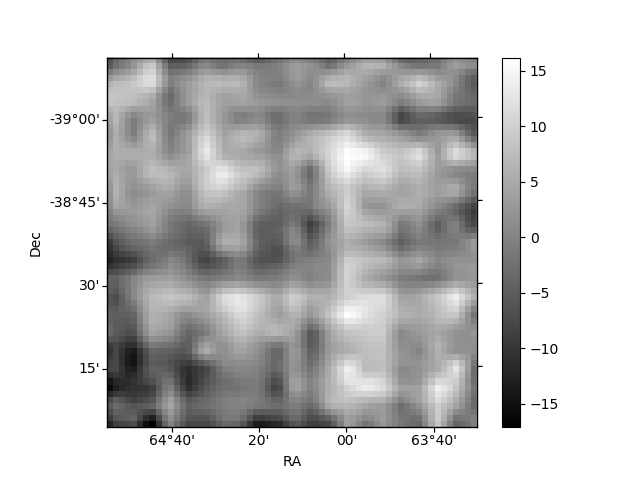
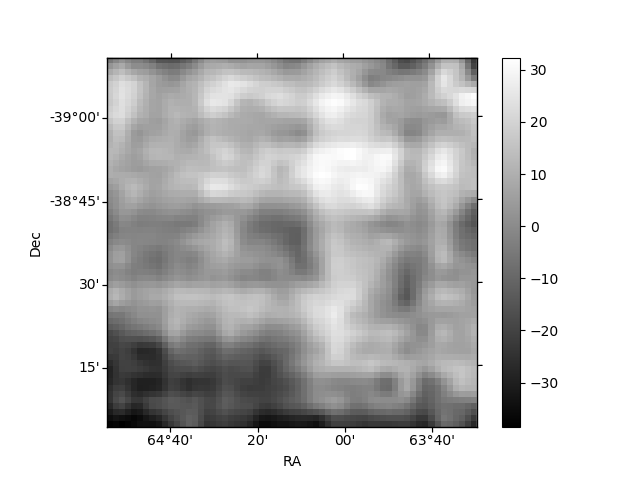
Histogram calculated using DETX and DETY for each event in the final _common_clean file
| Quadrant A | 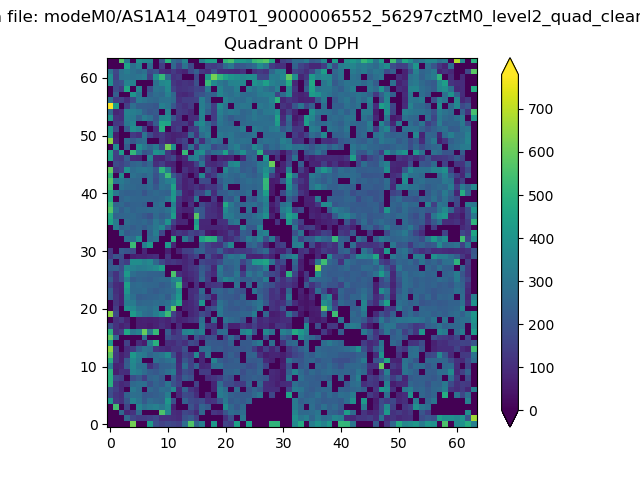 |
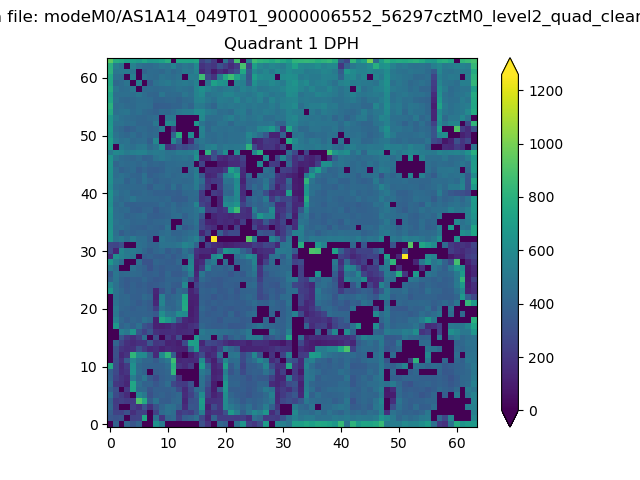 |
Quadrant B |
|---|---|---|---|
| Quadrant D | 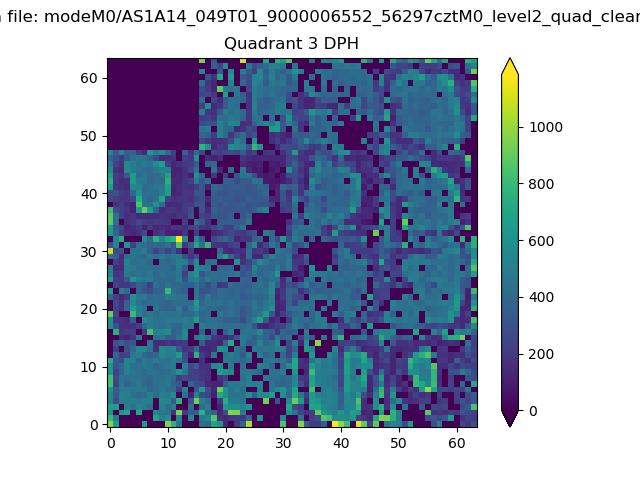 |
 |
Quadrant C |
| Plot type | Count rate plots | Images |
|---|---|---|
| Comparison with Poisson distribution Blue bars denote a histogram of data divided into 1 sec bins. Red curve is a Poisson curve with rate = median count rate of data. |
 |
 |
| Quadrant-wise count rates Data is divided into 100 sec bins |
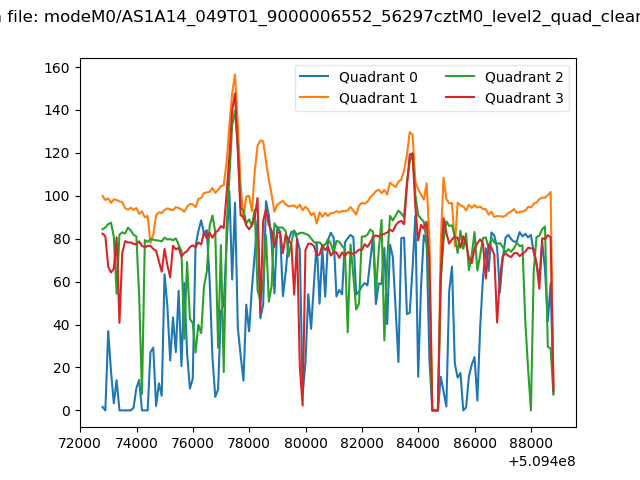 |
|
| Module-wise count rates for Quadrant A Data is divided into 100 sec bins |
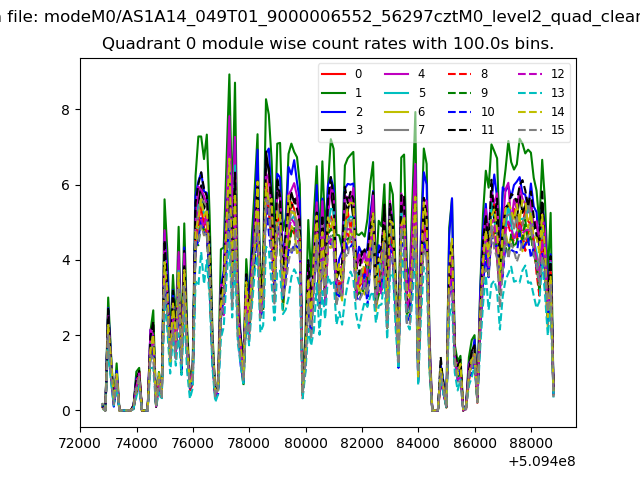 |
 |
| Module-wise count rates for Quadrant B Data is divided into 100 sec bins |
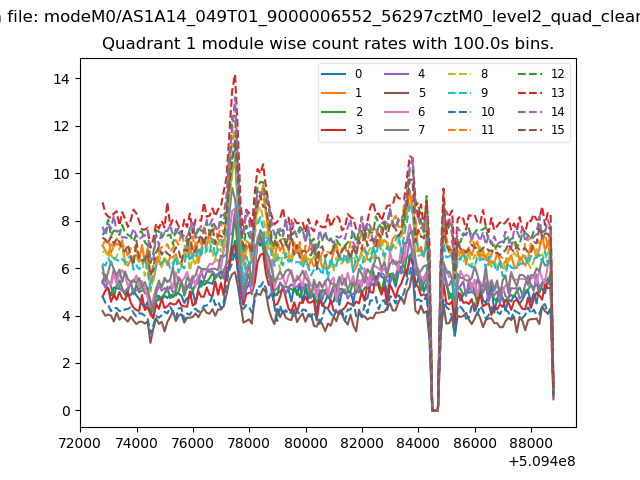 |
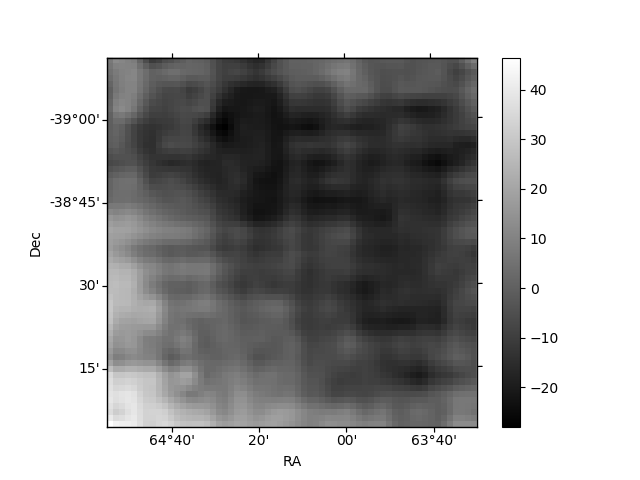 |
| Module-wise count rates for Quadrant C Data is divided into 100 sec bins |
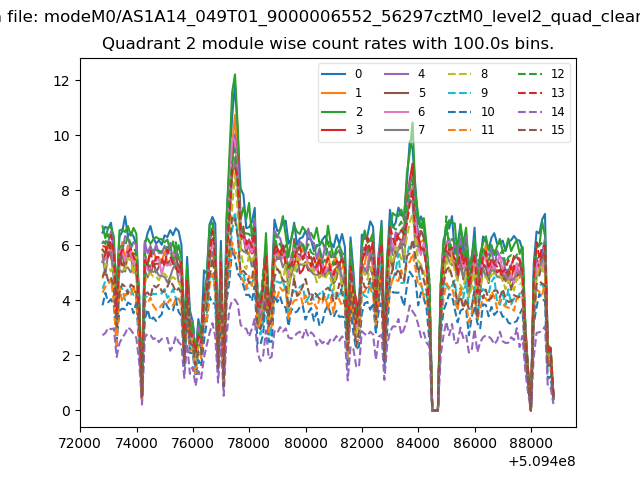 |
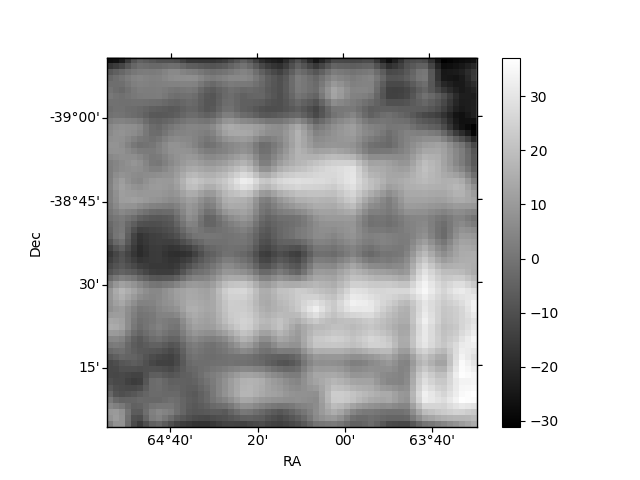 |
| Module-wise count rates for Quadrant D Data is divided into 100 sec bins |
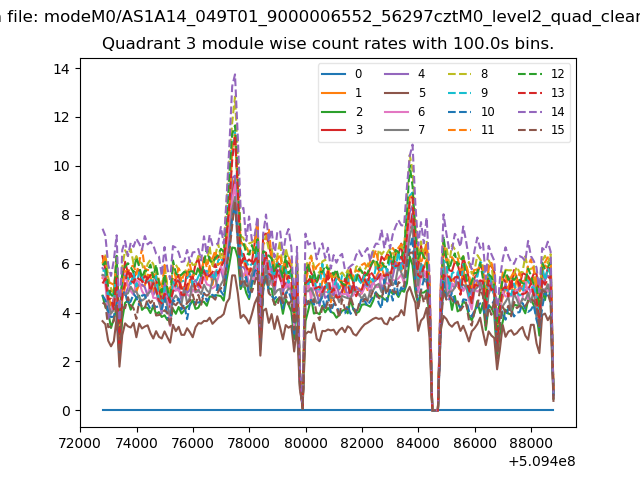 |
 |
| Parameter | Plot |
|---|---|
| CZT HV Monitor | 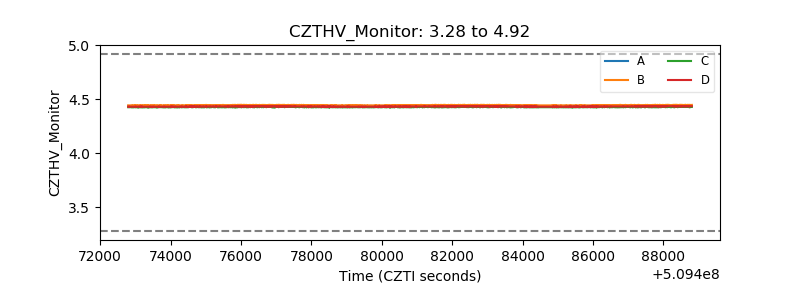 |
| D_VDD |  |
| Temperature 1 | 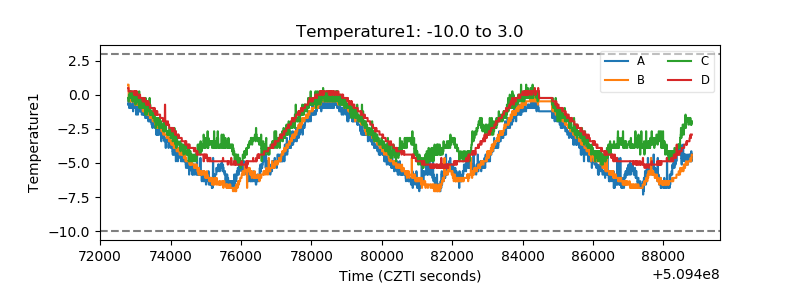 |
| Veto HV Monitor | 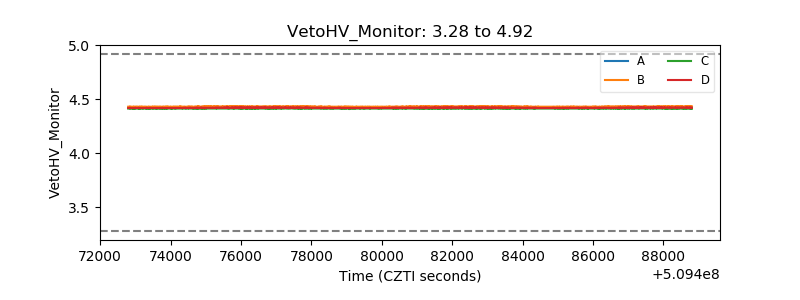 |
| Veto LLD |  |
| Alpha Counter |  |
| _CPM_Rate |  |
| CZT Counter | 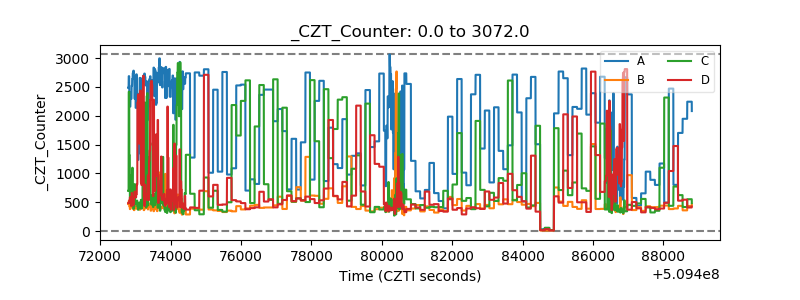 |
| +2.5 Volts monitor | 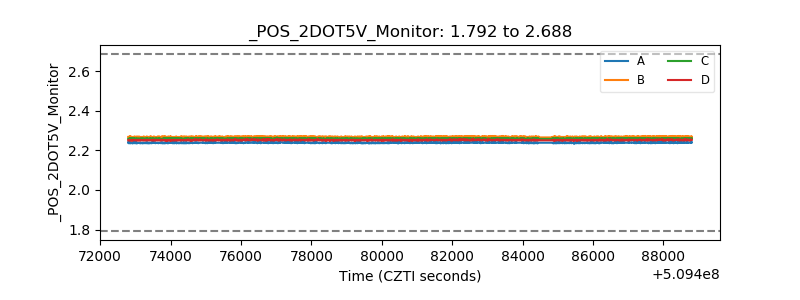 |
| +5 Volts monitor |  |
| _ROLL_ROT | 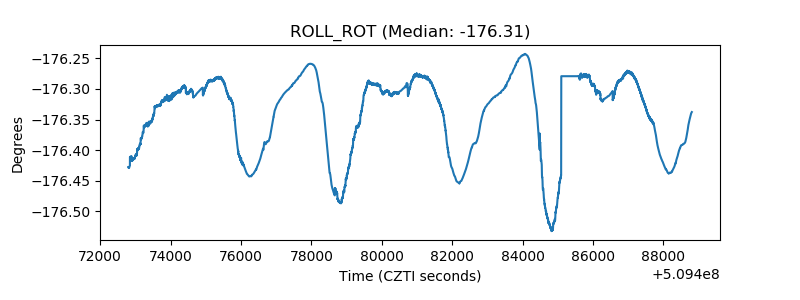 |
| _Roll_DEC | 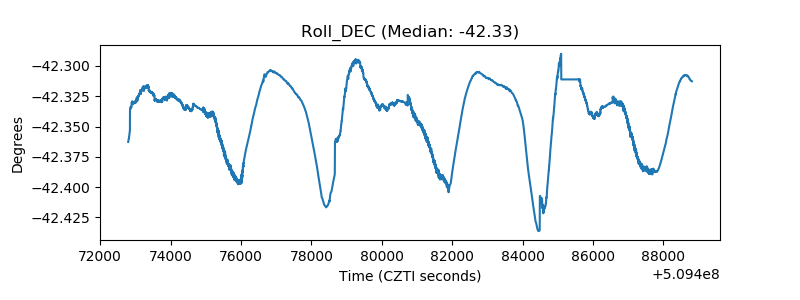 |
| _Roll_RA |  |
| Veto Counter | 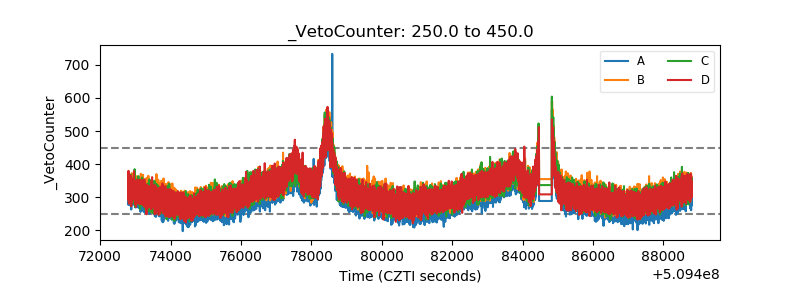 |